Mission Control Dashboard (AI, Crypto, Liquidity) FASTCONCEPT Price is a lagging indicator. Liquidity is a leading indicator. "Mission Control Dashboard (AI, Crypto, Liquidity) FAST" is a sophisticated macroeconomic dashboard designed to audit the "plumbing" of the financial system in real-time. Unlike standard indicators that rely solely on price action, this tool pulls data from the Federal Reserve (FRED), Treasury Statements, Corporate Financials (10-K/10-Q), and On-Chain Stablecoin metrics to visualize the structural flows driving the market.
THE "UNIFIED FIELD" SOLVER One of the hardest challenges in cross-asset scripting is "Time Dilation"—synchronizing 24/7 Crypto markets (Bitcoin) with Mon-Fri Traditional markets (Stocks/Bonds).
Standard scripts fail on weekends, showing mismatched data.
This engine uses a Weekly Anchor system. It calculates all momentum and liquidity metrics based on "Week-to-Date" or "Month-Ago" anchors. This ensures that a "Liquidity Drain" looks identical whether you are viewing a Bitcoin chart on Saturday or an Apple chart on Monday.
THE CHRONOS LOGIC The dashboard is sorted by Time Sensitivity (Speed of impact), from fast-twitch tactical signals to slow-moving structural fundamentals.
1. TACTICAL (Reacts in 24–48h)
Stablecoin Flight: Measures the immediate flow of capital from Volatile Assets to Stablecoins (USDT/USDC). A spike (>0.5%) indicates fear/sidelining.
Liquidity Alpha: Calculates the efficiency of capital. It subtracts "Friction" (Dollar Strength + Yields) from "Flow" (Liquidity Beta). High Alpha means money is flowing easily into risk assets.
Alt Euphoria: Tracks the overheating of the Altcoin market (TOTAL3). Green indicates sustainable growth; Red (>45%) warns of a "blow-off top."
Retail FOMO: A sentiment gauge comparing Coinbase Stock ( NASDAQ:COIN ) performance vs. Bitcoin ( CRYPTOCAP:BTC ). When Retail outperforms the Asset, local tops often follow.
2. LIQUIDITY & MACRO (Reacts in 1–4 Weeks)
Debt Wall (10Y): The Rate-of-Change of the US 10-Year Treasury Yield. Spiking yields act as gravity on risk assets.
Liquidity Beta: The raw "Quantity of Money." Tracks the 4-week change in Net Liquidity (Fed Balance Sheet - TGA + Stablecoins).
TGA Balance: The Critical Monitor. Tracks the Treasury General Account. When the TGA rises (Red), the government is draining liquidity from the banking system. When it falls (Green), it releases cash.
Note: This script includes an auto-scaler to handle TGA data in both Billions and Millions.
3. STRUCTURAL (Reacts in 3–12 Months)
AI Capex (YoY & QoQ): The "Floor" of the 2025/2026 cycle. Tracks the Capital Expenditure of the Hyperscalers (MSFT, GOOGL, AMZN, META). As long as this remains high (>30%), the infrastructure boom supports the tech narrative.
PMI Manufacturing: Tracks the ISM Manufacturing cycle. Contraction (<50) often forces Fed intervention.
Micron Inventory: A lead indicator for the hardware cycle.
HOW TO USE
Status Colors: The traffic light system helps you assess risk at a glance.
🟢 GREEN (Healthy): Flow is positive, friction is low, fundamentals are strong.
🔴 RED (Danger): Liquidity is draining (TGA spike), yields are shock-rising, or FOMO is excessive.
Zero Configuration: The script auto-detects asset classes and scales units (Billions/Trillions) automatically.
DATA SOURCES
Federal Reserve Economic Data (FRED)
Daily Treasury Statement (DTS)
CryptoCap (TradingView)
Nasdaq/Corporate Financials
Disclaimer: This tool is for informational purposes only and does not constitute financial advice. Macro data feeds are subject to reporting delays.
Поиск скриптов по запросу "the script"

Range Breakout Statistics [Honestcowboy]⯁ Overview
The Range Breakout Statistics uses a very simple system to detect ranges/consolidating markets. The principle is simple, it looks for areas where the slope of a moving average is flat compared to past values. If the moving average is flat for X amount of bars that's a range and it will draw a box.
The statistics part of the script is a bit more complicated. The aim of this script is to expand analysis of trading signals in a different way than a regular backtest. It also highlights the polyline tool, one of my favorite drawing tools on the tradingview platform.
⯁ Statistics Methods
The script has 2 different modes of analyzing a trading signals strength/robustness. It will do that for 2 signals native to the script.
Upper breakout: first price breakout at top of box, before max bars (100 bars by default)
Lower breakout: first price breakout at bottom of box, before max bars
The analysis methods themselves are straightforward and it should be possible for tradingview community to expand this type of analysis to other trading signals. This script is a demo for this analysis, yet some might still find the native signals helpful in their trading, that's why the script includes alerts for the 2 native signals. I've also added a setting to disable any data gathering, which makes script run faster if you want to automate it.
For both of the analysis methods it uses the same data, just with different calculations and drawing methods. The data set is all past price action reactions to the signals saved in a matrix. Below a chart for explaining this visually.
⯁ Method 1: Averages Projection
The idea behind this is that just showing all price action that happened after signal does not give actionable insights. It's more a spaghetti jumble mess of price action lines. So instead the script averages the data out using 3 different approaches, all selectable in the settings menu.
Geometric Average: useful as it accurately reflects compound returns over time, smoothing out the impact of large gains or losses. Accounts for volatility drift.
Arithmetic Average: a standard average calculation, can be misleading in trading due to volatility drift. It is the most basic form of averaging so I included it.
Median: useful as any big volatility huge moves after a signal does not really impact the mean as it's just the middle value of all values.
These averages are the 2 lines you will find in the middle of the projection. Having a clear difference between a lower break average and upper break average price reaction can signal significance of the trading signal instead of pure chaos.
Outside of this I also included calculations for the maximum and minimum values in the dataset. This is useful for seeing price reactions range to the signal, showing extreme losses or wins are possible. For this range I also included 2 matrices of highs and lows data. This makes it possible to draw a band between the range based on closing price and the one using high/low data.
Below is a visualisation of how the averages data is shown on chart.
⯁ Method 2: Equity Simulation
This method will feel closer to home for traders as it more closely resembles a backtest. It does not include any commissions however and also is just a visualisation of price reaction to a signal. This method will simulate what would happen if you would buy at the breakout point and hold the trade for X amount of bars. With 0 being sell at same bar close. To test robustness I've given the option to visualise Equity simulation not just for 1 simulation but a bunch of simulations.
On default settings it will draw the simulations for 0 bars holding all the way to 10 bars holding. The idea behind it is to check how stable the effect is, to have further confirmation of the significance of the signal. If price simulation line moves up on average for 0 bars all the way to 10 bars holding time that means the signal is steady.
Below is a visualisation of the Equity Simulation.
⯁ Signal filtering
For the boxes themselves where breakouts come from I've included a simple filter based on the size of the box in ATR or %. This will filter out all the boxes that are larger top to bottom than the ATR or % value you setup.
⯁ Coloring of Script
The script includes 5 color themes. There are no color settings or other visual settings in the script, the script themes are simple and always have colors that work well together. Equity simulation uses a gradient based on lightness to color the different lines so it's easier to differentiate them while still upper breaks having a different color than lower breaks.
This script is not created to be used in conjunction with other scripts, it will force you into a background color that matches the theme. It's purpose is a research tool for systematic trading, to analyse signals in more depth.
Metaverse color theme:
⯁ Conclusion
I hope this script will help traders get a deeper understanding of how different assets react to their assets. It should be possible to convert this script into other signals if you know how to code on the platform. It is my intention to make more publications that include this type of analysis. It is especially useful when dealing with signals that do not happen often enough, so a regular backtest is not enough to test their significance.

Professional Grid & Reversal Bot v10 (Binance Style)Professional Grid & Reversal Bot v10 (Binance Style) – Open Source & Educational
About this Script:
This script is an advanced Grid Trading & Smart Reversal strategy, inspired by professional Binance-style execution. It is designed as an educational, open-source tool for traders who want to understand market dynamics, grid logic, and risk management.
How it Works:
1️⃣ Grid Execution:
• Divides the price range between the high and low into multiple levels (Grids).
• Opens Buy orders in the lower half and Sell orders in the upper half.
• Levels are calculated dynamically based on the highest and lowest prices over a selected lookback period.
2️⃣ Smart Reversal System:
• Detects price touches on the high or low range boundaries to identify potential reversal points.
• Opens Buy orders at the lows and Sell orders at the highs using a configurable confirmation percentage (revPct).
• Helps traders capture short-term price swings effectively.
3️⃣ Risk & Size Management:
• Position sizing based on USD amount and leverage.
• Automatic Take Profit (TP) and Stop Loss (SL) for every trade.
• Controls overtrading via the "pyramiding" parameter (max open trades).
4️⃣ Advanced Visualization:
• Plots the grid range with high/low levels and fills the background for clear context.
• Highlights potential Supply and Demand Zones.
• Displays a dynamic "Binance-style" Order Book table showing Side, Price, Quantity, and PnL.
5️⃣ Key Counters & Indicators:
• levelsArr → Stores all grid levels for execution and plotting.
• touchedHigh / touchedLow → Monitors range touches to trigger reversals.
• strategy.openprofit → Displays live open trade PnL directly on the chart.
Additional Features:
• Supports both English and Arabic languages.
• Dark Theme optimized for readability.
• Dynamic control panel updates on every bar.
• Flexible settings for Auto or Manual grid range updates.
User Guidance:
• This script is for educational purposes only; it does not guarantee profits.
• We recommend adjusting Grid Levels, Reversal Percentage, and Trade Size to experiment with different strategies.
Community Engagement:
• Suggestions and improvements are welcome! 💡
• If you have ideas for new features, let's develop them together to enhance learning.
• Please support the script with a Like & Boost if you find it useful.
• Encourages knowledge sharing to improve collective performance.
License:
Creative Commons Attribution-NonCommercial 4.0 International (CC BY-NC 4.0)
Free for educational use only. Please give credit to the author when sharing or modifying the script.

Elliott Wave Full Fractal System v2.0Elliott Wave Full Fractal System v2.0 – Q.C. FINAL (Guaranteed R/R)
Elliott Wave Full Fractal System is a multi-timeframe wave engine that automatically labels Elliott impulses and ABC corrections, then builds a rule-based, ATR-driven risk/reward framework around the “W3–W4–W5” leg.
“Guaranteed R/R” here means every order is placed with a predefined stop-loss and take-profit that respect a minimum Reward:Risk ratio – it does not mean guaranteed profits.
Core Idea
This strategy turns a full fractal Elliott Wave labelling engine into a systematic trading model.
It scans fractal pivots on three wave degrees (Primary, Intermediate, Minor) to detect 5-wave impulses and ABC corrections.
A separate “Trading Degree” pivot stream, filtered by a 200-EMA trend filter and ATR-based dynamic pivots, is then used to find W4 pullback entries with a minimum, user-defined Reward:Risk ratio.
Default Properties & Risk Assumptions
The backtest uses realistic but conservative defaults:
// Default properties used for backtesting
strategy(
"Elliott Wave Full Fractal System - Q.C. FINAL (Guaranteed R/R)",
overlay = true,
initial_capital = 10000, // realistic account size
default_qty_type = strategy.percent_of_equity,
default_qty_value = 1, // 1% risk per trade
commission_type = strategy.commission.cash_per_contract,
commission_value = 0.005, // example stock commission
slippage = 0 // see notes below
)
Account size: 10,000 (can be changed to match your own account).
Position sizing: 1% of equity per trade to keep risk per idea sustainable and aligned with TradingView’s recommendations.
Commission: 0.005 cash per contract/share as a realistic example for stock trading.
Slippage: set to 0 in code for clarity of “pure logic” backtesting. Real-life trading will experience slippage, so users should adjust this according to their market and broker.
Always re-run the backtest after changing any of these values, and avoid using high risk fractions (5–10%+) as that is rarely sustainable.
1. Full Fractal Wave Engine
The script builds and maintains four pivot streams using ATR-adaptive fractals:
Primary Degree (Macro Trend):
Captures the large swings that define the major trend. Labels ①–⑤ and ⒶⒷⒸ using blue “Circle” labels and thicker lines.
Intermediate Degree (Trading Degree):
Captures the medium swings (swing-trading horizon). Uses teal labels ( (1)…(5), (A)(B)(C) ).
Minor Degree (Micro Structure):
Tracks short-term swings inside the larger waves. Uses red roman numerals (i…v, a b c).
ABC Corrections (Optional):
When enabled, the engine tries to detect standard A–B–C corrective structures that follow a completed 5-wave impulse and plots them with dashed lines.
Each degree uses a dynamic pivot lookback that expands when ATR is above its EMA, so the system naturally requires “stronger” pivots in volatile environments and reacts faster in quiet conditions.
2. Theory Rules & Strict Mode
Normal Mode: More permissive detection. Designed to show more wave structures for educational / exploratory use.
Strict Mode: Enforces key Elliott constraints:
Wave 3 not shorter than waves 1 and 5.
No invalid W4 overlap with W1 (for standard impulses).
ABC Logic: After a confirmed bullish impulse, the script expects a down-up-down corrective pattern (A,B,C). After a bearish impulse, it looks for up-down-up.
3. Trend Filter & Pivots
EMA Trend Filter: A configurable EMA (default 200) is used as a non-wave trend filter.
Price above EMA → Only long setups are considered.
Price below EMA → Only short setups are considered.
ATR-Adaptive Pivots: The pivot engine scales its left/right bars based on current ATR vs ATR EMA, making waves and trading pivots more robust in volatile regimes.
4. Dynamic Risk Management (Guaranteed R/R Engine)
The trading engine is designed around risk, not just pattern recognition:
ATR-Based Stop:
Stop-loss is placed at:
Entry ± ATR × Multiplier (user-configurable, default 2.0).
This anchors risk to current volatility.
Minimum Reward:Risk Ratio:
For each setup, the script:
Computes the distance from entry to stop (risk).
Projects a take-profit target at risk × min_rr_ratio away from entry.
Only accepts the setup if risk is positive and the required R:R ratio is achievable.
Result: Every order is created with both TP and SL at a predefined distance, so each trade starts with a known, minimum Reward:Risk profile by design.
“Guaranteed R/R” refers exclusively to this order placement logic (TP/SL geometry), not to win-rate or profitability.
5. Trading Logic – W3–W4–W5 Pattern
The Trading pivot stream (separate from visual wave degrees) looks for a simple but powerful pattern:
Bullish structure:
Sequence of pivots forms a higher-high / higher-low pattern.
Price is above the EMA trend filter.
A strong “W3” leg is confirmed with structure rules (optionally stricter in Strict mode).
Entry (Long – W4 Pullback):
The “height” of W3 is measured.
Entry is placed at a configurable Fibonacci pullback (default 50%) inside that leg.
ATR-based stop is placed below entry.
Take-profit is projected to satisfy min Reward:Risk.
Bearish structure:
Mirrored logic (lower highs/lows, price below EMA, W3 down, W4 retrace up, W5 continuation down).
Once a valid setup is found, the script draws a colored box around the entry zone and a label describing the type of signal (“LONG SETUP” or “SHORT SETUP”) with the suggested limit price.
6. Orders & Execution
Entry Orders: The strategy uses limit orders at the computed W4 level (“Sniper Long” or “Sniper Short”).
Exits: A single strategy.exit() is attached to each entry with:
Take-profit at the projected minimum R:R target.
Stop-loss at ATR-based level.
One Trade at a Time: New setups are only used when there is no open position (strategy.opentrades == 0) to keep the logic clear and risk contained.
7. Visual Guide on the Chart
Wave Labels:
Primary: ①,②,③,④,⑤, ⒶⒷⒸ
Intermediate: (1)…(5), (A)(B)(C)
Minor: i…v, a b c
Trend EMA: Single blue EMA showing the dominant trend.
Setup Boxes:
Green transparent box → long entry zone.
Red transparent box → short entry zone.
Labels: “LONG SETUP / SHORT SETUP” labels mark the proposed limit entry with price.
8. How to Use This Strategy
Attach the strategy to your chart
Choose your market (stocks, indices, FX, crypto, futures, etc.) and timeframe (for example 1h, 4h, or Daily). Then add the strategy to the chart from your Scripts list.
Start with the default settings
Leave all inputs on their defaults first. This lets you see the “intended” behaviour and the exact properties used for the published backtest (account size, 1% risk, commission, etc.).
Study the wave map
Zoom in and out and look at the three wave degrees:
Blue circles → Primary degree (big picture trend).
Teal (1)…(5) → Intermediate degree (swing structure).
Red i…v → Minor degree (micro waves).
Use this to understand how the engine is interpreting the Elliott structure on your symbol.
Watch for valid setups
Look for the coloured boxes and labels:
Green box + “LONG SETUP” label → potential W4 pullback long in an uptrend.
Red box + “SHORT SETUP” label → potential W4 pullback short in a downtrend.
Only trades in the direction of the EMA trend filter are allowed by the strategy.
Check the Reward:Risk of each idea
For each setup, inspect:
Limit entry price.
ATR-based stop level.
Projected take-profit level.
Make sure the minimum Reward:Risk ratio matches your own rules before you consider trading it.
Backtest and evaluate
Open the Strategy Tester:
Verify you have a decent sample size (ideally 100+ trades).
Check drawdowns, average trade, win-rate and R:R distribution.
Change markets and timeframes to see where the logic behaves best.
Adapt to your own risk profile
If you plan to use it live:
Set Initial Capital to your real account size.
Adjust default_qty_value to a risk level you are comfortable with (often 0.5–2% per trade).
Set commission and slippage to realistic broker values.
Re-run the backtest after every major change.
Use as a framework, not a signal machine
Treat this as a structured Elliott/R:R framework:
Filter signals by higher-timeframe trend, major S/R, volume, or fundamentals.
Optionally hide some wave degrees or ABC labels if you want a cleaner chart.
Combine the system’s structure with your own trade management and discretion.
Best Practices & Limitations
This is an approximate Elliott Wave engine based on fractal pivots. It does not replace a full discretionary Elliott analysis.
All wave counts are algorithmic and can differ from a manual analyst’s interpretation.
Like any backtest, results depend heavily on:
Symbol and timeframe.
Sample size (more trades are better).
Realistic commission/slippage settings.
The 0-slippage default is chosen only to show the “raw logic”. In real markets, slippage can significantly impact performance.
No strategy wins all the time. Losing streaks and drawdowns will still occur even with a strict R:R framework.
Disclaimer
This script is for educational and research purposes only and does not constitute financial advice or a recommendation to buy or sell any security. Past performance, whether real or simulated, is not indicative of future results. Always test on multiple symbols/timeframes, use conservative risk, and consult your financial advisor before trading live capital.

Tristan's Devil Mark (Short / Long, with W%R)The Devil’s Mark indicator is a visual tool designed to help traders identify potential short and long opportunities based on candle structure and market momentum. It combines price action analysis with the Williams %R (W%R) oscillator to highlight candles with high potential for reversal or continuation.
Can be used on any timeline, from scalping day trades to swing trades on daily and higher timelines. Know that the higher the timeline the less likely the indicator will show. (Asia and London sessions tend to show many indicators. I find this more useful for NY session.)
How the script works
Candle Structure Conditions
Short (Sell) Wedge: Plotted above green candles that have no bottom wick, indicating that inside that candle there was strong upward momentum without downside hesitation .
Long (Buy) Wedge: Plotted below red candles that have no top wick, indicating that inside that candle there was strong downward momentum without upside hesitation .
These candles are visually emphasized as wedges to mark potential turning points.
Williams %R Filter
The indicator uses Williams %R to measure overbought and oversold conditions:
Proximity to 0 (nearZeroThresh): Determines how close W%R must be to 0 (overbought) to trigger a Sell Wedge. This acts as a “Sell sensitivity” filter.
Proximity to -100 (nearHundredThresh): Determines how close W%R must be to -100 (oversold) to trigger a Buy Wedge. This acts as a “Buy sensitivity” filter.
When the candle meets both the candle structure and the W%R condition, the wedge is plotted in purple (“Within W%R Range”).
When the "ignore W%R filter" toggle is on, all eligible candles are plotted regardless of W%R. Wedges that normally would not meet W%R criteria are plotted in light purple (“Outside W%R Range”) to distinguish them. #YOLO (🚫 I recommend leaving "Ignore W%R Filter" OFF)
Settings Explained
Williams %R Length: The number of bars used to calculate the W%R oscillator. Shorter lengths make it more sensitive; longer lengths smooth the readings.
Proximity to 0 / 100: Controls how “strict” the indicator is in requiring overbought or oversold W%R conditions to trigger. Lower values mean closer to extreme zones, higher values are more permissive.
Ignore W%R Toggle: Option to show Devil’s Marks on every eligible candle regardless of W%R. Useful for visualizing purely price-action-based signals.
What the trader sees
Purple wedges: Candles meeting both candle structure and W%R conditions.
Light purple wedges: Candles meeting candle structure but ignored W%R (when toggle is on). #YOLO (🚫 I recommend leaving "Ignore W%R Filter" OFF)
Short opportunities are wedges above bars (green candles with no bottom wick).
Long opportunities are wedges below bars (red candles with no top wick).
Trading Insight
The Devil’s Mark is a momentum and reversal alert tool:
Look for purple downward-pointing wedges when W%R is near overbought. This is a potential shorting opportunity. Buying at the close of that candle may improve your short trades.
Look for purple upward-pointing wedges when W%R is near oversold. This is a potential
long opportunity. Buying at the close of that candle may improve your long trades.
Light purple wedges show the same price-action cues without W%R confirmation—useful for aggressive traders who want every potential setup. #YOLO #YMMV #noFullPort
Settings / Security
The “Output values” checkbox appears for each plotted series (like a plot or plotshape) and controls whether the series will also be exposed numerically in the Data Window or used by other indicators/scripts.
Here’s what it means in practice:
1. Checked (true)
The series values (like candle high, low, or any computed value) are exported to the Data Window and can be read by other scripts using request.security() or ta functions.
Example: You can see the exact numerical value of each plotted point in the Data Window when you hover over the chart.
Useful if you want to backtest or reference these plotted values programmatically.
2. Unchecked (false)
The series is plotted visually only.
The numeric values are hidden from the Data Window and cannot be accessed by other scripts.
Makes the chart cleaner if you don’t need the numeric outputs.

Bollinger Band Screener [Pineify]Multi-Symbol Bollinger Band Screener Pineify – Advanced Multi-Timeframe Market Analysis
Unlock the power of rapid, multi-asset scanning with this original TradingView Pine Script. Expose trends, volatility, and reversals across your favorite tickers—all in a single, customizable dashboard.
Key Features
Screens up to 8 symbols simultaneously with individual controls.
Covers 4 distinct timeframes per symbol for robust, multi-timeframe analysis.
Integrates advanced Bollinger Band logic, adaptable with 11+ moving average types (SMA, EMA, RMA, HMA, WMA, VWMA, TMA, VAR, WWMA, ZLEMA, and TSF).
Visualizes precise state changes: Open/Parallel Uptrends & Downtrends, Consolidation, Breakouts, and more.
Highly interactive table view for instant signal interpretation and actionable alerts.
Flexible to any market: crypto, stocks, forex, indices, and commodities.
How It Works
For each chosen symbol and timeframe, the script calculates Bollinger Bands using your specified source, length, standard deviation, and moving average method.
Real-time state recognition assigns one of several states (Open Rising, Open Falling, Parallel Rising, Parallel Falling), painting the table with unique color codes.
State detection is rigorously defined: e.g., “Open Rising” is set when both bands and the basis rise, indicating strong up momentum.
All bands, signals, and strategies dynamically update as new bars print or user inputs change.
Trading Ideas and Insights
Identify volatility expansions and compressions instantly, spotting breakouts and breakdowns before they play out.
Spot multi-timeframe confluences—when trends align across several TFs, conviction increases for potential trades.
Trade reversals or continuations based on unique Bollinger Band patterns, such as squeeze-break or persistent parallel moves.
Harness this tool for scalping, swing trading, or systematic portfolio screens—your logic, your edge!
How Multiple Indicators Work Together
This screener’s core strength is its integration of multiple moving average types into Bollinger Band construction, not just standard SMA. Each average adapts the bands’ responsiveness to trend and noise, so traders can select the underlying logic that matches their market environment (e.g., HMA for fast moves or ZLEMA for smoothed lag). Overlaying 4 timeframes per symbol ensures trends, reversals, and volatility shifts never slip past your radar. When all MAs and bands synchronize across symbols and TFs, it becomes easy to separate real opportunity from market noise.
Unique Aspects
Perhaps the most flexible Bollinger Band screener for TradingView—choose from over 10 moving average methods.
Powerful multi-timeframe and multi-asset design, rare among Pine scripts.
Immediate visual clarity with color-coded table cells indicating band state—no need for guesswork or chart clutter.
Custom configuration for each asset and time slice to suit any trading style.
How to Use
Add the script to your TradingView chart.
Use the user-friendly input settings to specify up to 8 symbols and 4 timeframes each.
Customize the Bollinger Band parameters: source (price type), band length, standard deviation, and type of moving average.
Interpret the dashboard: Color codes and “state” abbreviations show you instantly which symbols and timeframes are trending, consolidating, or breaking out.
Take trades according to your strategy, using the screener as a confirmation or primary scan tool.
Customization
Fully customize: symbols, timeframes, source, band length, standard deviation multiplier, and moving average type.
Supports intricate watchlists—anything TradingView allows, this script tracks.
Adapt for cryptos, equities, forex, or derivatives by changing symbol inputs.
Conclusion
The Multi-Symbol Bollinger Band Screener “Pineify” is a comprehensive, SEO-optimized Pine Script tool to supercharge your market scanning, trend spotting, and decision-making on TradingView. Whether you trade crypto, stocks, or forex—its fast, intuitive, multi-timeframe dashboard gives you the informational edge to stay ahead of the market.
Try it now to streamline your trading workflow and see all the bands, all the trends, all the time!

CommonUtils█ OVERVIEW
This library is a utility tool for Pine Script™ developers. It provides a collection of helper functions designed to simplify common tasks such as mapping user-friendly string inputs to Pine Script™ constants and formatting timeframe strings for display. The primary goal is to make main scripts cleaner, more readable, and reduce repetitive boilerplate code. It is envisioned as an evolving resource, with potential for new utilities to be added over time based on community needs and feedback.
█ CONCEPTS
The library primarily focuses on two main concepts:
Input Mapping
Pine Script™ often requires specific constants for function parameters (e.g., `line.style_dashed` for line styles, `position.top_center` for table positions). However, presenting these technical constants directly to users in script inputs can be confusing. Input mapping involves:
Allowing users to select options from more descriptive, human-readable strings (e.g., "Dashed", "Top Center") in the script's settings.
Providing functions within this library (e.g., `mapLineStyle`, `mapTablePosition`) that take these user-friendly strings as input.
Internally, these functions use switch statements or similar logic to convert (map) the input string to the corresponding Pine Script™ constant required by built-in functions.
This approach enhances user experience and simplifies the main script's logic by centralizing the mapping process.
Timeframe Formatting
Raw timeframe strings obtained from variables like `timeframe.period` (e.g., "1", "60", "D", "W") or user inputs are not always ideal for direct display in labels or panels. The `formatTimeframe` function addresses this by:
Taking a raw timeframe string as input.
Parsing this string to identify its numerical part and unit (e.g., minutes, hours, days, weeks, months, seconds, milliseconds).
Converting it into a more standardized and readable format (e.g., "1min", "60min", "Daily", "Weekly", "1s", "10M").
Offering an optional `customSuffix` parameter (e.g., " FVG", " Period") to append to the formatted string, making labels more descriptive, especially in multi-timeframe contexts.
The function is designed to correctly interpret various common timeframe notations used in TradingView.
█ NOTES
Ease of Use: The library functions are designed with simple and understandable signatures. They typically take a string input and return the corresponding Pine Script™ constant or a formatted string.
Default Behaviors: Mapping functions (`mapLineStyle`, `mapTablePosition`, `mapTextSize`) generally return a sensible default value (e.g., `line.style_solid` for `mapLineStyle`) in case of a non-matching input. This helps prevent errors in the main script.
Extensibility of Formatting: The `formatTimeframe` function, with its `customSuffix` parameter, allows for flexible customization of timeframe labels to suit the specific descriptive needs of different indicators or contexts.
Performance Considerations: These utility functions primarily use basic string operations and switch statements. For typical use cases, their impact on overall script performance is negligible. However, if a function like `formatTimeframe` were to be called excessively in a loop with dynamic inputs (which is generally not its intended use), performance should be monitored.
No Dependencies: This library is self-contained and does not depend on any other external Pine Script™ libraries.
█ EXPORTED FUNCTIONS
mapLineStyle(styleString)
Maps a user-provided line style string to its corresponding Pine Script™ line style constant.
Parameters:
styleString (simple string) : The input string representing the desired line style (e.g., "Solid", "Dashed", "Dotted" - typically from constants like LS1, LS2, LS3).
Returns: The Pine Script™ constant for the line style (e.g., line.style_solid). Defaults to line.style_solid if no match.
mapTablePosition(positionString)
Maps a user-provided table position string to its corresponding Pine Script™ position constant.
Parameters:
positionString (simple string) : The input string representing the desired table position (e.g., "Top Right", "Top Center" - typically from constants like PP1, PP2).
Returns: The Pine Script™ constant for the table position (e.g., position.top_right). Defaults to position.top_right if no match.
mapTextSize(sizeString)
Maps a user-provided text size string to its corresponding Pine Script™ size constant.
Parameters:
sizeString (simple string) : The input string representing the desired text size (e.g., "Tiny", "Small" - typically from constants like PTS1, PTS2).
Returns: The Pine Script™ constant for the text size (e.g., size.tiny). Defaults to size.small if no match.
formatTimeframe(tfInput, customSuffix)
Formats a raw timeframe string into a more display-friendly string, optionally appending a custom suffix.
Parameters:
tfInput (simple string) : The raw timeframe string from user input or timeframe.period (e.g., "1", "60", "D", "W", "1S", "10M", "2H").
customSuffix (simple string) : An optional suffix to append to the formatted timeframe string (e.g., " FVG", " Period"). Defaults to an empty string.
Returns: The formatted timeframe string (e.g., "1min", "60min", "Daily", "Weekly", "1s", "10min", "2h") with the custom suffix appended.

Moving Average Trend ToolsI. How M.A.T.T. Adds Value to the TradingView Community:
The "Moving Average Trend Tools" (M.A.T.T.) is a versatile Pine Script v6 indicator that empowers traders with clear trend analysis, reliable trade signals, and real-time insights. Its intuitive design and robust features make it a valuable addition to the TradingView Community Scripts by catering to traders of all levels. Here’s why it stands out:
Clear Trend Visualization: M.A.T.T. plots a moving average (MA) with dynamic coloring—green for rising, red for falling, and gray for flat—based on a user-defined lookback period. This simplifies trend interpretation, helping traders quickly assess market momentum.
Reliable Trade Signals : The script identifies price crossovers above or below the MA, plotting green circles for bullish crosses and red for bearish, confirmed on closed bars to prevent repainting. These signals guide entry and exit points for trend-following or reversal strategies.
Real-Time Extension Detection : M.A.T.T. calculates percentage price deviations from the MA, displaying real-time labels when thresholds (e.g., 6%) are exceeded. This highlights overextended moves, ideal for spotting reversals or pullbacks, with alerts to keep traders informed.
Extensive Customization : Traders can tailor the MA type (SMA, EMA, WMA, HMA), length, colors, line width, and label sizes. This flexibility supports diverse strategies across markets like stocks, forex, and crypto, from scalping to swing trading.
Automated Alerts : Alert conditions for crossovers and extensions integrate seamlessly with TradingView’s system, enabling traders to stay updated without constant chart monitoring.
M.A.T.T. combines trend analysis, signal generation, and overextension detection into a single, user-friendly tool. Its accessibility, reliability, and educational value for Pine Script learners make it a compelling contribution to the community.
II. What M.A.T.T. Does, How It Works, and Its Originality:
What It Does :
M.A.T.T. enhances trend analysis and trade decision-making through three core features:
Dynamic MA Visualization: Plots a customizable MA (SMA, EMA, WMA, or HMA) with trend-based coloring to reflect rising, falling, or flat market conditions.
Price Crossover Signals : Marks bullish (green circles) and bearish (red circles) crossovers, confirmed on closed bars, with alerts for trade opportunities.
Price Extension Labels : Displays real-time percentage deviations of price from the MA, with alerts when user-defined thresholds are breached, signaling potential reversals.
How It Works :
M.A.T.T. leverages Pine Script v6 for precise calculations and user-friendly outputs:
Inputs: Users select MA type, length, lookback period, colors, and thresholds for extensions, plus label styles and sizes for customization.
MA Calculation : A switch function computes the chosen MA (e.g., ta.ema(close, 21) for EMA). Trend direction is determined using ta.rising or ta.falling over the lookback period, coloring the MA accordingly.
Crossover Logic : Bullish crossovers (close > ma and close < ma ) and bearish crossovers (close < ma and close > ma ) are plotted as circles on confirmed bars (barstate.isconfirmed) to ensure reliability. Alerts trigger only on the first bar of a crossover.
Extension Logic : Percentage deviations are calculated as ((price - ma) / ma) * 100, using the high for above-MA extensions and low for below. Labels appear in real-time when thresholds are exceeded, with alerts on transitions to avoid noise.
Why It’s Original
M.A.T.T. distinguishes itself through a unique blend of features and thoughtful design:
All-in-One Design : It integrates dynamic MA coloring, non-repainting crossover signals, and real-time extension detection, addressing trend identification, trade signals, and overextension warnings in one tool—unlike most MA indicators that focus on a single aspect.
Real-Time Extension Labels : Displaying percentage deviations with customizable thresholds is a rare feature, ideal for volatile markets and not commonly found in standard scripts.
Non-Repainting Signals : Confirmed crossover signals enhance reliability for live trading, setting M.A.T.T. apart from less rigorous indicators.
Optimized Alert Condtions : Alerts trigger only on transitions (e.g., first bar of a crossover or extension), reducing noise and improving usability.
Visual and Functional Flexibility : Support for four MA types, extensive customization, and a clean interface (dynamic colors, tiny circles, clear labels) make it adaptable and user-friendly.
While MA plotting or crossovers exist elsewhere, M.A.T.T.’s seamless integration, real-time extension detection, alert conditions, and focus on reliability and customization create a distinctive, practical tool. Its balance of simplicity and sophistication makes it a unique asset for the TradingView community.

Dynamic Customizable 50% Line & Daily High/Low + True Day OpenA Unique Indicator for Precise Market-Level Analysis
This indicator is a fully integrated solution that automates complex market-level calculations and visualizations, offering traders a tool that goes beyond the functionality of existing open-source alternatives. By seamlessly combining several trading concepts into a single script, it delivers efficiency, accuracy, and customization that cater to both novice and professional traders.
Key Features: A Breakdown of What Makes It Unique
1. Adaptive Daily Highs and Lows
Automatically detects and plots daily high and low levels based on the selected time frame, dynamically updating in real time.
Features session-based adjustments, allowing traders to focus on levels that matter for specific trading sessions (e.g., London, New York).
Fully customizable styling, visibility, and alerts tailored to each trader’s preferences.
How It Works:
The indicator calculates daily high and low levels directly from price data, integrating session-specific time offsets to account for global trading hours. These levels provide traders with clear visual markers for key liquidity zones.
2. Automated ICT 50% Range Line
A pioneering implementation of ICT’s mid-range concept, this feature dynamically calculates and displays the midpoint of the daily range.
Offers traders a visual guide to identify premium and discount zones, aiding in determining market bias and potential trade setups.
How It Works:
The script calculates the range between the day’s high and low, dividing it by two to generate the midline. This line updates in real-time, ensuring that traders always see the most current premium and discount levels as price action evolves.
3. Dynamic Market Open Levels
Plots session opens (e.g., Asia, London, New York) and the True Day Open to provide actionable reference points for intra-day trading strategies.
Enhances precision in identifying liquidity shifts and aligning trades with institutional price movements.
How It Works:
The indicator uses predefined session times to calculate and display the opening levels for key trading sessions. It dynamically adjusts for time zones, ensuring accuracy regardless of the trader’s location.
4. Custom Watermark for Enhanced Visualization
Includes an optional watermark feature that allows users to display custom text on their charts.
Ideal for personalization, branding, or highlighting session notes without disrupting the clarity of the chart.
Why This Indicator Stands Out
First-to-Market Automation:
While the ICT 50% range line is a widely recognized concept, this is the first script to automate its calculation, combining it with other pivotal trading levels in a single tool.
All-in-One Functionality:
Unlike open-source alternatives that focus on individual features, this script integrates daily highs/lows, mid-range levels, session opens, and customizable watermarks into one cohesive system. The consolidation reduces the need for multiple indicators and ensures a clean, efficient chart setup.
Dynamic Customization:
Every feature can be adjusted to align with a trader’s strategy, time zone, or aesthetic preferences. This level of adaptability is unmatched in existing tools.
Proprietary Logic:
The indicator’s underlying calculations are built from scratch, leveraging advanced programming techniques to ensure accuracy and reliability. These proprietary methods differentiate it from similar open-source scripts.
How to Use This Indicator
Apply the Indicator:
Add it to your TradingView chart from the library.
Configure Settings:
Use the intuitive settings panel to adjust plotted levels, colors, styles, and visibility. Tailor the indicator to your trading strategy.
Incorporate into Analysis:
Combine the plotted levels with your preferred trading approach to identify liquidity zones, establish market bias, and pinpoint potential reversals or entries.
Stay Focused:
With all key levels automated and updated in real time, traders can focus on execution rather than manual plotting.
Originality and Justification for Closed Source
This script is closed-source due to its unique combination of features and proprietary logic that automates complex trading concepts like the ICT 50% range line and session-specific levels. Open-source alternatives lack this level of integration and customization, making this indicator a valuable and original contribution to the TradingView ecosystem.
What Sets It Apart from Open-Source Scripts?
Unlike open-source tools, this indicator doesn’t just replicate individual features—it enhances and integrates them into a seamless, all-in-one solution that offers traders a more efficient and effective way to analyze the market.

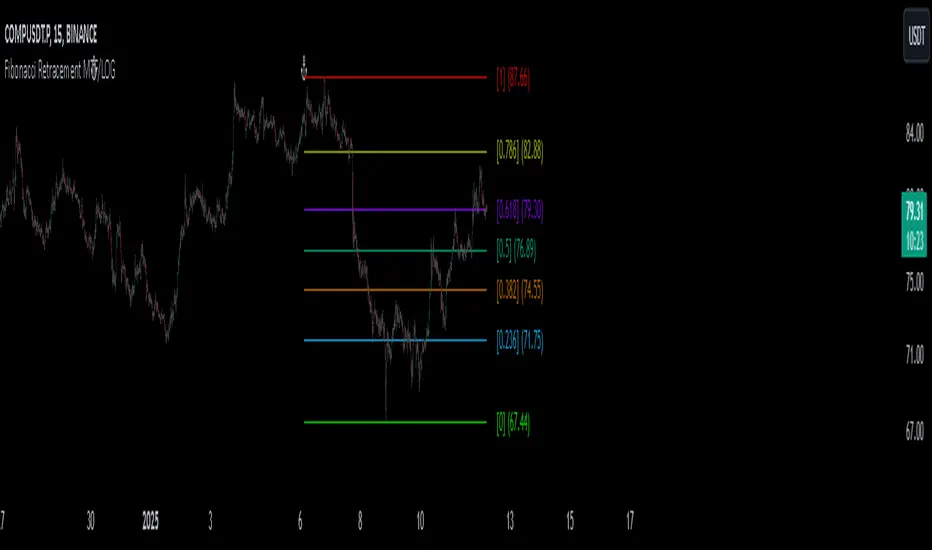
Fibonacci Retracement MTF/LOGIn Pine Script, there’s always a shorter way to achieve a result. As far as I can see, there isn’t an indicator among the community scripts that can produce Fibonacci Retracement levels (linear and logarithmic) as multiple time frame results based on a reference 🍺 This script, which I developed a long time ago, might serve as a starting point to fill this gap.
OVERVIEW
This indicator is a short and simple script designed to display Fibonacci Retracement levels on the chart according to user preferences, aiming to build the structure of support and resistance.
ORIGINALITY
This script:
Can calculate 'retracement' results from higher time frames.
Can recall previous time frame results using its reference parameter.
Performs calculations based on both linear and logarithmic scales.
Offers optional multipliers and appearance settings to simplify users’ tasks
CONCEPTS
Fibonacci Retracement is a technical analysis tool used to predict potential reversal points in an asset's price after a significant movement. This indicator identifies possible support and resistance levels by measuring price movements between specific points in a trend, using certain ratios derived from the Fibonacci sequence. It is based on impulsive price actions.
MECHANICS
This indicator first identifies the highest and lowest prices in the time frame specified by the user. Next, it determines the priority order of the bars where these prices occurred. Finally, it defines the trend direction. Once the trend direction is determined, the "Retracement" levels are constructed.
FUNCTIONS
The script contains two functions:
f_ret(): Generates levels based on the multiplier parameter.
f_print(): Handles the visualization by drawing the levels on the chart and positioning the labels in alignment with the levels. It utilizes parameters such as ordinate, confirmation, multiplier, and color for customization
NOTES
The starting bar for the time frame entered by the user must exist on the chart. Otherwise, the trend direction cannot be determined correctly, and the levels may be drawn inaccurately. This is also mentioned in the tooltip of the TimeFrame parameter.
I hope it helps everyone. Do not forget to manage your risk. And trade as safely as possible. Best of luck!
Helacator Ai ThetaHelacator Ai Theta is a state-of-the-art advanced script. It helps the trader find the possibility of a trend reversal in the market. By finding that point at which the three black crows pattern combines with the three white soldiers pattern, it is the most cherished pattern in technical analysis for its signal of strong bullish or bearish momentum. Therefore, it is a very strong predictive tool in the ability of shifting markets.
Key Highlights: Three White Soldiers and Three Black Crows Patterns
The script identifies these candlestick formations that consist of three consecutive candles, either bullish (Three White Soldiers) or bearish (Three Black Crows). These patterns help the trader identify possible trend reversal points as they provide an early signal of a change in the market direction. It is with great care that the script is written to evaluate the position and relationship between the candlesticks for maintaining the accuracy of pattern recognition. Moving Averages for Trend Filtering:
Two important ones used are moving averages for filtering any signals not in accordance with the general trend. The length of these MAs is variable, allowing the traders to be in a position to adapt the script for use under different market conditions. The moving averages ensure that signals are only taken in the direction that supports the general market flow, so it leads to more reliability within the signals. The MAs are not plotted on the chart for the sake of clarity, but they still perform a crucial function in signal filtering and can be displayed optionally for a more detailed investigation. Cooldown filter to reduce over-trading
This is part of what is implemented in the script to prevent generation of consecutive signals too quickly. All this helps to reduce market noise and not overtrade—only when market conditions are at their best. The cooldown period can be set to be adjusted according to the trader's preference, making the script more versatile in its use. Practical Considerations: Educational Purpose: This script is for educational purposes only and should be part of a comprehensive trading approach. Proper risk management techniques should be observed while at the same time taking into consideration prevailing market conditions before making any trading decision.
No Guaranteed Results: The script is aimed at bringing signal accuracy into improvement to align with the broader market trend and reducing noise, but past performance cannot guarantee future success. Traders should use this script within their broad trading approach. Clean and Simple Chart Display: The primary goal of this script is to have a clear and simple display on the chart. The signals are prominently marked with "BUY" and "SELL," and the color of the bars has changed according to the last signal, thus traders can easily read the output. Community and Open Source Open Source Contribution: This script is open for contribution by the TradingView community. Any suggestions regarding improvements are highly welcomed. Candlestick patterns, moving averages, and the combination of the cooldown filter are presented in such a way as to give traders something special, and any modifications or extra touch by the community is appreciated. Attribution and Transparency: The script is based on standard technical analysis principles and for all parts inspired by or derivated from other available open-source scripts, credit is given where it is due. In this way, transparency ensures that the script adheres to TradingView's standards and promotes a collaborative community environment.

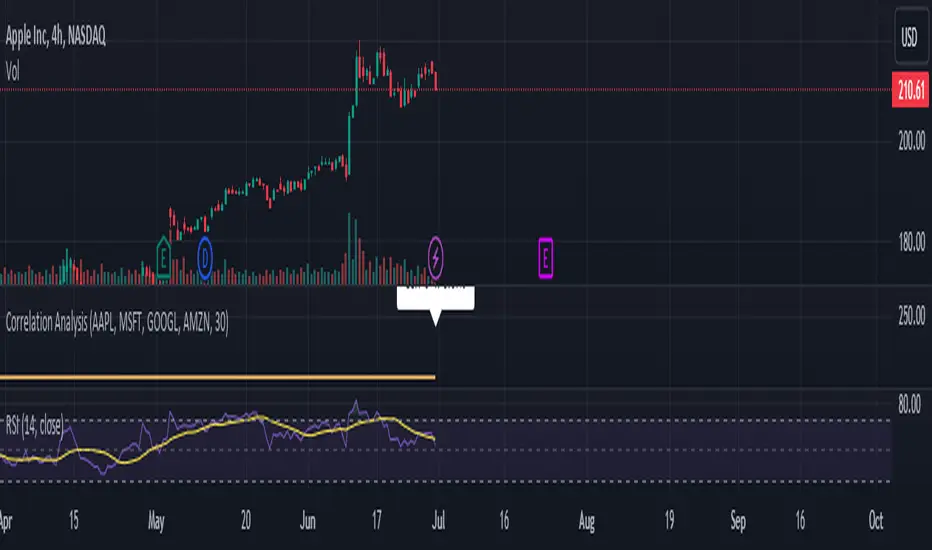
Correlation Analysis Tool📈 What Does It Do?
Correlation Calculation: Measures the correlation between a selected asset (Asset 1) and up to four additional assets (Asset 2, Asset 3, Asset 4, Asset 5).
User Inputs: Allows you to define the primary asset and up to four comparison assets, as well as the period for correlation calculations.
Correlation Matrix: Displays a matrix of correlation coefficients as a text label on the chart.
🔍 How It Works
Inputs: Enter the symbols for Asset 1 (main asset) and up to four other assets for comparison.
Correlation Period: Specify the period over which the correlations are calculated.
Calculations: Computes log returns for each asset and calculates the correlation coefficients.
Display: Shows a textual correlation matrix at the top of the chart with percentage values.
⚙️ Features
Customizable Assets: Input symbols for one primary asset and up to four other assets.
Flexible Period: Choose the period for correlation calculation.
Correlation Coefficients: Outputs correlation values for all asset pairs.
Textual Correlation Matrix: Provides a correlation matrix with percentage values for quick reference.
🧩 How to Use
Add the Script: Apply the script to any asset’s chart.
Set Asset Symbols: Enter the symbols for Asset 1 and up to four other assets.
Adjust Correlation Period: Define the period for which correlations are calculated.
Review Results: Check the correlation matrix displayed on the chart for insights.
🚨 Limitations
Historical Data Dependency: Correlations are based on historical data and might not reflect future market conditions.
No Visual Plots Yet: This script does not include visual plots; it only provides a textual correlation matrix.
💡 Best Ways To Use
Sector Comparison: Compare assets within the same sector or industry for trend analysis.
Diversification Analysis: Use the correlations to understand how different assets might diversify or overlap in your portfolio.
Strategic Decision Making: Utilize correlation data for making informed investment decisions and portfolio adjustments.
📜 Disclaimer
This script is for educational and informational purposes only. Please conduct your own research and consult with a financial advisor before making investment decisions. The author is not responsible for any losses or damages resulting from the use of this script.
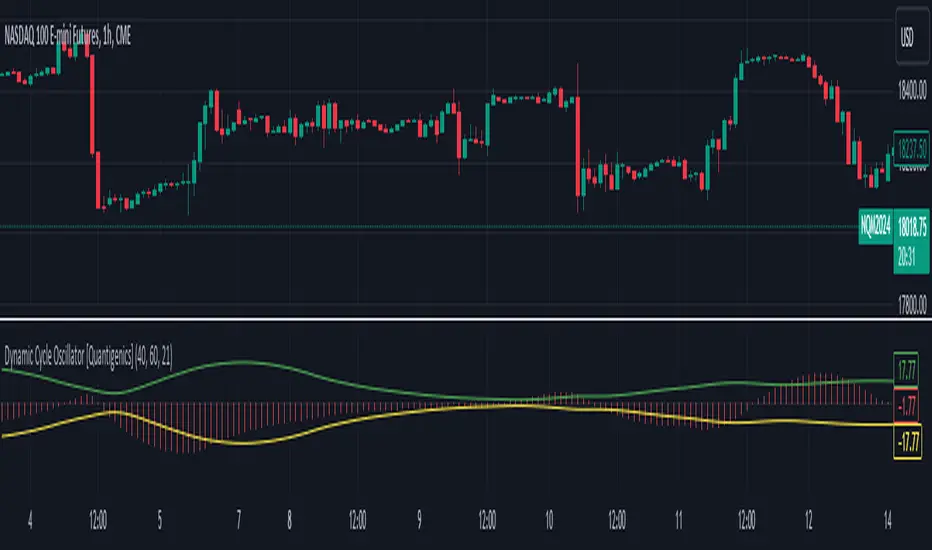
Dynamic Cycle Oscillator [Quantigenics]This script is designed to navigate through the ebbs and flows of financial markets. At its core, this script is a sophisticated yet user-friendly tool that helps you identify potential market turning points and trend continuations.
How It Works:
The script operates by plotting two distinct lines and a central histogram that collectively form a band structure: a center line and two outer boundaries, indicating overbought and oversold conditions. The lines are calculated based on a blend of exponential moving averages, which are then refined by a root mean square (RMS) over a specified number of bars to establish the cyclic envelope.
The input parameters:
Fast and Slow Periods:
These determine the sensitivity of the script. Shorter periods react quicker to price changes, while longer periods offer a smoother view.
RMS Length:
This parameter controls the range of the cyclic envelope, influencing the trigger levels for trading signals.
Using the Script:
On your chart, you’ll notice how the Dynamic Cycle Oscillator’s lines and histogram weave through the price action. Here’s how to interpret the movements.
Breakouts and Continuations:
Buy Signal: Consider a long position when the histogram crosses above the upper boundary. This suggests a possible strong bullish run.
Sell Signal: Consider a short position when the histogram crosses below the lower boundary. This suggests a possible strong bearish run.
Reversals:
Buy Signal: Consider a long position when the histogram crosses above the lower boundary. This suggests an oversold market turning bullish.
Sell Signal: Consider a short position when the histogram crosses below the upper boundary. This implies an overbought market turning bearish.
The script’s real-time analysis can serve as a robust addition to your trading strategy, offering clarity in choppy markets and an edge in trend-following systems.
Thanks! Hope you enjoy!
Triple MA HTF Indicator - Dynamic SmoothingThe indicator version of the "Triple MA HTF Strategy - Dynamic Smoothing" strategy script. In summary the indicator consist of 3 higher time frame moving averages. In which the highest timeframe is used for confirmation on the trend (filter). Moving average 1 and 2 are used to enter and exit the trade (crossover / crossunder). The main principle is to detect momentum when the faster MA 1 crosses the slower MA 2 and only trade with the trend (MA3). The dynamic smoothing in the code makes the indicator suitable to trade on lower tramecharts. The indicator script comes with the following features:
options for different types of MA.
options to choose from different timeframes & select # bars of that timeframe to calculate the MA value.
visualizations of the MA using Dynamic Smoothing calculations on lower timecharts. Note that the chart opened should be lower than the selected timeframes in the configurations.
Alerts for entry long, shorts and exits.
For more details on the script and possibility for backtesting the Triple MA HTF indicator I refer to my earlier published strategy script:

Buy Sell Volume SeparateDescription:
The script is designed to provide traders with a unique and comprehensive analysis of trading volume dynamics. Unlike existing scripts, the script offers a distinct advantage by presenting both buy and sell volumes on separate scales, simplifying trading decisions.
Key Features:
1. Dual Volume Scales: The script provides two separate volume scales, one for buy volumes and another for sell volumes. This separation allows to easily distinguish between buying and selling pressure, aiding in more precise trade entries and exits.
2. Clear and Intuitive Chart: The script ensures that the chart it generates is clean and easy to understand. The buy and sell volumes are color-coded for clarity, and you can quickly identify significant volume spikes and trends.
How to Use:
1. Adding the Script: To use the script, simply add it to your TradingView chart.
2. Interpreting Buy and Sell Volumes: On the chart, you will see two separate volume scales—one for buy volumes and one for sell volumes. Green bars represent buying pressure, while red bars indicate selling pressure. Pay attention to the relative strengths and patterns of these bars to gauge market sentiment.
3. Informed Trading Decisions: Armed with insights into both buy and sell volumes, you can make more informed trading decisions. Look for divergences, patterns, or significant volume spikes to identify potential entry and exit points.

Risk Management and Positionsize - MACD exampleMastering Risk Management
Risk management is the cornerstone of successful trading, and it's often the difference between turning a profit and suffering a loss. In light of its importance, I share a risk management tool which you can use for your trading strategies. The script not only assists in position sizing but also comes with built-in technical features that help in market timing. Let's delve into the nitty-gritty details.
Input Parameter: MarginFactor
One of the key features of the script is the MarginFactor input parameter. This element lets you control the portion of your equity used for placing each trade. A MarginFactor of -0.5 means 50% of your total equity will be deployed in placing the position size. Although Tradingview has a built-in option to adjust position sizing in a same way, I personally prefer to have the logic in my pinecode script. The main reason is userexperience in managing and testing different settings for different charts, timeframes and instruments (with the same strategy).
Stoploss and MarginFactor
If your strategy has a 4% stop-loss, you can choose to use only 50% of your equity by setting the MarginFactor to -0.5. In this case, you are effectively risking only 2% of your total capital per trade, which aligns well with the widely-accepted rule of thumb suggesting a 1-2% risk per trade. Similar if your stoploss is only 1% you can choose to change the MarginFactor to 1, resulting in a positionsize of 200% of your equity. The total risk would be again 2% per trade if your stoploss is set to 1%.
Max Drawdown and MarginFactor
Your MarginFactor setting can also be aligned with the maximum drawdown of your strategy, seen during a backtested period of 2-3 years. For example, if the max drawdown is 15%, you could calibrate your MarginFactor accordingly to limit your risk exposure.
Option to Toggle Number of Contracts
The script offers the option to toggle between using a percentage of equity for position sizing or specifying a fixed number of contracts. Utilizing a percentage of equity might yield unrealistic backtest results, especially over longer periods. This occurs because as the capital grows, the absolute position size also increases, potentially inflating the accumulated returns generated by the backtester. On the other hand, setting a fixed number of contracts as your position size offers a more stable and realistic ROI over the backtested period, as it removes the compounding effect on position sizes.
Key Features Strategy
MACD High Time Frame Entry and Exit Logic
The strategy employs a high time frame MACD (Moving Average Convergence Divergence) to make entry and exit decisions. You can easily adjust the timeframe settings and MACD settings in the inputsection to trade on lower timeframes. For more information on the HTF MACD with dynamic smoothing see:
Moving Average High Time Frame Filter
To reduce market 'noise', the strategy incorporates a high time frame moving average filter. This ensures that the trades are aligned with the dominant market trend (trading the trend). In the inputsection traders can easily switch between different type of moving averages. For more information about this HTF filter see:
Dynamic Smoothing
The script includes a feature for dynamic smoothing. The script contains The timeframeToMinutes(tf) function to convert any given time frame into its equivalent in minutes. For example, a daily (D) time frame is converted into 1440 minutes, a weekly (W) into 10,080 minutes, and so forth. Next the smoothing factor is calculated by dividing the minutes of the higher time frame by those of the current time frame. Finally, the script applies a Simple Moving Average (SMA) over the MACD, SIGNAL, and HIST values, MA filter using the dynamically calculated smoothing factor.
User Convenience: One of the major benefits is that traders don't need to manually adjust the smoothing factor when switching between different time frames. The script does this dynamically.
Visual Consistency: Dynamic smoothing helps traders to more accurately visualize and interpret HTF indicators when trading on lower time frames.
Time Frame Restriction: It's crucial to note that the operational time frame should always be lower than the time frame selected in the input sections for dynamic smoothing to function as intended.
By incorporating this dynamic smoothing logic, the script offers traders a nuanced yet straightforward way to adapt High Time Frame indicators for lower time frame trading, enhancing both adaptability and user experience.
Limitations: Exit Strategy
It's crucial to note that the script comes with a simplified exit strategy, devoid of features like a stop-loss, trailing stop-loss or multiple take profits. This means that while the script focuses on entries and risk management, it might result in higher losses if market conditions unexpectedly turn unfavorable.
Conclusion
Effective risk management is pivotal for trading success, and this TradingView script is designed to give you a better idea how to implement positions sizing with your preferred strategy. However, it's essential to note that this tool should not be considered financial advice. Always perform your due diligence and consult with financial advisors before making any trading decisions.
Feel free to use this risk management tool as building block in your trading scripts, Happy Trading!

Machine Learning : Cosine Similarity & Euclidean DistanceIntroduction:
This script implements a comprehensive trading strategy that adheres to the established rules and guidelines of housing trading. It leverages advanced machine learning techniques and incorporates customised moving averages, including the Conceptive Price Moving Average (CPMA), to provide accurate signals for informed trading decisions in the housing market. Additionally, signal processing techniques such as Lorentzian, Euclidean distance, Cosine similarity, Know sure thing, Rational Quadratic, and sigmoid transformation are utilised to enhance the signal quality and improve trading accuracy.
Features:
Market Analysis: The script utilizes advanced machine learning methods such as Lorentzian, Euclidean distance, and Cosine similarity to analyse market conditions. These techniques measure the similarity and distance between data points, enabling more precise signal identification and enhancing trading decisions.
Cosine similarity:
Cosine similarity is a measure used to determine the similarity between two vectors, typically in a high-dimensional space. It calculates the cosine of the angle between the vectors, indicating the degree of similarity or dissimilarity.
In the context of trading or signal processing, cosine similarity can be employed to compare the similarity between different data points or signals. The vectors in this case represent the numerical representations of the data points or signals.
Cosine similarity ranges from -1 to 1, with 1 indicating perfect similarity, 0 indicating no similarity, and -1 indicating perfect dissimilarity. A higher cosine similarity value suggests a closer match between the vectors, implying that the signals or data points share similar characteristics.
Lorentzian Classification:
Lorentzian classification is a machine learning algorithm used for classification tasks. It is based on the Lorentzian distance metric, which measures the similarity or dissimilarity between two data points. The Lorentzian distance takes into account the shape of the data distribution and can handle outliers better than other distance metrics.
Euclidean Distance:
Euclidean distance is a distance metric widely used in mathematics and machine learning. It calculates the straight-line distance between two points in Euclidean space. In two-dimensional space, the Euclidean distance between two points (x1, y1) and (x2, y2) is calculated using the formula sqrt((x2 - x1)^2 + (y2 - y1)^2).
Dynamic Time Windows: The script incorporates a dynamic time window function that allows users to define specific time ranges for trading. It checks if the current time falls within the specified window to execute the relevant trading signals.
Custom Moving Averages: The script includes the CPMA, a powerful moving average calculation. Unlike traditional moving averages, the CPMA provides improved support and resistance levels by considering multiple price types and employing a combination of Exponential Moving Averages (EMAs) and Simple Moving Averages (SMAs). Its adaptive nature ensures responsiveness to changes in price trends.
Signal Processing Techniques: The script applies signal processing techniques such as Know sure thing, Rational Quadratic, and sigmoid transformation to enhance the quality of the generated signals. These techniques improve the accuracy and reliability of the trading signals, aiding in making well-informed trading decisions.
Trade Statistics and Metrics: The script provides comprehensive trade statistics and metrics, including total wins, losses, win rate, win-loss ratio, and early signal flips. These metrics offer valuable insights into the performance and effectiveness of the trading strategy.
Usage:
Configuring Time Windows: Users can customize the time windows by specifying the start and finish time ranges according to their trading preferences and local market conditions.
Signal Interpretation: The script generates long and short signals based on the analysis, custom moving averages, and signal processing techniques. Users should pay attention to these signals and take appropriate action, such as entering or exiting trades, depending on their trading strategies.
Trade Statistics: The script continuously tracks and updates trade statistics, providing users with a clear overview of their trading performance. These statistics help users assess the effectiveness of the strategy and make informed decisions.
Conclusion:
With its adherence to housing trading rules, advanced machine learning methods, customized moving averages like the CPMA, and signal processing techniques such as Lorentzian, Euclidean distance, Cosine similarity, Know sure thing, Rational Quadratic, and sigmoid transformation, this script offers users a powerful tool for housing market analysis and trading. By leveraging the provided signals, time windows, and trade statistics, users can enhance their trading strategies and improve their overall trading performance.
Disclaimer:
Please note that while this script incorporates established tradingview housing rules, advanced machine learning techniques, customized moving averages, and signal processing techniques, it should be used for informational purposes only. Users are advised to conduct their own analysis and exercise caution when making trading decisions. The script's performance may vary based on market conditions, user settings, and the accuracy of the machine learning methods and signal processing techniques. The trading platform and developers are not responsible for any financial losses incurred while using this script.
By publishing this script on the platform, traders can benefit from its professional presentation, clear instructions, and the utilisation of advanced machine learning techniques, customised moving averages, and signal processing techniques for enhanced trading signals and accuracy.
I extend my gratitude to TradingView, LUX ALGO, and JDEHORTY for their invaluable contributions to the trading community. Their innovative scripts, meticulous coding patterns, and insightful ideas have profoundly enriched traders' strategies, including my own.

Trend Line Adam Moradi v1 (Tutorial Content)
The Pine Script strategy that plots pivot points and trend lines on a chart. The strategy allows the user to specify the period for calculating pivot points and the number of pivot points to be used for generating trend lines. The user can also specify different colors for the up and down trend lines.
The script starts by defining the input parameters for the strategy and then calculates the pivot high and pivot low values using the pivothigh() and pivotlow() functions. It then stores the pivot points in two arrays called trend_top_values and trend_bottom_values. The script also has two arrays called trend_top_position and trend_bottom_position which store the positions of the pivot points.
The script then defines a function called add_to_array() which takes in three arguments: apointer1, apointer2, and val. This function adds val to the beginning of the array pointed to by apointer1, and adds bar_index to the beginning of the array pointed to by apointer2. It then removes the last element from both arrays.
The script then checks if a pivot high or pivot low value has been calculated, and if so, it adds the value and its position to the appropriate arrays using the add_to_array() function.
Next, the script defines two arrays called bottom_lines and top_lines which will be used to store trend lines. It also defines a variable called starttime which is set to the current time.
The script then enters a loop to calculate and plot the trend lines. It first deletes any existing trend lines from the chart. It then enters two nested loops which iterate over the pivot points stored in the trend_bottom_values and trend_top_values arrays. For each pair of pivot points, the script calculates the slope of the line connecting them and checks if the line is a valid trend line by iterating over the price bars between the two pivot points and checking if the line is above or below the close price of each bar. If the line is found to be a valid trend line, it is plotted on the chart using the line.new() function.
Finally, the script colors the trend lines using the colors specified by the user.
Tutorial Content
'PivotPointNumber' is an input parameter for the script that specifies the number of pivot points to consider when calculating the trend lines. The value of 'PivotPointNumber' is set by the user when they configure the script. It is used to determine the size of the arrays that store the values and positions of the pivot points, as well as the number of pivot points to loop through when calculating the trend lines.
'up_trend_color' is an input parameter for the script that specifies the color to use for drawing the trend lines that are determined to be upward trends. The value of 'up_trend_color' is set by the user when they configure the script and is passed to the color parameter of the line.new() function when drawing the upward trend lines. It determines the visual appearance of the upward trend lines on the chart.
'down_trend_color' is an input parameter for the script that specifies the color to use for drawing the trend lines that are determined to be downward trends. The value of 'down_trend_color' is set by the user when they configure the script and is passed to the color parameter of the line.new() function when drawing the downward trend lines. It determines the visual appearance of the downward trend lines on the chart.
'pivothigh' is a variable in the script that stores the value of the pivot high point. It is calculated using the pivothigh() function, which returns the highest high over a specified number of bars. The value of 'pivothigh' is used in the calculation of the trend lines.
'pivotlow' is a variable in the script that stores the value of the pivot low point. It is calculated using the pivotlow() function, which returns the lowest low over a specified number of bars. The value of 'pivotlow' is used in the calculation of the trend lines.
'trend_top_values' is an array in the script that stores the values of the pivot points that are determined to be at the top of the trend. These are the pivot points that are used to calculate the upward trend lines.
'trend_top_position' is an array in the script that stores the positions (i.e., bar indices) of the pivot points that are stored in the 'trend_top_values' array. These positions correspond to the locations of the pivot points on the chart.
'trend_bottom_values' is an array in the script that stores the values of the pivot points that are determined to be at the bottom of the trend. These are the pivot points that are used to calculate the downward trend lines.
'trend_bottom_position' is an array in the script that stores the positions (i.e., bar indices) of the pivot points that are stored in the 'trend_bottom_values' array. These positions correspond to the locations of the pivot points on the chart.
apointer1 and apointer2 are variables used in the add_to_array() function, which is defined in the script. They are both pointers to arrays, meaning that they hold the memory addresses of the arrays rather than the arrays themselves. They are used to manipulate the arrays by adding new elements to the beginning of the arrays and removing elements from the end of the arrays.
apointer1 is a pointer to an array of floating-point values, while apointer2 is a pointer to an array of integers. The specific arrays that they point to depend on the arguments passed to the add_to_array() function when it is called. For example, if add_to_array(trend_top_values, trend_top_posisiton, pivothigh) is called, then apointer1 would point to the tval array and apointer2 would point to the tpos array.
'bottom_lines' (short for "Bottom Lines") is an array in the script that stores the line objects for the downward trend lines that are drawn on the chart. Each element of the array corresponds to a different trend line.
'top_lines' (short for "Top Lines") is an array in the script that stores the line objects for the upward trend lines that are drawn on the chart. Each element of the array corresponds to a different trend line.
Both 'bottom_lines' and 'top_lines' are arrays of type "line", which is a data type in PineScript that represents a line drawn on a chart. The line objects are created using the line.new() function and are used to draw the trend lines on the chart. The variables are used to store the line objects so that they can be manipulated and deleted later in the script.
Loops
maxline is a variable in the script that specifies the maximum number of trend lines that can be drawn on the chart. It is used to determine the size of the bottom_lines and top_lines arrays, which store the line objects for the trend lines.
The value of maxline is set to 3 at the beginning of the script, meaning that at most 3 trend lines can be drawn on the chart at a time. This value can be changed by the user if desired by modifying the assignment statement "maxline = 3".
'count_line_low' (short for "Count Line Low") is a variable in the script that keeps track of the number of downward trend lines that have been drawn on the chart. It is used to ensure that the maximum number of trend lines (as specified by the maxline variable) is not exceeded.
'count_line_high' (short for "Count Line High") is a variable in the script that keeps track of the number of upward trend lines that have been drawn on the chart. It is used to ensure that the maximum number of trend lines (as specified by the maxline variable) is not exceeded.
Both 'count_line_low' and 'count_line_high' are initialized to 0 at the beginning of the script and are incremented each time a new trend line is drawn. If either variable exceeds the value of maxline, then no more trend lines are drawn.
'pivot1', 'up_val1', 'up_val2', up1, and up2 are variables used in the loop that calculates the downward trend lines in the script. They are used to store intermediate values during the calculation process.
'pivot1' is a loop variable that is used to iterate through the pivot points (stored in the trend_bottom_values and trend_bottom_position arrays) that are being considered for use in the trend line calculation.
'up_val1' and 'up_val2' are variables that store the values of the pivot points that are used to calculate the downward trend line.
up1 and up2 are variables that store the positions (i.e., bar indices) of the pivot points that are stored in 'up_val1' and 'up_val2', respectively. These positions correspond to the locations of the pivot points on the chart.
'value1' and 'value2' are variables that are used to store the values of the pivot points that are being compared in the loop that calculates the trend lines in the script. They are used to determine whether a trend line can be drawn between the two pivot points.
For example, if 'value1' is the value of a pivot point at the top of the trend and 'value2' is the value of a pivot point at the bottom of the trend, then a trend line can be drawn between the two points if 'value1' is greater than 'value2'. The values of 'value1' and 'value2' are used in the calculation of the slope and intercept of the trend line.
'position1' and 'position2' are variables that are used to store the positions (i.e., bar indices) of the pivot points that are being compared in the loop that calculates the trend lines in the script. They are used to determine the distance between the pivot points, which is necessary for calculating the slope of the trend line.
For example, if 'position1' is the position of a pivot point at the top of the trend and 'position2' is the position of a pivot point at the bottom of the trend, then the distance between the two points is given by 'position1' - 'position2'. This distance is used in the calculation of the slope of the trend line.
'different', 'high_line', 'low_location', 'low_value', and 'valid' are variables that are used in the loop that calculates the downward trend lines in the script. They are used to store intermediate values during the calculation process.
'different' is a variable that stores the slope of the downward trend line being calculated. It is calculated as the difference in value between the two pivot points (stored in up_val1 and up_val2) divided by the distance between the pivot points (calculated using their positions, stored in up1 and up2).
'high_line' is a variable that stores the current value of the trend line being calculated at a given point in the loop. It is initialized to the value of the second pivot point (stored in up_val2) and is updated on each iteration of the loop using the value of different.
'low_location' is a variable that stores the position (i.e., bar_index) on the chart of the point where the trend line being calculated first touches the low price. It is initialized to the position of the second pivot point (stored in up2) and is updated on each iteration of the loop if the trend line touches a lower low.
'low_value' is a variable that stores the value of the trend line at the point where it first touches the low price. It is initialized to the value of the second pivot point (stored in up_val2) and is updated on each iteration of the loop if the trend line touches a lower low.
'valid' is a Boolean variable that is used to indicate whether the trend line being calculated is valid. It is initialized to true and is set to false if the trend line does not pass through all the lows between the pivot points. If valid is still true after the loop has completed, then the trend line is considered valid and is drawn on the chart.
d_value1, d_value2, d_position1, and d_position2 are variables that are used in the loop that calculates the upward trend lines in the script. They are used to store intermediate values during the calculation process.
d_value1 and d_value2 are variables that store the values of the pivot points that are used to calculate the upward trend line.
d_position1 and d_position2 are variables that store the positions (i.e., bar indices) of the pivot points that are stored in d_value1 and d_value2, respectively. These positions correspond to the locations of the pivot points on the chart.
The variables d_value1, d_value2, d_position1, and d_position2 have the same function as the variables uv1, uv2, up1, and up2, respectively, but for the calculation of the upward trend lines rather than the downward trend lines. They are used in a similar way to store intermediate values during the calculation process.
thank you.
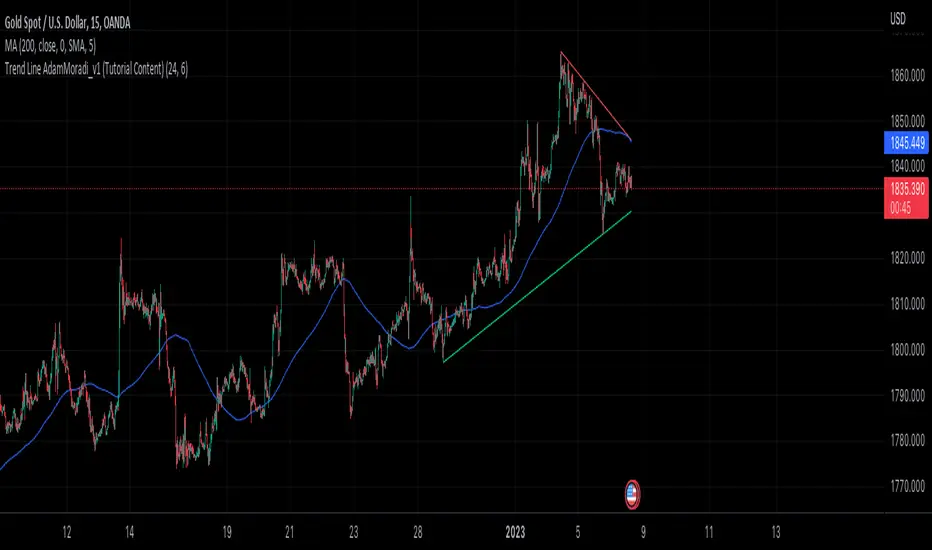
Stoch/RSI with EMA50 Cross & HHLLA hybrid but simple indicator that plots 4 strategies in one pane .
1) RSI Indicator
2) Stoch RSI
3) EMA50 Cross (To determine direction in current timeframe)
4) Higher Highs & Lower Lows to analyze the trend and break of trend
The relative strength index (RSI) is a momentum indicator used in technical analysis. It is displayed as an oscillator (a line graph) on a scale of zero to 100. When the RSI indicator crosses 30 on the RSI chart, it is a bullish sign and when it crosses 70, it is a bearish sign.
The Stochastic RSI (StochRSI) is also a momentum indicator used in technical analysis. It is displayed as an oscillator (a line graph) on a scale of zero to 100. When the StochRSI indicator crosses 20 on the RSI chart, it is a bullish sign and when it crosses 80, it is a bearish sign.
The EMA50Cross denotes two cases in the script:
a) A crossover of CMP on the EMA50 is highlighted by a green bar signals a possible bullish trend
b) A crossunder of CMP on the EMA50 is highlighted by a red bar signals a possible bearish trend
The HHLL is denoted by mneumonics HH, HL,LH, LL. A combination of HHs and HLs denotes a uptrend while the combination of LLs and LHs denoted a downtrend
The current script should be used in confluence of other trading strategies and not in isolation.
Scenario 1:
If a EMA50Cross over bar (GREEN) is highlighted with the StochRSI below 20 and the given script is plotting HHs and HLs, we are most likely in a bullish trend for the given timeframe and a long can be initiated in confluence with other trading strategies used by the user. The RSI signal may now be utilized to determine a good range of entry/exit.
Scenario 2:
If a EMA50Cross under bar (RED) is highlighted with the StochRSI above 80 and the given script is plotting LLs and LHs, we are most likely in a bearish trend for the given timeframe and a short can be initiated in confluence with other trading strategies used by the user. The RSI signal may now be utilized to determine a good range of entry/exit.
Disclaimer:
The current script should be used in confluence with other trading strategies and not in isolation. The scripts works best on 4H and 1D Timeframes and should be used with caution on lower timeframes.
This indicator is not intended to give exact entry or exit points for a trade but to provide a general idea of the trend & determine a good range for entering or exiting the trade. Please DYOR
Credit & References:
This script uses the default technical analysis reference library provided by PineScript (denoted as ta)
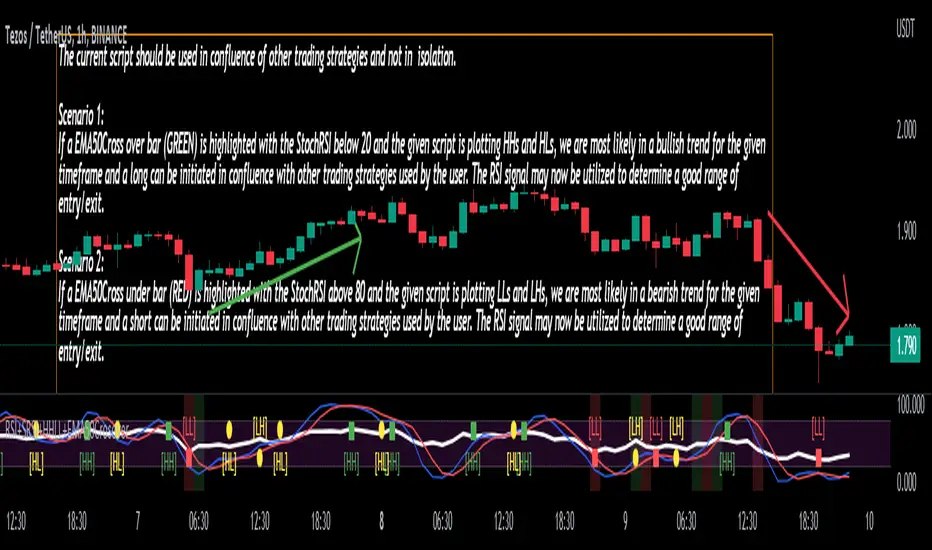
MTFindicatorsQuite recently TradingView added the possibility to create and use Libraries in PineScript. With this feature PineScript became higher quality of coding language overnight. Libraries enable splitting your code into multiple files, providing easier access to code reusability.
I was working on a script which included 3000 lines of code, which was recompiling 1:30 min, and recalculating over 1 minute as well. So I split it into 2 parts: main part + library containing "main logic", which I reuse in variety of scripts, but don't change too often. Result? Now recompilation of my main script takes 10 and recalculation 8 seconds!!!. I instantly fell in love with libraries.
Having said that, and being dedicated hater of security() calls, I have decided to publish a library of MTF indicators created with my own approach: "dig into formula". I have explained reasons for such approach in desription to this script:
So this library script will be a set of indicators reaching to higher timeframes. Just include one line at the beginning of the script you are creating:
import Peter_O/MTFindicators/1 as LIB
and then somewhere is the code add this line:
rsimtf=LIB.rsi_mtf(close,5,14)
All of a sudden you have access to rsimtf from 5x higher timeframe without any hassle :)
I start with RSI MTF, next ones will be ADX, Stochastic and some more. I will update this library with them here as well. Feel free to request particular indicators in comments. Maybe PSAR? Maybe Bollinger Bands?
Exponential MA Channel, Daily Timeframe (Crypto)Moving averages are some of the most common tools for traders. Some of the most widely used ones are simple moving averages (e.g. 20SMA, 50 SMA, 100 SMA, 200SMA,...). There are endless combinations of moving averages that can be used. I prefer to use exponential moving averages because they react more quickly to price data (essentially they filter back through the data over a discrete number of timesteps, with more recent history receiving the highest weighting in the final calculation).
This script uses a combination of the 21EMA, 53 EMA, and 100EMA. The idea of this script is to provide insight into when an asset might be close to a local top/bottom by monitoring price within the middle channel (yellow, blue, and orange lines), as well as identifying longer timeframe opportunities to buy/sell by examining the upper (green) and lower (red) bands. Disclaimer: this is not a guarantee that if price enters a region, that it will be a top or bottom, it is simply an indicator to get an idea based on price history.
As far as I know, this particular combination of exponential moving averages has not yet been published. I do not have an infinite amount of time to check through the entire library of published scripts. If someone else has already done this, I was unaware. Numerical computations were performed on ETHBTC price data in order to find the coefficients used in this script. Essentially, each EMA has a multiplier of either 1, a fraction of 1, or a number larger than 1 (these are the numbers in the script being multiplied by 'out1', 'out2', 'out3'; feel free to change these and see how this changes the indicator). I have found it to be useful for myself, and hope other people can tinker with this idea. My only wish is to allow other people to use this starting point to explore for themselves. I hope that I am allowed to publish this script without it being taken down so that others can freely use it.
Recommendations: although this was fit specifically for ETHBTC, it appears useful for many crypto pairs, specifically alt-BTC pairs and crypto-USD pairs. For example, I have found it useful for BTCUSD, ETHUSD, LINKUSD, LINKBTC, ETHBTC, ADABTC, etc. Only use on the DAILY timeframe.

How to use Leverage and Margin in PineScriptEn route to being absolutely the best and most complete trading platform out there, TradingView has just closed 2 gaps in their PineScript language.
It is now possible to create and backtest a strategy for trading with leverage.
Backtester now produces Margin Calls - so recognizes mid-trade drawdown and if it is too big for the broker to maintain your trade, some part of if will be instantly closed.
New additions were announced in official blogpost , but it lacked code examples, so I have decided to publish this script. Having said that - this is purely educational stuff.
█ LEVERAGE
Let's start with the Leverage. I will discuss this assuming we are always entering trades with some percentage of our equity balance (default_qty_type = strategy.percent_of_equity), not fixed order quantity.
If you want to trade with 1:1 leverage (so no leverage) and enter a trade with all money in your trading account, then first line of your strategy script must include this parameter:
default_qty_value = 100 // which stands for 100%
Now, if you want to trade with 30:1 leverage, you need to multipy the quantity by 30x, so you'd get 30 x 100 = 3000:
default_qty_value = 3000 // which stands for 3000%
And you can play around with this value as you wish, so if you want to enter each trade with 10% equity on 15:1 leverage you'd get default_qty_value = 150.
That's easy. Of course you can modify this quantity value not only in the script, but also afterwards in Script Settings popup, "Properties" tab.
█ MARGIN
Second newly released feature is Margin calculation together with Margin Calls. If the market goes against your trades and your trading account cannot maintain mid-trade drawdown - those trades will be closed in full or partly. Also, if your trading account cannot afford to open more trades (pyramiding those trades), Margin mechanism will prevent them from being entered.
I will not go into details about how Margin calculation works, it was all explainged in above mentioned blogpost and documentation .
All you need to do is to add two parameters to the opening line of your script:
margin_long = 1./30*50, margin_short = 1./30*50
Whereas "30" is a leverage scale as in 30:1, and "50" stands for 50% of Margin required by your broker. Personally the Required Margin number I've met most often is 50%, so I'm using value 50 here, but there are literally 1000+ brokers in this world and this is individual decision by each of them, so you'd better ask yourself.
--------------------
Please note, that if you ever encounter a strategy which triggers Margin Call at least once, then it is probably a very bad strategy. Margin Call is a last resort, last security measure - all the risks should be calculated by the strategy algorithm before it is ever hit. So if you see a Margin Call being triggred, then something is wrong with risk management of the strategy. Therefore - don't use it!

Tape [LucF]█ OVERVIEW
This script prints an ersatz of a trading console's "tape" section to the right of your chart. It displays the time, price and volume of each update of the chart's feed. It also calculates volume delta for the bar. As it calculates from realtime information, it will not display information on historical bars.
█ FEATURES
Calculations
Each new line in the tape displays the last price/volume update from the TradingView feed that's building your chart. These updates do not necessarily correspond to ticks from the originating broker/exchange's matching engine. Multiple broker/exchange ticks are often aggregated in one chart update.
The script first determines if price has moved up or down since the last update. The polarity of the price change, in turn, determines the polarity of the volume for that specific update. If price does not move between consecutive updates, then the last known polarity is used. Using this method, we can calculate a running volume delta accumulation for the bar, which becomes the bar's final volume delta value when the bar closes (you can inspect values of elapsed realtime bars in the Data Window or the indicator's values). Note that these values will all reset if the script re-executes because of a change in inputs or a chart refresh.
While this method of calculating volume delta is not perfect, it is currently the most precise way of calculating volume delta available on TradingView at the moment. Calculating more precise results would require scripts to have access to bid/ask levels from any chart timeframe. Charts at seconds timeframes do use exchange/broker ticks when the feeds you are using allow for it, and this indicator will run on them, but tick data is not yet available from higher timeframes, for now. Also note that the method used in this script is far superior to the intrabar inspection technique used on historical bars in my other "Delta Volume" indicators. This is because volume delta here is calculated from many more realtime updates than the available intrabars in history.
Inputs
You can use the script's inputs to configure:
• The number of lines displayed in the tape.
• If new lines appear at the top or bottom.
• If you want to hide lines with low volume.
• The precision of volume values.
• The size of the text and the colors used to highlight either the tape's text or background.
• The position where you want the tape on your chart.
• Conditions triggering three different markers.
Display
Deltas are shown at the bottom of the tape. They are reset on each bar. Time delta displays the time elapsed since the beginning of the bar, on intraday timeframes only. Contrary to the price change display by TradingView at the top left of charts, which is calculated from the close of the previous bar, the price delta in the tape is calculated from the bar's open, because that's the information used in the calculation of volume delta. The time will become orange when volume delta's polarity diverges from that of the bar. The volume delta value represents the current, cumulative value for the bar. Its color reflects its polarity.
When new realtime bars appear on the chart, a ↻ symbol will appear before the volume value in tape lines.
Markers
There are three types of markers you can choose to display:
• Marker 1 on volume bumps. A bump is defined as two consecutive and increasing/decreasing plus/minus delta volume values,
when no divergence between the polarity of delta volume and the bar occurs on the second bar.
• Marker 2 on volume delta for the bar exceeding a limit of your choice when there is no divergence between the polarity of delta volume and the bar. These trigger at the bar's close.
• Marker 3 on tape lines with volume exceeding a threshold. These trigger in realtime. Be sure to set a threshold high enough so that it doesn't generate too many alerts.
These markers will only display briefly under the bar, but another marker appears next to the relevant line in the tape.
The marker conditions are used to trigger alerts configured on the script. Alert messages will mention the marker(s) that triggered the specific alert event, along with the relevant volume value that triggered the marker. If more than one marker triggers a single alert, they will overprint under the bar, which can make it difficult to distinguish them.
For more detailed on-chart analysis of realtime volume delta, see my Delta Volume Realtime Action .
█ NOTES FOR CODERS
This script showcases two new Pine features:
• Tables, which allow Pine programmers to display tabular information in fixed locations of the chart. The tape uses this feature.
See the Pine User Manual's page on Tables for more information.
• varip -type variables which we can use to save values between realtime updates.
See the " Using `varip` variables " publication by PineCoders for more information.
