Honest Volatility Grid [Honestcowboy]The Honest Volatility Grid is an attempt at creating a robust grid trading strategy but without standard levels.
Normal grid systems use price levels like 1.01;1.02;1.03;1.04... and place an order at each of these levels. In this program instead we create a grid using keltner channels using a long term moving average.
🟦 IS THIS EVEN USEFUL?
The idea is to have a more fluid style of trading where levels expand and follow price and do not stick to precreated levels. This however also makes each closed trade different instead of using fixed take profit levels. In this strategy a take profit level can even be a loss. It is useful as a strategy because it works in a different way than most strategies, making it a good tool to diversify a portfolio of trading strategies.
🟦 STRATEGY
There are 10 levels below the moving average and 10 above the moving average. For each side of the moving average the strategy uses 1 to 3 orders maximum (3 shorts at top, 3 longs at bottom). For instance you buy at level 2 below moving average and you increase position size when level 6 is reached (a cheaper price) in order to spread risks.
By default the strategy exits all trades when the moving average is reached, this makes it a mean reversion strategy. It is specifically designed for the forex market as these in my experience exhibit a lot of ranging behaviour on all the timeframes below daily.
There is also a stop loss at the outer band by default, in case price moves too far from the mean.
What are the risks?
In case price decides to stay below the moving average and never reaches the outer band one trade can create a very substantial loss, as the bands will keep following price and are not at a fixed level.
Explanation of default parameters
By default the strategy uses a starting capital of 25000$, this is realistic for retail traders.
Lot sizes at each level are set to minimum lot size 0.01, there is no reason for the default to be risky, if you want to risk more or increase equity curve increase the number at your own risk.
Slippage set to 20 points: that's a normal 2 pip slippage you will find on brokers.
Fill limit assumtion 20 points: so it takes 2 pips to confirm a fill, normal forex spread.
Commission is set to 0.00005 per contract: this means that for each contract traded there is a 5$ or whatever base currency pair has as commission. The number is set to 0.00005 because pinescript does not know that 1 contract is 100000 units. So we divide the number by 100000 to get a realistic commission.
The script will also multiply lot size by 100000 because pinescript does not know that lots are 100000 units in forex.
Extra safety limit
Normally the script uses strategy.exit() to exit trades at TP or SL. But because these are created 1 bar after a limit or stop order is filled in pinescript. There are strategy.orders set at the outer boundaries of the script to hedge against that risk. These get deleted bar after the first order is filled. Purely to counteract news bars or huge spikes in price messing up backtest.
🟦 VISUAL GOODIES
I've added a market profile feature to the edge of the grid. This so you can see in which grid zone market has been the most over X bars in the past. Some traders may wish to only turn on the strategy whenever the market profile displays specific characteristics (ranging market for instance).
These simply count how many times a high, low, or close price has been in each zone for X bars in the past. it's these purple boxes at the right side of the chart.
🟦 Script can be fully automated to MT5
There are risk settings in lot sizes or % for alerts and symbol settings provided at the bottom of the indicator. The script will send alert to MT5 broker trying to mimic the execution that happens on tradingview. There are always delays when using a bridge to MT5 broker and there could be errors so be mindful of that. This script sends alerts in format so they can be read by tradingview.to which is a bridge between the platforms.
Use the all alert function calls feature when setting up alerts and make sure you provide the right webhook if you want to use this approach.
Almost every setting in this indicator has a tooltip added to it. So if any setting is not clear hover over the (?) icon on the right of the setting.
Поиск скриптов по запросу "the strat"

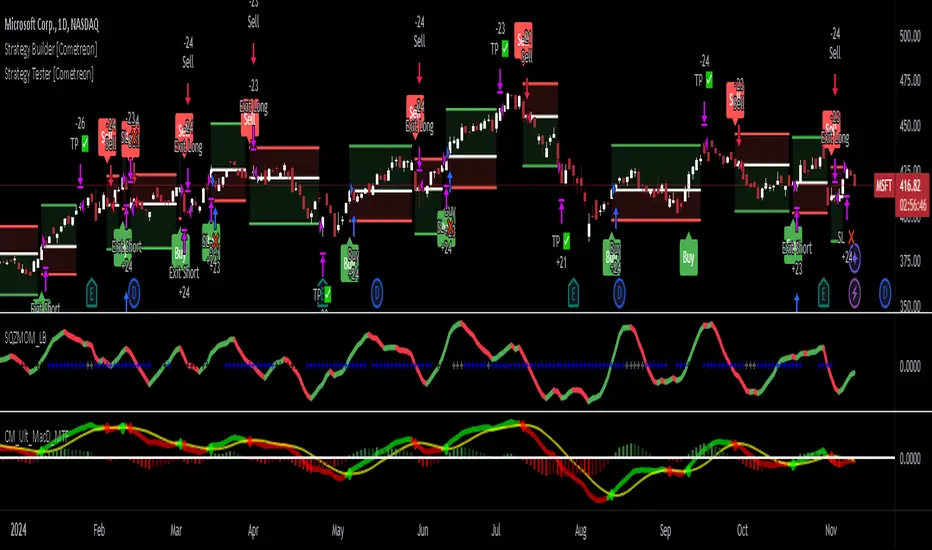
Strategy Tester [Cometreon]Strategy Tester is a powerful backtesting engine designed to evaluate and optimize trading strategies built with the Strategy Builder or signals triggered by the Signal Tester.
It provides a full-featured environment for assessing strategy performance across symbols and timeframes, offering smart tools for risk management, capital allocation, and alert handling.
Whether you're refining a custom strategy or validating signals, Strategy Tester helps you test with confidence and clarity.
🔷 Key Features
🟩 Multi-Symbol, Multi-Timeframe Testing
Easily test strategies across different assets and timeframes to understand how they behave in diverse market conditions.
🟩 Advanced Risk Management
Implement multiple Take Profit and Stop Loss combinations, break-even, trailing systems, and exit rules tailored to your style.
🟩 Flexible Session and Capital Settings
Customize trading hours, session windows, and initial capital allocation for ultra-precise testing scenarios.
🟩 Custom Alerts
Generate personalized alerts for entries, exits, and SL/TP adjustments to simulate real-time execution.
🔷 Technical Details and Customizable Inputs
1️⃣ Source Entry Long and Short - Select entry conditions for the strategy from the "Signal Tester" or "Strategy Builder".
2️⃣ Source Exit Long and Short - Select exit conditions for the strategy from the "Signal Tester" or "Strategy Builder".
3️⃣ Trading Session - Choose the period in which the strategy will enter positions, selecting from: Months, Days, up to 3 hourly sessions, and the strategy's activity range, i.e., start and end date.
4️⃣ Alert Message - Set custom messages for each type of Alert, such as Entry Long, Exit Short, or Change SL Long.
5️⃣ Plot - Choose whether to show Long and Short positions on the chart.
🔷 Risk Management Settings
1️⃣ Initial Capital - Set the starting capital for the strategy.
2️⃣ Quantity - Choose the entry quantity for each type of position, selecting from: Contracts, USD, Percentage of equity, or percentage of initial capital.
3️⃣ Take Profit - Configure up to 4 Take Profits using one of the following types:
%: Percentage from the entry price
USD: Distance in dollars
Pip: Distance in Pips
ATR: Based on ATR multiplier
Swing: Uses swing length
Risk Reward: Linked to Stop Loss or vice versa
4️⃣ Stop Loss - Set the SL using the same types as TP for maximum flexibility.
5️⃣ Break Even - Automatically modify SL when price hits a TP level, adjusting by % / USD / Pip from entry.
6️⃣ Trailing Take Profit - Activates a dynamic TP when a condition is met, updating it as price evolves (e.g., new highs).
7️⃣ Trailing Stop Loss - Updates SL automatically when the market moves in your favor (e.g., new lows in long trades).
8️⃣ Exit Before End Session - Exit positions a few candles before the session ends to avoid overnight risks.
🔍 How to Use Strategy Tester
🧩 Add the Indicator:
Load Strategy Tester onto your chart and connect it to any Cometreon signal generator.
⚙️ Configure Risk Settings:
Set up capital, risk, SL/TP parameters, and time filters to match your strategy profile.
🧪 Run the Test:
Execute the backtest and analyze the visual + data output for insight.
📊 Optimize and Repeat:
Adjust key parameters and re-run until your strategy achieves optimal performance.
☄️ Take your trading to the next level with TradeLab Beta's Strategy Tester this powerful backtesting tool and start optimizing your trading strategies today.
👉 Don't waste any more time and visit the link to get access to all Cometreon indicators.
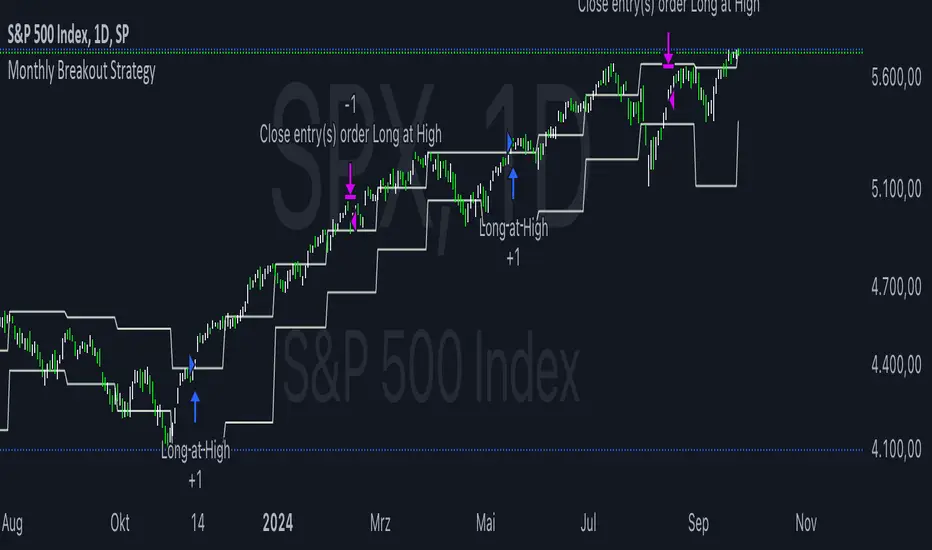
Monthly Breakout StrategyThis Monthly High/Low Breakout Strategy is designed to take long or short positions based on breakouts from the high or low of the previous month. Users can select whether they want to go long at a breakout above the previous month’s high, short at a breakdown below the previous month’s low, or use the reverse logic. Additionally, it includes a month filter, allowing trades to be executed only during user-specified months.
Breakout strategies, particularly those based on monthly highs and lows, aim to capitalize on price momentum. These systems rely on the assumption that once a significant price level is breached (such as the previous month's high or low), the market is likely to continue moving in the same direction due to increased volatility and trend-following behaviors by traders. Studies have demonstrated the potential effectiveness of breakout strategies in financial markets.
Scientific Evidence Supporting Breakout Strategies:
Momentum in Financial Markets:
Research on momentum-based strategies, which include breakout trading, shows that securities breaking key levels of support or resistance tend to continue their price movement in the direction of the breakout. Jegadeesh and Titman (1993) found that stocks with strong performance over a given period tend to continue performing well in subsequent periods, a principle also applied to breakout strategies.
Behavioral Finance:
The psychological factor of herd behavior is one of the driving forces behind breakout strategies. When prices break out of a key level (such as a monthly high), it triggers increased buying or selling pressure as traders join the trend. Barberis, Shleifer, and Vishny (1998) explained how cognitive biases, such as overconfidence and sentiment, can amplify price trends, which breakout strategies attempt to exploit.
Market Efficiency:
While markets are generally efficient, periods of inefficiency can occur, particularly around the breakouts of significant price levels. These inefficiencies often result in temporary price trends, which breakout strategies can exploit before the market corrects itself (Fama, 1970).
Risk Considerations:
Despite the potential for profit, the Monthly Breakout Strategy comes with several risks:
False Breakouts:
One of the most common risks in breakout strategies is the occurrence of false breakouts. These happen when the price temporarily moves above (or below) a key level but quickly reverses direction, causing losses for traders who entered positions too early. This is particularly risky in low-volatility environments.
Market Volatility:
Monthly breakout strategies rely on momentum, which may not be consistent across different market conditions. During periods of low volatility, price breakouts might lack the follow-through required for the strategy to succeed, leading to poor performance.
Whipsaw Risk:
The strategy is vulnerable to whipsaw markets, where prices oscillate around key levels without establishing a clear direction. This can result in frequent entry and exit signals that lead to losses, especially if trading costs are not managed properly.
Overfitting to Past Data:
If the month-selection filter is overly optimized based on historical data, the strategy may suffer from overfitting—performing well in backtests but poorly in real-time trading. This happens when strategies are tailored to past market conditions that may not repeat.
Conclusion:
While monthly breakout strategies can be effective in markets with strong momentum, they are subject to several risks, including false breakouts, volatility dependency, and whipsaw behavior. It is crucial to backtest this strategy thoroughly and ensure it aligns with your risk tolerance before implementing it in live trading.
References:
Jegadeesh, N., & Titman, S. (1993). Returns to Buying Winners and Selling Losers: Implications for Stock Market Efficiency. Journal of Finance, 48(1), 65-91.
Barberis, N., Shleifer, A., & Vishny, R. (1998). A Model of Investor Sentiment. Journal of Financial Economics, 49(3), 307-343.
Fama, E. F. (1970). Efficient Capital Markets: A Review of Theory and Empirical Work. Journal of Finance, 25(2), 383-417.
Larry Connors RSI 3 StrategyThe Larry Connors RSI 3 Strategy is a short-term mean-reversion trading strategy. It combines a moving average filter and a modified version of the Relative Strength Index (RSI) to identify potential buying opportunities in an uptrend. The strategy assumes that a short-term pullback within a long-term uptrend is an opportunity to buy at a discount before the trend resumes.
Components of the Strategy:
200-Day Simple Moving Average (SMA): The price must be above the 200-day SMA, indicating a long-term uptrend.
2-Period RSI: This is a very short-term RSI, used to measure the speed and magnitude of recent price changes. The standard RSI is typically calculated over 14 periods, but Connors uses just 2 periods to capture extreme overbought and oversold conditions.
Three-Day RSI Drop: The RSI must decline for three consecutive days, with the first drop occurring from an RSI reading above 60.
RSI Below 10: After the three-day drop, the RSI must reach a level below 10, indicating a highly oversold condition.
Buy Condition: All the above conditions must be satisfied to trigger a buy order.
Sell Condition: The strategy closes the position when the RSI rises above 70, signaling that the asset is overbought.
Who Was Larry Connors?
Larry Connors is a trader, author, and founder of Connors Research, a firm specializing in quantitative trading research. He is best known for developing strategies that focus on short-term market movements. Connors co-authored several popular books, including "Street Smarts: High Probability Short-Term Trading Strategies" with Linda Raschke, which has become a staple among traders seeking reliable, rule-based strategies. His research often emphasizes simplicity and robust testing, which appeals to both retail and institutional traders.
Scientific Foundations
The Relative Strength Index (RSI), originally developed by J. Welles Wilder in 1978, is a momentum oscillator that measures the speed and change of price movements. It oscillates between 0 and 100 and is typically used to identify overbought or oversold conditions in an asset. However, the use of a 2-period RSI in Connors' strategy is unconventional, as most traders rely on longer periods, such as 14. Connors' research showed that using a shorter period like 2 can better capture short-term reversals, particularly when combined with a longer-term trend filter such as the 200-day SMA.
Connors' strategies, including this one, are built on empirical research using historical data. For example, in a study of over 1,000 signals generated by this strategy, Connors found that it performed consistently well across various markets, especially when trading ETFs and large-cap stocks (Connors & Alvarez, 2009).
Risks and Considerations
While the Larry Connors RSI 3 Strategy is backed by empirical research, it is not without risks:
Mean-Reversion Assumption: The strategy is based on the premise that markets revert to the mean. However, in strong trending markets, the strategy may underperform as prices can remain oversold or overbought for extended periods.
Short-Term Nature: The strategy focuses on very short-term movements, which can result in frequent trading. High trading frequency can lead to increased transaction costs, which may erode profits.
Market Conditions: The strategy performs best in certain market environments, particularly in stable uptrends. In highly volatile or strongly trending markets, the strategy's performance can deteriorate.
Data and Backtesting Limitations: While backtests may show positive results, they rely on historical data and do not account for future market conditions, slippage, or liquidity issues.
Scientific literature suggests that while technical analysis strategies like this can be effective in certain market conditions, they are not foolproof. According to Lo et al. (2000), technical strategies may show patterns that are statistically significant, but these patterns often diminish once they are widely adopted by traders.
References
Connors, L., & Alvarez, C. (2009). Short-Term Trading Strategies That Work. TradingMarkets Publishing Group.
Lo, A. W., Mamaysky, H., & Wang, J. (2000). Foundations of Technical Analysis: Computational Algorithms, Statistical Inference, and Empirical Implementation. The Journal of Finance, 55(4), 1705-1770.
Wilder, J. W. (1978). New Concepts in Technical Trading Systems. Trend Research

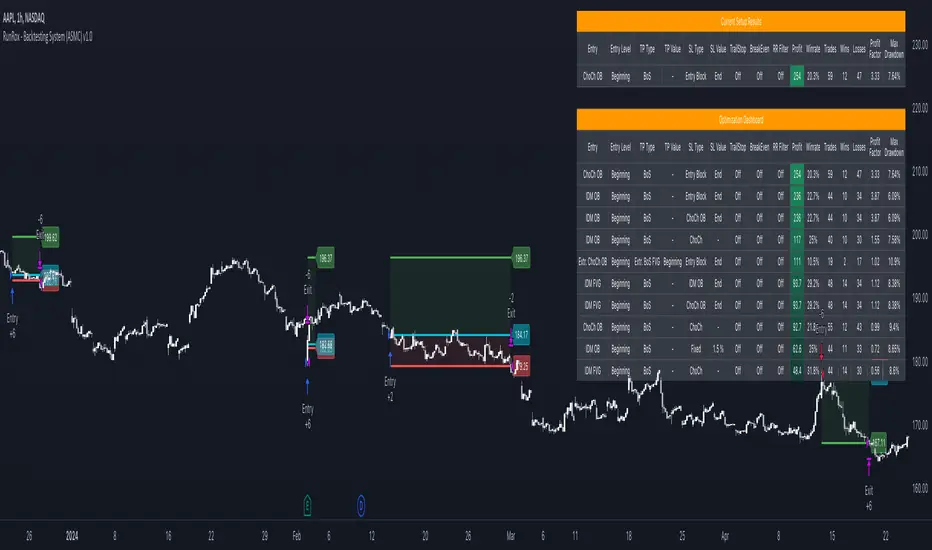
RunRox - Backtesting System (ASMC)Introducing RunRox - Backtesting System (ASMC), a specially designed backtesting system built on the robust structure of our Advanced SMC indicator. This innovative tool evaluates various Smart Money Concept (SMC) trading setups and serves as an automatic optimizer, displaying which entry and exit points have historically shown the best results. With cutting-edge technology, RunRox - Backtesting System (ASMC) provides you with effective strategies, maximizing your trading potential and taking your trading to the next level
🟠 HOW OUR BACKTESTING SYSTEM WORKS
Our backtesting system for the Advanced SMC (ASMC) indicator is meticulously designed to provide traders with a thorough analysis of their Smart Money Concept (SMC) strategies. Here’s an overview of how it works:
🔸 Advanced SMC Structure
Our ASMC indicator is built upon an enhanced SMC structure that integrates the Institutional Distribution Model (IDM), precise retracements, and five types of order blocks (CHoCH OB, IDM OB, Local OB, BOS OB, Extreme OB). These components allow for a detailed understanding of market dynamics and the identification of key trading opportunities.
🔸 Data Integration and Analysis
1. Historical Data Testing:
Our system tests various entry and exit points using historical market data.
The ASMC indicator is used to simulate trades based on predefined SMC setups, evaluating their effectiveness over a specified time period.
Traders can select different parameters such as entry points, stop-loss, and take-profit levels to see how these setups would have performed historically.
2. Entry and Exit Events:
The backtester can simulate trades based on 12 different entry events, 14 target events, and 14 stop-loss events, providing a comprehensive testing framework.
It allows for testing with multiple combinations of entry and exit strategies, ensuring a robust evaluation of trading setups.
3. Order Block Sensitivity:
The system uses the sensitivity settings from the ASMC indicator to determine the most relevant order blocks and fair value gaps (FVGs) for entry and exit points.
It distinguishes between different types of order blocks, helping traders identify strong institutional zones versus local zones.
🔸 Optimization Capabilities
1. Auto-Optimizer:
The backtester includes an auto-optimizer feature that evaluates various setups to find those with the best historical performance.
It automatically adjusts parameters to identify the most effective strategies for both trend-following and counter-trend trading.
2. Stop Loss and Take Profit Optimization:
It optimizes stop-loss and take-profit levels by testing different settings and identifying those that provided the best historical results.
This helps traders refine their risk management and maximize potential returns.
3. Trailing Stop Optimization:
The system also optimizes trailing stops, ensuring that traders can maximize their profits by adjusting their stops dynamically as the market moves.
🔸 Comprehensive Reporting
1. Performance Metrics:
The backtesting system provides detailed reports, including key performance metrics such as Net Profit, Win Rate, Profit Factor, and Max Drawdown.
These metrics help traders understand the historical performance of their strategies and make data-driven decisions.
2. Flexible Settings:
Traders can adjust initial balance, commission rates, and risk per trade settings to simulate real-world trading conditions.
The system supports testing with different leverage settings, allowing for realistic assessments even with tight stop-loss levels.
🔸 Conclusion
The RunRox Backtesting System (ASMC) is a powerful tool for traders seeking to validate and optimize their SMC strategies. By leveraging historical data and sophisticated optimization algorithms, it provides insights into the most effective setups, enhancing trading performance and decision-making.
🟠 HERE ARE THE AVAILABLE FEATURES
Historical backtesting for any setup – Select any entry point, exit point, and various stop-loss options to see the results of your setup on historical data.
Auto-optimizer for finding the best setups – The indicator displays settings that have shown the best results historically, providing valuable insights.
Auto-optimizer for counter-trend setups – Discover entry and exit points for counter-trend trading based on historical performance.
Auto-optimizer for stop-loss – The indicator shows stop-loss points that have been most effective historically.
Auto-optimizer for take-profit – The indicator identifies take-profit points that have performed well in historical trading data.
Auto-optimizer for trailing stop – The indicator presents trailing stop settings that have shown the best historical results.
And much more within our indicator, all of which we will cover in this post. Next, we will showcase the possible entry points, targets, and stop-loss options available for testing your strategies
🟠 ENTRY SETTINGS
12 Event Triggers for Trade Entry
Extr. ChoCh OB
Extr. ChoCh FVG
ChoCh
ChoCh OB
ChoCh FVG
IDM OB
IDM FVG
BoS FVG
BoS OB
BoS
Extr. BoS FVG
Extr. BoS OB
3 Trade Direction Options
Long Only: Enter long positions only
Short Only: Enter short positions only
Long and Short: Enter both long and short positions based on trend
3 Levels for Order Block/FVG Entries
Beginning: Enter the trade at the first touch of the Order Block/FVG
Middle: Enter the trade when the middle of the Order Block/FVG is reached
End: Enter the trade upon full filling of the Order Block/FVG
*Three levels work only for Order Blocks and FVG. For trade entries based on BOS or CHoCH, these settings do not apply as these parameters are not available for these types of entries
You can choose any combination of trade entries imaginable.
🟠 TARGET SETTINGS
14 Target Events, Including Fixed % and Fixed RR (Risk/Reward):
Fixed - % change in price
Fixed RR - Risk Reward per trade
Extr. ChoCh OB
Extr. ChoCh FVG
ChoCh
ChoCh OB
ChoCh FVG
IDM OB
IDM FVG
BoS FVG
BoS OB
BoS
Extr. BoS FVG
Extr. BoS OB
3 Levels of Order Block/FVG for Target
Beginning: Close the trade at the first touch of your target.
Middle: Close the trade at the midpoint of your chosen target.
End: Close the trade when your target is fully filled.
Customizable Parameters
Easily set your Fixed % and Fixed RR targets with a user-friendly input field. This field works only for the Fixed and Fixed RR entry parameters. When selecting a different entry point, this field is ignored
Choose any combination of target events to suit your trading strategy.
🟠 STOPLOSS SETTINGS
14 Possible StopLoss Events Including Entry Orderblock/FVG
Fixed - Fix the loss on the trade when the price moves by N%
Entry Block
Extr. ChoCh OB
Extr. ChoCh FVG
ChoCh
ChoCh OB
ChoCh FVG
IDM OB
IDM FVG
BoS FVG
BoS OB
BoS
Extr. BoS FVG
Extr. BoS OB
3 Levels for Order Blocks/FVG Exits
Beginning: Exit the trade at the first touch of the order block/FVG.
Middle: Exit the trade at the middle of the order block/FVG.
End: Exit the trade at the full completion of the order block/FVG.
Dedicated Field for Setting Fixed % Value
Set a fixed % value in a dedicated field for the Fixed parameter. This field works only for the Fixed parameter. When selecting other exit parameters, this field is ignored.
🟠 ADDITIONAL SETTINGS
Trailing Stop, %
Set a Trailing Stop as a percentage of your trade to potentially increase profit based on historical data.
Move SL to Breakeven, bars
Move your StopLoss to breakeven after exiting the entry zone for a specified number of bars. This can enhance your potential WinRate based on historical performance.
Skip trade if RR less than
This feature allows you to skip trades where the potential Risk-to-Reward ratio is less than the number set in this field.
🟠 EXAMPLE OF MANUAL SETUP
For example, let me show you how it works on the chart. You select entry parameters, stop loss parameters, and take profit parameters for your trades, and the strategy automatically tests this setup on historical data, allowing you to see the results of this strategy.
In the screenshot above, the parameters were as follows:
Trade Entry: CHoCH OB (Beginning)
Stop Loss: Entry Block
Take Profit: Break of BOS
The indicator will automatically test all possible trades on the chart and display the results for this setup.
🟠 AUTO OPTIMIZATION SETTINGS
In the screenshot above, you can see the optimization table displaying various entry points, exits, and stop-loss settings, along with their historical performance results and other parameters. This feature allows you to identify trading setups that have shown the best historical outcomes.
This functionality will enhance your trading approach, providing you with valuable insights based on historical data. You’ll be aware of the Smart Money Concept settings that have historically worked best for any specific chart and timeframe.
Our indicator includes various optimization options designed to help you find the most effective settings based on historical data. There are 5 optimization modes, each offering unique benefits for every trader
Trend Entry - Optimization of the best settings for trend-following trades. The strategy will enter trades only in the direction of the trend. If the trend is upward, it will look for long entry points and vice versa.
Counter Trend Entry - Finding setups against the trend. If the trend is upward, the script will search for short entry points. This is the opposite of trend entry optimization.
Stop Loss - Identifying stop-loss points that showed the best historical performance for the specific setup you have configured. This helps in finding effective exit points to minimize losses.
Take Profit - Determining targets for the configured setup based on historical performance, helping to identify potentially profitable take profit levels.
Trailing Stop - Finding optimal percentages for the trailing stop function based on historical data, which can potentially increase the profit of your trades.
Ability to set parameters for auto-optimization within a specified range. For example, if you choose FixRR TP from 1 to 10, the indicator will automatically test all possible Risk Reward Take Profit variations from 1 to 10 and display the results for each parameter individually.
Ability to set initial deposit parameters, position commissions, and risk per trade as a fixed percentage or fixed amount. Additionally, you can set the maximum leverage for a trade.
There are times when the stop loss is very close to the entry point, and adhering to the risk per trade values set in the settings may not allow for such a loss in any situation. That’s why we added the ability to set the maximum possible leverage, allowing you to test your trading strategy even with very tight stop losses.
Duplicated Smart Money Structure settings from our Advanced SMC indicator that you can adjust to match your trading style flexibly. All these settings will be taken into account during the optimization process or when manually calculating settings.
Additionally, you can test your strategy based on higher timeframe order blocks. For example, you can test a strategy on a 1-minute chart while displaying order blocks from a 15-minute timeframe. The auto-optimizer will consider all these parameters, including higher timeframe order blocks, and will enter trades based on these order blocks.
Highly flexible dashboard and results optimization settings allow you to display the tables you need and sort results by six different criteria: Profit Factor, Profit, Winrate, Max Drawdown, Wins, and Trades. This enables you to find the exact setup you desire, based on these comprehensive data points.
🟠 ALERT CUSTOMIZATION
With this indicator, you can set up buy and sell alerts based on the test results, allowing you to create a comprehensive trading strategy. This feature enables you to receive real-time signals, making it a powerful tool for implementing your trading strategies.
🟠 STRATEGY PROPERTIES
For backtesting, we used realistic initial data for entering trades, such as:
Starting balance: $1000
Commission: 0.01%
Risk per trade: 1%
To ensure realistic data, we used the above settings. We offer two methods for calculating your order size, and in our case, we used a 1% risk per trade. Here’s what it means:
Risk per trade: This is the maximum loss from your deposit if the trade goes against you. The trade volume can change depending on your stop-loss distance from the entry point. Here’s the formula we use to calculate the possible volume for a single trade:
1. quantity = percentage_risk * balance / loss_per_1_contract (incl. fee)
Then, we calculate the maximum allowed volume based on the specified maximum leverage:
2. max_quantity = maxLeverage * balance / entry_price
3. If quantity < max_quantity, meaning the leverage is less than the maximum allowed, we keep quantity. If quantity > max_quantity, we use max_quantity (the maximum allowed volume according to the set leverage).
This way, depending on the stop-loss distance, the position size can vary and be up to 100% of your deposit, but the loss in each trade will not exceed the set percentage, which in our case is 1% for this backtest. This is a standard risk calculation method based on your stop-loss distance.
🔸 Statistical Significance of Trade Data
In our strategy, you may notice there weren’t enough trades to form statistically significant data. This is inherent to the Smart Money Concept (SMC) strategy, where the focus is not on the number of trades but rather on the risk-to-reward ratio per trade. In SMC strategies, it’s crucial to avoid taking numerous uncertain setups and instead perform a comprehensive analysis of the market situation.
Therefore, our strategy results show fewer than 100 trades. It’s important to understand that this small sample size isn’t statistically significant and shouldn’t be relied upon for strategy analysis. Backtesting with a small number of trades should not be used to draw conclusions about the effectiveness of a strategy.
🔸 Versatile Use Cases
The methods of using this indicator are numerous, ranging from identifying potentially the best-performing order blocks on the chart to creating a comprehensive trading strategy based on the data provided by our indicator. We believe that every trader will find a valuable application for this tool, enhancing their entry and exit points in trades.
Disclaimer
Past performance is not indicative of future results. The results shown by this indicator do not guarantee similar outcomes in the future. Use this tool as part of a comprehensive trading strategy, considering all market conditions and risks.
How to access
For access to this indicator, please read the author’s instructions below this post
Strategic Multi-Step Supertrend - Strategy [presentTrading]The code is mainly developed for me to stimulate the multi-step taking profit function for strategies. The result shows the drawdown can be reduced but at the same time reduced the profit as well. It can be a heuristic for futures leverage traders.
█ Introduction and How it is Different
The "Strategic Multi-Step Supertrend" is a trading strategy designed to leverage the power of multiple steps to optimize trade entries and exits across the Supertrend indicator. Unlike traditional strategies that rely on single entry and exit points, this strategy employs a multi-step approach to take profit, allowing traders to lock in gains incrementally. Additionally, the strategy is adaptable to both long and short trades, providing a comprehensive solution for dynamic market conditions.
This template strategy lies in its dual Supertrend calculation, which enhances the accuracy of trend detection and provides more reliable signals for trade entries and exits. This approach minimizes false signals and increases the overall profitability of trades by ensuring that positions are entered and exited at optimal points.
BTC 6h L/S Performance
█ Strategy, How It Works: Detailed Explanation
The "Strategic Multi-Step Supertrend Trader" strategy utilizes two Supertrend indicators calculated with different parameters to determine the direction and strength of the market trend. This dual approach increases the robustness of the signals, reducing the likelihood of entering trades based on false signals. Here is a detailed breakdown of how the strategy operates:
🔶 Supertrend Indicator Calculation
The Supertrend indicator is a trend-following overlay on the price chart, typically used to identify the direction of the trend. It is calculated using the Average True Range (ATR) to ensure that the indicator adapts to market volatility. The formula for the Supertrend indicator is:
Upper Band = (High + Low) / 2 + (Factor * ATR)
Lower Band = (High + Low) / 2 - (Factor * ATR)
Where:
- High and Low are the highest and lowest prices of the period.
- Factor is a user-defined multiplier.
- ATR is the Average True Range over a specified period.
The Supertrend changes its direction based on the closing price in relation to these bands.
🔶 Entry-Exit Conditions
The strategy enters long positions when both Supertrend indicators signal an uptrend, and short positions when both indicate a downtrend. Specifically:
- Long Condition: Supertrend1 < 0 and Supertrend2 < 0
- Short Condition: Supertrend1 > 0 and Supertrend2 > 0
- Long Exit Condition: Supertrend1 > 0 and Supertrend2 > 0
- Short Exit Condition: Supertrend1 < 0 and Supertrend2 < 0
🔶 Multi-Step Take Profit Mechanism
The strategy features a multi-step take profit mechanism, which allows traders to lock in profits incrementally. This is achieved through four user-configurable take profit levels. For each level, the strategy specifies a percentage increase (for long trades) or decrease (for short trades) in the entry price at which a portion of the position is exited:
- Step 1: Exit a portion of the trade at Entry Price * (1 + Take Profit Percent1 / 100)
- Step 2: Exit a portion of the trade at Entry Price * (1 + Take Profit Percent2 / 100)
- Step 3: Exit a portion of the trade at Entry Price * (1 + Take Profit Percent3 / 100)
- Step 4: Exit a portion of the trade at Entry Price * (1 + Take Profit Percent4 / 100)
This staggered exit strategy helps in locking profits at multiple levels, thereby reducing risk and increasing the likelihood of capturing the maximum possible profit from a trend.
BTC Local
█ Trade Direction
The strategy is highly flexible, allowing users to specify the trade direction. There are three options available:
- Long Only: The strategy will only enter long trades.
- Short Only: The strategy will only enter short trades.
- Both: The strategy will enter both long and short trades based on the Supertrend signals.
This flexibility allows traders to adapt the strategy to various market conditions and their own trading preferences.
█ Usage
1. Add the strategy to your trading platform and apply it to the desired chart.
2. Configure the take profit settings under the "Take Profit Settings" group.
3. Set the trade direction under the "Trade Direction" group.
4. Adjust the Supertrend settings in the "Supertrend Settings" group to fine-tune the indicator calculations.
5. Monitor the chart for entry and exit signals as indicated by the strategy.
█ Default Settings
- Use Take Profit: True
- Take Profit Percentages: Step 1 - 6%, Step 2 - 12%, Step 3 - 18%, Step 4 - 50%
- Take Profit Amounts: Step 1 - 12%, Step 2 - 8%, Step 3 - 4%, Step 4 - 0%
- Number of Take Profit Steps: 3
- Trade Direction: Both
- Supertrend Settings: ATR Length 1 - 10, Factor 1 - 3.0, ATR Length 2 - 11, Factor 2 - 4.0
These settings provide a balanced starting point, which can be customized further based on individual trading preferences and market conditions.

IsAlgo - AI Trend Strategy► Overview:
The AI Trend Strategy employs a combination of technical indicators to guide trading decisions across various markets and timeframes. It uses a custom Super Trend indicator and an Exponential Moving Average (EMA) to analyze market trends and executes trades based on specific candlestick patterns. This strategy includes options for setting stop losses, take profit levels, and features an alert system for trade notifications.
► Description:
This strategy focuses on identifying the optimal "entry candle," which signals either a potential correction within the ongoing trend or the emergence of a new trend. The entry criteria for this candle are highly customizable, allowing traders to specify dimensions such as the candle's minimum and maximum size and body ratio. Additional settings include whether this candle should be the highest or lowest compared to recent candles and if a confirmation candle is necessary to validate the entry.
The Super Trend indicator is central to the strategy’s operation, dictating the direction of trades by identifying bullish or bearish trends. Traders have the option to configure trades to align with the direction of the trend identified by this indicator, or alternatively, to take positions counter to the trend for potential reversal strategies. This flexibility can be crucial during varying market conditions.
Additionally, the strategy incorporates an EMA alongside the Super Trend indicator to further analyze trend directions. This combined approach aims to reduce the occurrence of false signals and improve the strategy's overall trend analysis.
The learning algorithm is a standout feature of the AI Trend Strategy. After accumulating data from a predefined number of trades (e.g., after the first 100 trades), the algorithm begins to analyze past performances to identify patterns in wins and losses. It considers variables such as the distance from the current price to the trend line, the range between the highest and lowest prices during the trend, and the duration of the trend. This data informs the algorithm's predictions for future trades, aiming to improve accuracy and reduce losses by adapting to the evolving market conditions.
► Examples of Trade Execution:
1. In an Uptrend: The strategy might detect a suitable entry candle during a correction phase, which aligns with the continuing uptrend for a potential long trade.
2. In a Downtrend: Alternatively, the strategy might identify an entry candle at the end of a downtrend, suggesting a potential reversal or correction where a long trade could be initiated.
3. In an Uptrend: The strategy may also spot an entry candle at the end of an uptrend and execute a short trade, anticipating a reversal or significant pullback.
4. In a Downtrend: The strategy might find a suitable entry candle during a correction phase, indicating a continuation of the downtrend for a potential short trade.
These examples illustrate how the strategy identifies potential trading opportunities based on trend behavior and candlestick patterns.
► Features and Settings:
⚙︎ Trend: Utilizes a custom Super Trend indicator to identify the direction of the market trend. Users can configure the strategy to execute trades in alignment with this trend, take positions contrary to the trend, or completely ignore the trend information for their trading decisions.
⚙︎ Moving average: Employs an Exponential Moving Average (EMA) to further confirm the trend direction indicated by the Super Trend indicator. This setting can be used in conjunction with the Super Trend or disabled if preferred.
⚙︎ Entry candle: Defines the criteria for the candle that triggers a trade. Users can customize aspects such as the candle's size, body, and its relative position to previous candles to ensure it meets specific trading requirements before initiating a trade.
⚙︎ Learning algorithm: This component uses historical trade data to refine the strategy. It assesses various aspects of past trades, such as price trends and market conditions, to make more informed trading decisions in the future.
⚙︎ Trading session: Users can define specific trading hours during which the strategy should operate, allowing trades to be executed only during preferred market periods.
⚙︎ Trading days: This option enables users to specify which days the strategy should be active, providing the flexibility to avoid trading on certain days of the week if desired.
⚙︎ Backtesting: Enables a period during which the strategy can be tested over a selected start and end date, with an option to deactivate this feature if not needed.
⚙︎ Trades: Detailed configuration options include the direction of trades (long, short, or both), position sizing (fixed or percentage-based), the maximum number of open trades, and limitations on the number of trades per day or based on trend changes.
⚙︎ Trades Exit: Offers various strategies for exiting trades, such as setting limits on profits or losses, specifying the duration a trade should remain open, or closing trades based on trend reversal signals.
⚙︎ Stop loss: Various methods for setting stop losses are available, including fixed pips, based on Average True Range (ATR), or utilizing the highest or lowest price points within a designated number of previous candles. Another option allows for closing the trade after a specific number of candles moving in the opposite direction.
⚙︎ Break even: This feature adjusts the stop loss to a break-even point under certain conditions, such as reaching predefined profit levels, to protect gains.
⚙︎ Trailing stop: The trailing stop feature adjusts the stop loss as the trade moves into profit, aiming to secure gains while potentially capturing further upside.
⚙︎ Take profit: Up to three take profit levels can be established using various methods, such as a fixed amount of pips, risk-to-reward ratios based on the stop loss, ATR, or after a set number of candles that move in the direction of the trade.
⚙︎ Alerts: Includes a comprehensive alert system that informs the user of all significant actions taken by the strategy, such as trade openings and closings. It supports placeholders for dynamic values like take profit levels, stop loss prices, and more.
⚙︎ Dashboard: Provides a visual display of detailed information about ongoing and past trades on the chart, helping users monitor the strategy’s performance and make informed decisions.
► Backtesting Details:
Timeframe: 15-minute BTCUSD chart.
Initial Balance: $10,000.
Order Size: 4% of equity per trade.
Commission: 0.01%.
Slippage: 5 ticks.
Risk Management: Strategic stop loss settings are applied based on the most extreme price points within the last 18 candles.

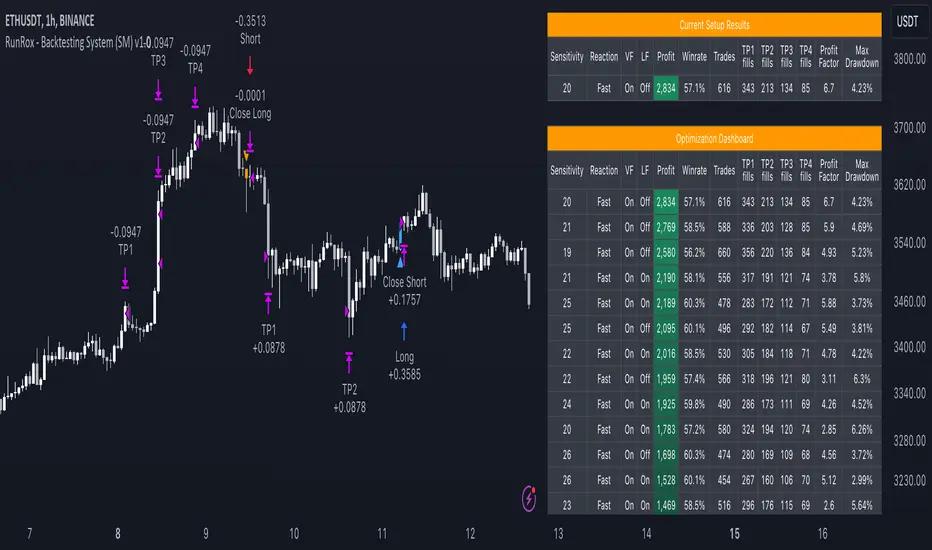
RunRox - Backtesting System (SM)RunRox - Backtesting System (SM) is designed for flexible and comprehensive testing of trading strategies, closely integrated with our RunRox - Signals Master indicator. This combination enhances your ability to refine strategies efficiently, providing you with insights to adapt and optimize your trading tactics seamlessly.
The Backtesting System (SM) excels in pinpointing the optimal settings for the RunRox - Signals Master indicator, efficiently highlighting the most effective configurations.
Capabilities of the Backtesting System (SM)
Optimal Settings Determination: Identifies the best configurations for the Signals Master indicator to enhance its effectiveness.
Timeframe-Specific Strategy Testing: Allows strategies to be tested over specific historical time periods to assess their viability.
Customizable Initial Conditions: Enables setting of initial deposit, risk per trade, and commission rates to mirror real-world trading conditions.
Flexible Money Management: Provides options to set take profits and stop losses, optimizing potential returns and risk management.
Intuitive Dashboard: Features a user-friendly dashboard that visually displays all pertinent information, making it easy to analyze and adjust strategies.
Trading Flexibility Across Three Modes:
Dual-Direction Trading: Engage in both buying and selling with this mode. Our dashboard optimizes and identifies the best settings for trading in two directions, streamlining the process to maximize effectiveness for both buy and sell orders.
Buy-Only Mode: Tailored for traders focusing exclusively on purchasing assets. In this mode, our backtester pinpoints the most advantageous sensitivity, speed reaction, and filter settings specifically for buying. Optimal settings in this mode may differ from those used in dual-direction trading, providing a customized approach to single-direction strategies.
Sell-Only Mode: Perfect for strategies primarily based on selling. This setting allows you to discover the ideal configurations for asset sales, which can be particularly useful if you are looking for optimal exit points in long-term transactions or under specific market conditions.
Here's an example of how profits can differ on the same asset when trading using two distinct strategies: exclusively buying or trading in both directions.
Above in the image, you can see how one-directional trading influences the results of backtests on historical data. While this does not guarantee future outcomes, it provides insight into how the strategy's performance can vary with different trading directions.
As you can also see from the image, one-directional trading has affected the optimal combination of settings for Sensitivity, Speed Reaction, and Filters.
Stop Loss and Take Profit
Our backtesting system, as you might have gathered, includes flexible settings for take profits and stop losses. Here are the main features:
Multiple Take Profits: Ability to set from 1 to 4 take profit levels.
Fixed Percentage: Option to assign a fixed percentage for each take profit.
Trade Proportion Fixation: Ability to set a fixed size from the trade for securing profits.
Stop Loss Installation: Option to establish a stop loss.
Break-Even Stop Loss: Ability to move the stop loss to a break-even point upon reaching a specified take profit level.
These settings offer extensive flexibility and can be customized according to your preferences and trading style. They are suitable for both novice and professional traders looking to test their trading strategies on historical data.
As illustrated in the image above, we have implemented money management by setting fixed take profits and stop losses. Utilizing money management has improved indicators such as profit, maximum drawdown, and profit factor, turning even historically unprofitable strategies into profitable ones. Although this does not guarantee future results, it serves as a valuable tool for understanding the effectiveness of money management.
Additionally, as you can see, the optimal settings for Signals Master have been adjusted, highlighting the best configurations for the most favorable outcomes.
Disclaimer:
Historical data is not indicative of future results. All indicators and strategies provided by RunRox are intended for integration with traders' strategies and should be used as tools for analysis rather than standalone solutions. Traders should use their own discretion and understand that all trading involves risk.
FreedX Backtest Plus█ Our new FreedX Backtest PLUS template enhances TradingView backtesting with smart features like Mean Reversion, Flexible Volatility, Liquidation Filter, and Better Trend Filtering, making strategies more effective. It lets users set up automated alerts easily. This guide explains how to make the most of these improved features.
The Trading Date Settings feature in our TradingView script allows you to refine their backtesting parameters by specifying trading dates and hours. This feature enhances the accuracy of the backtest by aligning it with specific time frames and days, ensuring that the strategy is tested under relevant market conditions.
Features:
⚙️ Enable Trading Between Specific Dates:
🎯 Purpose:
→ Allows you to limit the backtesting of their strategy to a specific date range.
💡 How to Use:
→ Input the Start Date and End Date for the backtest period.
→ The script will execute the strategy only within this specified date range.
⚙️ Enable Trading Between Specific Hours:
🎯 Purpose:
→ Allows you to limit the backtesting of their strategy to a specific hour range.
💡 How to Use:
→ Input the start and end hour for in Trading Session section.
→ The script will execute the strategy only within this specified hour range.
⚙️ Enable Trading on Specified Days of the Week:
🎯 Purpose:
→ Gives you the option to conduct backtesting on selected days of the week, tailoring the strategy to particular market behaviours that may occur on these days.
💡 How to Use:
→ Select the days of the week for the backtest.
→ The script will activate the trading strategy only on these chosen days.
█ BUY/SELL TRIGGER SETTINGS
The Buy/Sell Trigger Settings feature is designed to provide users with flexibility in defining the conditions for 'LONG' and 'SHORT' signals based on various indicator types. This customization is crucial for tailoring strategies to different trading styles and market conditions.
Features:
⚙️ Single-Line Plotted Indicators :
🎯 Purpose:
→ Enables you to select a single-line plotted indicator as a source for backtesting. You can define specific levels to trigger 'LONG' or 'SHORT' signals.
💡 How to Use:
→ Choose a Single-Line Plotted indicator as the source.
→ Set the top and bottom levels for the indicator.
→ The script triggers 'LONG' signals at the bottom level and 'SHORT' signals at the top level.
⚙️ Two-Line Plotted Indicators :
🎯 Purpose:
→ Allows backtesting with two-line cross plot sources. Signals are generated based on the crossover of these lines.
💡 How to Use:
→ Select two lines as 'Source 1' and 'Source 2' for the indicator.
→ The script triggers a 'LONG' signal when 'Source 1' crosses above 'Source 2'.
→ Conversely, a 'SHORT' signal is triggered when 'Source 2' crosses above 'Source 1'.
⚙️ Custom Signals :
🎯 Purpose:
→ This setting enables users to define their own criteria for LONG, SHORT, and CLOSE signals based on custom indicator outputs.
💡 How to Use:
→ Select the custom source for your signals.
→ Define the output values that correspond to each signal type (e.g., “1” for 'LONG', “-1” for SHORT, and “0” for CLOSE).
→ The script will trigger signals according to these custom-defined values.
█ TP/SL SETTINGS
The TP/SL (Take Profit/Stop Loss) Settings feature is designed to give users control over their profit securing and risk mitigation strategies. This feature allows for setting custom TP and SL levels, which can be critical in managing trades effectively.
Features:
Custom TP/SL Levels for Long/Short Signals:
🎯 Purpose:
→ Enables users to set specific percentage levels for Take Profit and Stop Loss on long and short signals.
💡 How to Use:
→ In the TP/SL Settings, input the desired percentage for Take Profit (TP) and Stop Loss (SL).
→ For example, to secure a profit at a 10% price increase on LONG signals, set the “Long TP Percentage” to “10”.
█ STRATEGY SETTINGS
Strategy Settings provide a range of options to customize the trading strategy. These settings include leverage, position direction changes, and more, allowing users to tailor their strategy to their risk tolerance and market view.
Features:
⚙️ Enable Reverse Position:
🎯 Purpose:
→ Automatically closes a current position and opens a new one in the opposite direction upon detecting a signal for a market trend change.
🎯 Example:
→ If a LONG signal is received while in a SHORT position, the script will close the SHORT position and open a LONG position.
💡 How to Use:
→ Activate this feature in the Strategy Settings.
⚙️ Enable Spot Mode:
🎯 Purpose:
→ Disables short orders, using short signals only for closing long positions.
💡 How to Use:
→ Select the 'Spot Mode' option in the Strategy Settings.
⚙️ Enable Invert Signals:
🎯 Purpose:
→ Inverts all indicator signals, changing LONG signals to SHORT and vice versa.
💡 How to Use:
→ Opt for the 'Invert Signals' feature in the Strategy Settings.
⚙️ Enable Trailing Stop:
🎯 Purpose:
→ Triggers a trailing stop order on the exchange instead of a standard stop market order.
☢️ Caution:
→ The backtesting of this feature on TradingView may not accurately reflect actual strategy performance due to discrepancies between TradingView and exchange mechanisms.
💡 How to Use:
→ Select 'Trailing Stop' in the Strategy Settings.
⚙️ Enable Realistic TP & SL:
🎯 Purpose:
→ Goal is protect the user from unrealistic stop loss and take profit prices in live exchange trading conditions.
→ That feature continuously checks the take profit, stop loss and move stop loss prices to prevent unrealistic values. It changes their values according to (minimum realistic percent %)
💡 How to Use:
→ Select 'Enable Realistic TP & SL' in the Strategy Settings. Write min allowed percents.
█ LIMITER SETTINGS
Limiter Settings provide a range of options to customize the trading strategy. These settings include drawdown limits,contract limit, tradable ratio, for allowing users to tailor their strategy to their risk tolerance and market view.
⚙️ Leverage :
🎯 Purpose:
→ Allows users to apply leverage to their trades.
☢️ Caution:
→ High leverage can significantly increase the risk of liquidation.
→ High leverage and a high stop-loss price may override your fixed stoploss percentage, adjusting the stop-loss to the liquidation price.
💡 How to Use:
→ Set the desired leverage ratio in the Strategy Settings.
⚙️ Drawdown Limit:
🎯 Purpose:
→ Sets a maximum drawdown limit, automatically halting the strategy if this limit is reached, thereby controlling risk.
💡 How to Use:
→ Input the maximum drawdown limit (default: 100, min: 0, max: 100).
⚙️ Contract Limit:
🎯 Purpose:
→ Sets a maximum contract limit, beyond which the compound effect cannot be used. This is important to prevent market manipulation through large-volume orders.
💡 How to Use:
→ Input the maximum contract limit (min: 0).
⚙️ Tradable Ratio:
🎯 Purpose:
→ Sets a tradable ratio, it uses that ratio calculating entry cost for position. Main purpose is cash-out and cash-in according to balance change.
💡 How to Use:
→ Input the tradable ratio percent (default: 98, min: 0.1, max: 100).
█ CASH-OUT SETTINGS
Cash-Out Settings offer a money-saving mechanism that prevents entering positions with the entire balance due to cashed-out funds. It functions with a webhook alerts, but the 'Override Allocation %' option must be enabled.
⚙️ Cash-out Threshold %:
🎯 Purpose:
→ It is cash-out mechanism, it saves money with a target threshold.
💡 How to Use:
→ Input the threshold (min: 0).
⚙️ Cash-out Per Profitable Trades %:
🎯 Purpose:
→ It is cash-out mechanism, it saves money from every trade with a percent like commission.
💡 How to Use:
→ Input save percent% (min: 0).
█ ADAPTIVE VOLATILITY STRATEGY SETTINGS
Advanced Strategy Settings offer sophisticated methods for managing Stop Loss (SL) and Take Profit (TP) using the Average True Range (ATR). These settings are ideal for traders who want to incorporate volatility into their exit strategies.
Features:
⚙️ Enable ATR Stop Loss:
🎯 Purpose:
→ Automatically sets the Stop Loss price using the Average True Range at the time of entry.
💡 How to Use:
→ Activate 'ATR Stop Loss' to have the SL price calculated based on the current ATR.
⛓ Enable ATR Trailing Stop:
→ Dynamically updates the Stop Loss price with each new bar, according to the Average True Range.
→ Activate 'ATR Trailing Stop'.
→ Set the ATR Period to define the number of bars for ATR calculation.
→ Adjust the ATR SL Multiplier to determine the stop loss distance.
→ Modify the ATR TP Multiplier for setting the take profit distance.
⚙️ Enable ATR Take Profit:
🎯 Purpose:
→ Sets the Take Profit price based on the Average True Range at the time of entry.
💡 How to Use:
→ Choose 'ATR Take Profit' for TP price determination using ATR.
⚙️ Enable ATR Limit Entry:
🎯 Purpose:
→ Trade can not open in candle close price. Price should hit target price that based on average true range value.
💡 How to Use:
→ Choose 'ATR Limit Entry' for entry price determination using ATR.
⛓ Enable ATR Limit Entry Trailing Price:
→ Dynamically updates the entry price with each new bar, according to the Average True Range.
→ Activate 'ATR Limit Entry Trailing Price'.
→ Set the ATR Period to define the number of bars for ATR calculation.
→ Adjust the ATR SL Multiplier to determine the stop loss distance.
→ Modify the ATR TP Multiplier for setting the take profit distance.
█ TREND FILTERING SETTINGS
Trend Filtering Settings are designed to align trading strategies with the prevailing market trend, enhancing the precision of trade entries and exits. These settings utilize moving averages for trend analysis and decision-making.
Features:
⚙️ Enable Moving Average Filtering:
🎯 Purpose:
→ Limits trades based on moving average trends, blocking short trades in an uptrend and vice versa.
💡 How to Use:
→ Enable 'Trend Filtering'.
→ Set Fast and Slow MA Lengths for trend analysis.
→ Select the Timeframe for moving averages.
→ Choose the Moving Average Type for trend filtering.
🎯 Note:
→ Be cautious with timeframe selections; lower timeframes than the base may cause inconsistencies.
⛓ Exit on Trend Reversal:
→ Automatically closes a position when a market trend reversal is detected.
→ Turn on 'Exit on Trend Reversal' in the settings.
⛓ Ignore Counter Signals:
→ Ignores counter signals during trending market way.
→ If the trend way is long. All short signals will ignore and vice versa.
⛓ Enable Drawing On Chart:
→ Visually represents the trend filter directly on the chart for easy reference.
→ Activate 'Drawing On Chart' to see the trend filter overlaid on the trading chart.
⚙️ Enable Adx Filtering:
🎯 Purpose:
→ Limits trades based on adx value, blocking trades if trend strength is not enough or vice versa for invert mode.
💡 How to Use:
→ Enable 'Adx Filtering'.
→ Set Smoothing and Lengths for adx trend analysis.
→ Select level barrier for trend strength.
⚙️ Enable Custom Filtering:
🎯 Purpose:
→ Limits trades based on custom sources, blocking trades according to custom trades.
💡 How to Use:
→ Enable 'Custom Filtering'.
→ Select fast source.
→ Select slow source.
→ Enable lag mode.
█ MEAN REVERSION FILTERING SETTINGS
Mean Reversion Filtering Settings are designed to align trading strategies during accumulation market conditions. They set a distance from a line to permit trading. The purpose is to ensure that when the price strays too far from the mean line, it should revert back. In accumulation markets, price movements are generally horizontal. In such situations, mean reversion will operate like a grid, enabling profitable trades with low drawdown. However, when the market structure begins to trend, mean reversion filters may not be as profitable as in accumulation markets. For instance, let's say the price is rising and we are shorting the market until it reaches the mean price line. As the price goes up and the mean also rises, we will end up closing the position at a higher price, rendering the mean reversion system non-profitable. Therefore, consider this filter wisely; greater distances might work better in trending markets.
Features:
⚙️ Enable Kairi Filter:
🎯 Purpose:
→ Blocks trades based on distance percent between price and moving average.
💡 How to Use:
→ Enable 'Kairi Filter'.
→ Set Length and Distance Percent.
⛓ Enable Trend Drawing On Chart:
→ Visually represents the trend filter directly on the chart for easy reference.
→ Enable 'Drawing On Chart' to see the allowed regions overlaid on the trading chart with arrows.
⚙️ Enable VWAP Filter:
🎯 Purpose:
→ Blocks trades based on distance percent between price and volume weighted average price.
💡 How to Use:
→ Enable 'VWAP Filter'.
→ Set Timeframe as minutes and distance as percent.
⛓ Exit on Crossing with VWAP:
→ Automatically closes a position when the closing price of a candle crosses the VWAP.
→ Choose "Enable", 'Exit on Crossing with VWAP' in the settings.
⛓ Enable Drawing On Chart:
→ Visually represents the trend filter directly on the chart for easy reference.
→ Enable 'Drawing On Chart' to see the allowed regions overlaid on the trading chart with arrows.
█ LIQUIDATION FILTER SETTINGS
Liquidation filter compares the volume data of futures and spot markets.
Large differences in volume indicate unexpected market conditions, such as massive trading activities, which may signal liquidations.
Features:
⚙️ Enable Liquidation Filter:
🎯 Purpose:
→ Blocks trades based on extra ordinary volume differences in spot and futures market.
💡 How to Use:
→ Enable 'Liquidation Filter'.
→ Set behavior to react during that market conditions.
→ Set base amount to filter volume. This amount changes according to timeframe, you should find right amounts.
→ Liquidation candle count means, it is sum of liquidated candle count in last 20 bars.If you set 0, it means feature is disabled.
→ Detection, try to select the spot and perpetual symbols automatically, symbol names varies, it do not support all symbols, you should choose manually in that situation.
█ AUTOMATED ALERT SETTINGS
Automated Alert Settings are designed to integrate your TradingView script with webhook alerts. These settings allow for enhanced strategy execution and management.
Features:
Enable Webhook Alerts:
🎯 Purpose:
→ Trigger BUY, SELL, CHANGE_DIRECTION or MOVE_STOP_LOSS .
💡 How to Use:
→ Enable 'Webhook Alerts' in the settings.
→ Enter your Strategy Key.
→ Optionally, activate 'Override Allocation Percentage' to bypass the preset allocation percentage.
☢️ Caution:
→ Overriding the allocation percentage may result in trade entry errors due to misalignment between entry cost and available balance.
Enable Custom Alerts:
🎯 Purpose:
→ User can produce unique messages for different purposes.
💡 How to Use:
→ Enable 'Custom Alerts' in the settings.
→ Enter your message format type.
█ DEBUGGING SETTINGS
Debugging Settings are crucial for users who want to analyze and optimize their strategies. These settings provide tools for visualizing alerts on charts and accessing detailed data outputs.
Features:
⚙️ Enable Alert Plotting:
🎯 Purpose:
→ Allows users to visualize trading alerts directly on the chart, aiding in strategy analysis and refinement.
💡 How to Use:
→ Activate 'Alert Plotting' to draw alerts on the chart.
☢️ Caution:
→ It is recommended to disable this feature when creating actual trading alerts, as it can cause latency in signal processing.
⚙️ Enable Debugger Mode:
🎯 Purpose:
→ Facilitates strategy debugging by providing detailed data output in the TradingView Data Window.
💡 How to Use:
→ Turn on 'Debugger Mode' to access real-time data and metrics relevant to your strategy.
⚙️ Enable Table:
🎯 Purpose:
→ Facilitates strategy debugging by providing detailed data output in the TradingView Table on chart.
💡 How to Use:
→ Turn on 'Table' to access last closed candle data and metrics relevant to your strategy.
█ ADDITIONAL SETTINGS
⚙️ Enable Bar Magnifier
⚙️ Enable Using standard OHLC

Crypto Punk [Bot] (Zeiierman)█ Overview
The Crypto Punk (Zeiierman) is a trading strategy designed for the dynamic and volatile cryptocurrency market. It utilizes algorithms that incorporate price action analysis and principles inspired by Geometric Brownian Motion (GBM). The bot's core functionality revolves around analyzing differences in high and low prices over various timeframes, estimating drift (trend) and volatility, and applying this information to generate trading signals.
█ How to use the Crypto Punk Bot
Utilize the Crypto Punk Bot as a technical analysis tool to enhance your trading strategy. The signals generated by the bot can serve as a confirmation of your existing approach to entering and exiting the market. Additionally, the backtest report provided by the bot is a valuable resource for identifying the optimal settings for the specific market and timeframe you are trading in.
One method is to use the bot's signals to confirm entry points around key support and resistance levels.
█ Key Features
Let's explain how the core features work in the strategy.
⚪ Strategy Filter
The strategy filter plays a vital role in the entries and exits. By setting this filter, the bot can identify higher or lower price points at which to execute trades. Opting for higher values will make the bot target more long-term extreme points, resulting in fewer but potentially more significant signals. Conversely, lower values focus on short-term extreme points, offering more frequent signals focusing on immediate market movements.
How is it calculated?
This filter identifies significant price points within a specified dynamic range by applying linear regression to the absolute deviation of the range, smoothing out fluctuations, and determining the trend direction. The algorithm then normalizes the data and searches for extreme points.
⚪ External AI filter
The external AI filter allows traders to incorporate two external sources as signal filters. This feature is particularly useful for refining their signal accuracy with additional data inputs.
External sources can include any indicator applied to your TradingView chart that produces a plot as an output, such as a moving average, RSI, supertrend, MACD, etc. Traders can use these indicators of their choice to set filters for screening signals within the strategy.
This approach offers traders increased flexibility to select filters that align with their trading style. For instance, one trader might prefer to take trades when the price is above a moving average, while another might opt for trades when the MACD is below the MACD signal line. These external filters enable traders to choose options that best fit their trading strategies. See the example below. Note that the input sources for the External AI filter can be any indicator applied to the chart, and the input source per se does not make this strategy unique. The AI filter takes the selected input source and applies our function to it. So, if a trader selects RSI as an input filter, RSI is not unique, but how the source is computed within the AI functions is.
How is it calculated?
Once the external filters are selected and enabled within the settings panel, our AI function is applied to enhance the filter's ability to execute trades, even when the set conditions of the filter are not met. For instance, if a trader wants to take trades only when the price is above a moving average, the AI filter can actually execute trades even if the price is below the moving average.
The filter works by combining k-nearest Neighbors (KNN) with Geometric Brownian Motion (GBM) involves first using GBM to model the historical price trends of an asset, identifying patterns of drift and volatility. KNN is then applied to compare the current market conditions with historical instances, identifying the closest matches based on similar market behaviors. By examining the drift values of these nearest historical neighbors, KNN predicts the current trend's direction.
The AI adaptability value is a setting that determines how flexible the AI algorithm is when applying the external AI filter. Setting the adaptability to 10 indicates minimal adaptability, suggesting that the bot will strictly adhere to the set filter criteria. On the other hand, a higher adaptability value grants the algorithm more leeway to "think outside the box," allowing it to consider signals that may not strictly meet the filter criteria but are deemed viable trading opportunities by the AI.
█ Examples
In this example, the RSI is used to filter out signals when the RSI is below the smoothing line, indicating that prices are declining.
Note that the external filter is specifically designed to work with either 'LONG ONLY' or 'SHORT ONLY' modes; it does not apply when the bot is set to trade on 'BOTH' modes. For 'LONG ONLY' positions, the filter criteria are met when source 1 is greater than source 2 (source 1 >= source 2). Conversely, for 'SHORT ONLY' positions, the filter criteria require source 1 to be less than source 2 (source 1 <= source 2).
Examples of Filter Usage:
Long Signals: To receive long signals when the closing price is higher than a moving average, set Source 1 to the 'close' price and Source 2 to a moving average value. This setup ensures that signals are generated only when the closing price exceeds the moving average, indicating a potential upward trend.
█ Settings
⚪ Set Timeframe
Choosing the correct entry and exit timeframes is crucial for the bot's performance. The general guideline is to select a timeframe that is higher than the one currently displayed on the trading chart but still relatively close in duration. For instance, if trading on a 1-minute chart, setting the bot's Timeframe to 5 minutes is advisable.
⚪ Entry
Traders have the flexibility to configure the bot according to their trading strategy, allowing them to choose whether the bot should engage in long positions only, short positions only or both. This customization ensures that the bot aligns with the trader's market outlook and risk tolerance.
⚪ Pyramiding
Pyramiding functionality is available to enhance the bot's trading strategy. If the current position experiences a drawdown by a specified number of points, the bot is programmed to add new positions to the existing one, potentially capitalizing on lower prices to average down the entry cost. To utilize this feature, access the settings panel, navigate to 'Properties,' and look for 'Pyramiding' to specify the number of times the bot can re-enter the market (e.g., setting it to 2 allows for two additional entries).
⚪ Risk Management
The bot incorporates several risk management methods, including a regular stop loss, trailing stop, and risk-reward-based stop loss and exit strategies. These features assist traders in managing their risk.
Stop Loss
Trailing Stop
⚪ Trading on specific days
This feature allows trading on specific days by setting which days of the week the bot can execute trades on. It enables traders to tailor their strategies according to market behavior on particular days.
⚪ Alerts
Alerts can be set for entry, exit, and risk management. This feature allows traders to automate their trading strategy, ensuring timely actions are taken according to predefined criteria.
█ How is Crypto Punk calculated?
The Crypto Punk Bot is a trading bot that utilizes a combination of price action analysis and elements inspired by Geometric Brownian Motion (GBM) to generate buy and sell signals for cryptocurrencies. The bot focuses on analyzing the difference between high and low prices over various timeframes, alongside estimates of drift (trend) and volatility derived from GBM principles.
Timeframe Analysis for Price Action
The bot examines multiple timeframes (e.g., daily, weekly) to identify the range between the highest and lowest prices within each period. This range analysis helps in understanding market volatility and the potential for significant price movements. The algorithm calculates the trading range by applying maximum and minimum functions to the set of prices over your selected timeframe. It then subtracts these values to determine the range's width. This method offers a quantitative measure of the asset's price volatility for the specified period.
Estimating Drift (Trend)
The bot estimates the drift component, which reflects the underlying trend or expected return of the cryptocurrency. The algorithm does this by estimating the drift (trend) using Geometric Brownian Motion (GBM), which involves determining an asset's average rate of return over time, reflecting the asset's expected direction of movement.
Estimating Volatility
Volatility is estimated by calculating the standard deviation of the logarithmic returns of the cryptocurrency's price over the same timeframe used for the drift calculation. Geometric Brownian Motion (GBM) involves measuring the extent of variation or dispersion in the returns of an asset over time. In the context of GBM, volatility quantifies the degree to which the price of an asset is expected to fluctuate around its drift.
Combining Drift and Volatility for Signal Generation
The bot uses the calculated drift and volatility to understand the current market conditions. A higher drift coupled with manageable volatility may indicate a strong upward trend, suggesting a potential buy signal. Conversely, a low or negative drift with increasing volatility might suggest a weakening market, triggering a sell signal.
█ Strategy Properties
This script backtest is done on the 1 hour chart Bitcoin, using the following backtesting properties:
Balance (default): 10 000 (default base currency)
Order Size: 10% of the equity
Commission: 0.05 %
Slippage: 500 ticks
Stop Loss: Risk Reward set to 1
These parameters are set to provide an accurate representation of the backtesting environment. It's important to recognize that default settings may vary for several reasons outlined below:
Order Size: The standard is set at one contract to facilitate compatibility with a wide range of instruments, including futures.
Commission: This fee is subject to fluctuation based on the specific market and financial instrument, and as such, there isn't a standard rate that will consistently yield accurate outcomes.
We advise users to customize the Script Properties in the strategy settings to match their personal trading accounts and preferred platforms. This adjustment is crucial for obtaining practical insights from the deployed strategies.
-----------------
Disclaimer
The information contained in my Scripts/Indicators/Ideas/Algos/Systems does not constitute financial advice or a solicitation to buy or sell any securities of any type. I will not accept liability for any loss or damage, including without limitation any loss of profit, which may arise directly or indirectly from the use of or reliance on such information.
All investments involve risk, and the past performance of a security, industry, sector, market, financial product, trading strategy, backtest, or individual's trading does not guarantee future results or returns. Investors are fully responsible for any investment decisions they make. Such decisions should be based solely on an evaluation of their financial circumstances, investment objectives, risk tolerance, and liquidity needs.
My Scripts/Indicators/Ideas/Algos/Systems are only for educational purposes!
Платный скрипт

CryptoGraph Dynamic DCAA system to backtest and automate comprehensive trading strategies
═════════════════════════════════════════════════════════════════════════
🟣 Supporting Your Trades
CryptoGraph Dynamic DCA serves as a comprehensive tool on TradingView, designed to refine your approach to cryptocurrency trading. It utilises dynamic dollar-cost averaging (DCA), based on external indicator sources, to provide structured market entry and exit strategies. Suitable for both short-term trading and long-term portfolio management, CryptoGraph Dynamic DCA can offer a methodical way to support your trading decisions.
The tool offers an intuitive interface with inputs for strategy customisation, visualised preferences, and bot alert configurations. It can assist traders seeking precision, adaptability, and control in their trading activities. In the example on the chart above, we use the CryptoGraph Entry Builder (part of CryptoGraph Dynamic DCA package) as an external source for our initial entry (base order) and our safety orders, as well as an external source for our second take profit, which can be configured to be signal based.
🟣 Features
External Entry/Exit sources: The strategy is designed to assist with accurate market entries and exits by utilising signals from external indicators. It offers the flexibility to tailor your trading approach, providing an opportunity to leverage the analytical capabilities of various indicators available on TradingView.
Strategic Direction Control: Configure your strategy to go long, short, or both, adapting to market trends and your trading style.
Leverage Customisation: Tailor your leverage settings for isolated or cross margin to align with your risk tolerance, a liquidation estimation level is plotted on the chart, based on your input settings.
Diverse Entry Points: Utilise base orders and safety orders to diversify your entry points, reducing risk and enhancing potential returns.
Tailored Order Size: Fine-tune your order sizes using margin percentages or fixed contract sizes to fit your strategy’s requirements.
Profit Taking & Loss Prevention: Set take profit levels and stop losses with percentage or ATR-based parameters to secure profits and minimise losses. Options for moving the stop loss to entry after Take Profit 1, with an adjustable buffer, give you control over your risk management.
Max Safety Orders Count: Determine the maximum number of safety orders to manage risk effectively.
Price Deviation for DCA Orders: Specify the minimum price deviation percentage to trigger DCA orders, ensuring strategic order placement.
DCA Size Method: Choose from scaling or fixed-size DCA orders to align with your capital allocation strategy.
Visualisation & Alerts: Analyse your strategy’s performance with a backtest results table and configure bot alerts for automated trading. Auto configuration methods are integrated for multiple automated trading platforms.
🟣 Features Impression
🟣 Usage Guide
1. Strategy Configuration:
Select the appropriate cryptocurrency pair and exchange that corresponds to your trading preferences.
Choose your desired chart timeframe to align with your trading strategy’s temporal scope.
Ensure that you’re utilising the regular candle type for consistent and reliable data interpretation.
Pick an external entry source to trigger your trades based on predefined indicators or conditions.
Determine your take profit and stop loss levels to manage risks and secure earnings effectively.
Configure your DCA (Dollar-Cost Averaging) settings, including safety orders and the scaling method, to enhance entry points and manage investment distribution.
Always consult the tooltips next to each strategy input, to better understand their functions.
2. Backtest and Analysis:
Run backtests with your configured parameters to assess the strategy’s potential performance.
Review the backtest results and statistics tables to understand the strategy’s effectiveness, risk profile, and profitability.
3. Automated Trading Platform Integration:
Connect the strategy to a compatible automated trading platform to enable real-time execution of trades.
Within the trading platform, ensure the proper API setup of the bot’s configuration to align with the signals from the tool.
4. Alert Configuration in TradingView:
Set up the alert conditions in the TradingView tool to match your strategy triggers for entry, exit, take profit, and stop loss.
Configure the connection parameters within the tool to communicate effectively with your chosen automated trading platform
Activate the alerts, ensuring they are set to trigger actions such as order placement, adjustments, or closures as per your strategy’s logic.
5. Capital Management:
Confirm that your initial capital and order size are logically set, keeping in mind that the sum of all deals, especially when using pyramiding with safety orders, should not exceed your initial capital to avoid overexposure.
🟣 Trade Example
A clear example of a trade. Base order entry, safety order 1 fills, take profit 1 hits at 1%, the remainder of the position runs until the exit signal fires.
🟣 Warning
This tool has been developed to support your trading analysis, yet it’s important to acknowledge the inherent risks associated with trading. It is advisable to perform thorough research, assess your risk tolerance, and utilise this tool as one element of an overall trading strategy. Ensure that you only trade with capital that you are prepared to risk. In addition, due to the complexity of the tool, bugs may be found. Please alert us whenever you think you have found a bug in the system.
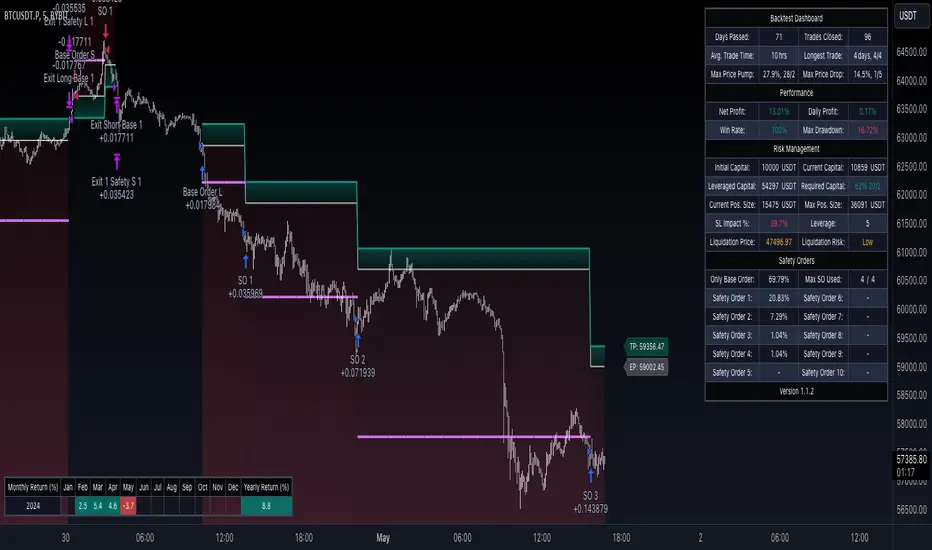
FluxFilter Trend Strategy [BITsPIP]Hello fellow traders, I'm excited to share with you the FluxFilter Trend Strategy, a trading approach I've developed for those interested in exploring trend-following strategies. My goal was to create something straightforward and accessible, so traders looking to refine their portfolios can easily integrate its features. By the end of this guide, I hope you'll have a solid grasp of how the FluxFilter Trend Strategy functions, appreciate its benefits, understand its potential drawbacks, and see how it might fit into various trading contexts.
I) Overview
The FluxFilter Trend Strategy is tailored to align with the market's long-term trend. It examines the price data from the previous year to gauge the market's overall trajectory by employing moving averages. Subsequently, within shorter timeframes, the strategy utilizes a combination of modified Supertrend, Hull Suite, and various trend-following and filtering techniques to generate buy or sell signals. Although its advanced take profit and stop loss mechanisms might initially present a learning curve, they are integral to the strategy's effectiveness. They are designed to secure gains by capturing prevailing trends and mitigating the impact of false reversal signals.
II) Deep Backtesting
Deep backtesting stands as a cornerstone in the development of trading strategies, offering a robust method for traders to assess the performance of their strategy against historical data. This process yields a retrospective view, illustrating how the strategy might have navigated through past market fluctuations, thereby shedding light on its potential robustness and areas for refinement. However, it's crucial to acknowledge that a strategy's performance can be influenced by a myriad of factors including market dynamics, the chosen timeframe, and the inherent attributes of the traded asset. Consequently, it's advisable to conduct thorough backtesting under various conditions to ascertain the strategy's reliability before applying it to actual trading scenarios.
III) Benefits
A primary advantage of the FluxFilter Trend Strategy is its proficiency in discerning genuine market trends from mere price fluctuations, thereby avoiding premature or uncertain trades. Unlike approaches that take high risks on speculative trades, this strategy prioritizes a high degree of confidence in the direction of the trade. It meticulously waits for a clear confirmation of the market trend. Once this certainty is established, the strategy promptly generates trade signals, ensuring that traders are positioned to capitalize on optimal market entry points without delay. This approach not only enhances the potential for profit but also aligns with a disciplined and methodical trading ethos.
IV) Applications
FluxFilter Trend Strategy can be applied across various timeframes, with a particular efficacy in those under 15 minutes. Its adaptable framework means it can be customized to cater to a variety of asset classes, encompassing stocks, commodities, forex, and cryptocurrencies. Initially, the strategy was specifically calibrated for low-volatile cryptocurrencies, as reflected in the default settings for stop loss and take profit values. It's important to recognize that the unique volatility and trend patterns of your selected market necessitate careful adjustments to these parameters. This fine-tuning of profit targets and stop loss thresholds is crucial for aligning the strategy with the specific dynamics of your chosen market, which I will discuss shortly.
V) Strategy's Logic
1. Trend Identification: My conviction lies in the power of trend trading to yield long-term gains. Central to the FluxFilter Trend Strategy is the Hull Suite indicator, a tool developed by InSilico, serving as one of the confirmation indicators. This indicator acts as a compass for trend direction; a price residing above the Hull Suite line signals an uptrend, potentially marking an entry point for a buy position or confirming it. In contrast, a price positioned below this line suggests a downtrend, potentially indicating a strategic moment to sell or confirming the sell.
2. Noise Reduction: The financial markets are known for their 'noise'—short-lived price movements that can obscure the true market direction. The FluxFilter Trend Strategy is designed to sift through this noise, thereby facilitating more lucid and informed trading decisions. It employs a set of straightforward yet innovative techniques to single out significant misleading fluctuations. This is achieved by analyzing recent bars to spot bars with unusually large bodies, which often represent misleading market noise.
3. Risk Management: A key facet of the strategy is its emphasis on pragmatic risk management. Traders are empowered to establish practical stop-loss and take-profit levels, tailoring these crucial parameters to the specific market they are engaging in. This customization is instrumental in optimizing long-term profitability, ensuring that the strategy adapts fluidly to the unique characteristics and volatility patterns of different trading environments.
VI) Strategy's Input Settings and Default Values
1. Modified Supertrend
i. Factor: Serving as a multiplier in the Average True Range (ATR) calculation, this parameter adjusts the distance of the Supertrend line relative to the price chart. Elevating the factor value widens the gap between the Supertrend line and price, offering a more conservative stance. On the flip side, diminishing the factor value pulls the Supertrend line closer to the price action, heightening its sensitivity. While the preset value is 1, you have the flexibility to modify this to suit your trading approach.
ii. ATR Length: This defines the count of bars that are incorporated into the ATR computation, directly influencing the Supertrend's adaptability to market changes. With a default setting of 30 bars, it strikes a balance, smoothing over short-term fluctuations while maintaining a meaningful sensitivity to market trends. Adjusting this parameter allows you to tailor the indicator's responsiveness to suit your trading strategy, considering the volatility and behavioral patterns of the asset you are trading.
2. Hull Suite
i. Hull Suite Length: Designed for capturing long-term trends, the Hull Suite Length is configured at 1000. Functioning comparably to moving averages, the Hull Suite features upper and lower bands, though these are not employed in our current strategy.
ii. Length Multiplier: It's advisable to maintain a minimal value for the Length Multiplier, prioritizing the optimization of the Hull Suite Length. Presently, it is set to 1.
3. Filtering Indicators
i. Fluctuation Filtering Percentage: It's advisable to set this parameter to ten times the size of the average bar in your specific market, as this helps effectively mitigate the impact of market fluctuations. While the initial default is 0.4(%), based on the BTCUSDT market, it's crucial to adjust this figure to align with the characteristics of different assets or markets you're trading in.
ii. Fluctuation Filtering Bars: This parameter designates the count of preceding bars to consider when assessing market fluctuations. It's fully customizable, allowing you to tailor it based on your market insights. The preset default is 3, a balance chosen to minimize susceptibility to potentially misleading signals.
iii. Trend Confirmation Percentage: This metric is pivotal for verifying the viability of a trend post-entry. If the trade doesn't achieve this percentage in profit, it indicates a deviation from the expected trend. Under such circumstances, it may be prudent to exit the trade prematurely rather than awaiting the stop-loss trigger. It's recommended to set this parameter at half the size of the average candle body for the market you're analyzing. The initial default is set at 0.2(%).
4. StopLoss and TakeProfit
i. StopLoss and TakeProfit Settings: Two distinct approaches are available. Semi-Automatic StopLoss/TakeProfit Setting and Manual StopLoss/TakeProfit Setting. The Semi-Automatic mode streamlines the process by allowing you to input values for a 5-minute timeframe, subsequently auto-adjusting these values across various timeframes, both lower and higher. Conversely, the Manual mode offers full control, enabling you to meticulously define TakeProfit values for each individual timeframe.
ii. TakeProfit Threshold # and TakeProfit Value #: Imagine this mechanism as an ascending staircase. Each step represents a range, with the lower boundary (TakeProfit Value) designed to close the trade upon being reached, and the upper boundary (TakeProfit Threshold) upon being hit, propelling the trade to the next level, and forming a new range. This stair-stepping approach enhances risk management and has the potential to increase profitability. The pre-set configurations are tailored for volatile markets, such as BTCUSDT. It's advisable to devote time to tailoring these settings to your specific market, aiming to achieve optimal results based on backtesting.
iii. StopLoss Value: In line with its name, this value marks the limit of loss you're prepared to accept should the market trend go against your expectations. It's crucial to note that once your asset reaches the first TakeProfit range, the initial StopLoss value becomes obsolete, supplanted by the first TakeProfit Value. The default StopLoss value is pegged at 1.8(%), a figure worth considering in your trading strategy.
VII) Entry Conditions
The principal element that triggers the signal is the Modified Supertrend. Additional indicators serve as confirmatory tools. Nonetheless, to refine your strategy effectively, it's crucial to fine-tune the parameters. This involves adjusting input variables such as take profit levels, threshold parameters, and the filtering values discussed previously.
VIII) Exit Conditions
The strategy stipulates exit conditions primarily governed by stop loss and take profit parameters. On infrequent occasions, if the trend lacks confirmation post-entry, the strategy mandates an exit upon the issuance of a reverse signal (whether confirmed or unconfirmed) by the strategy itself.
Good Luck!!

BitBell - EMA PullBack RSI EXO
🔵 Introduction
Version 1.1
This is a Pine 5 trend following strategy. It has a four strategy with several alerts and signals. The design intent is to produce a commercial grade signal generator that can be adapted to any symbol in cryptocurrency and only 1H Chart. Ideally, the script is reliable enough to be the basis of an automated trading system web-hooked to a server with API access to crypto brokerages. The strategy can be run in three different modes: long, short and bidirectional.
As a trend following strategy, the behavior of the script is to buy on strength and sell on weakness. As such the trade orders maintain its directional bias according to price pressure. What you will see on the chart is long positions on the left side of the mountain and short on the right. Long and short positions are not intermingled as long as there exists a detectable trend. This is extremely beneficial feature in long running bull or bear markets. The script uses multiple setups to avoid the situation where you got in on the trend, took a small profit but couldn’t get back in because the logic is waiting for a pullback or some other intricate condition.
Deep draw-downs are a characteristic of trend following systems and this system is no different. However, this script makes use of the TradingView pyramid feature with three NPUs to find better place and even you can change drop percentage in settings for another trigger, accessible from the properties tab.
When trend market break it will stop the trade and usually it takes 2-4 percent loss but don't worry it has prefect money management and you can use it for Futures market and even Spot market.
🔵 Design
This script uses twelve indicators on two time frames. The chart (primary) interval and one higher time frame which is based on the primary. The higher time frame identifies the trend for which the primary will trade. I’ve tried to keep the higher time frame around five times greater than the primary. The original trading algorithms are a port from a much larger program on another trading platform. I’ve converted some of the statistical functions to use standard indicators available on TradingView. The setups make heavy use of the Hull Moving Average in conjunction with EMAs that form the Bill Williams Alligator as described in his book “New Trading Dimensions” Chapter 3. Lag between the Hull and the EMAs form the basis of the entry and exit points. The alligator itself is used to identify the trend main body.
The entire script is around 740 lines of Pine code which is the maximum incidental size given the TradingView limits: local scopes, run-time duration and compile time. I’ve been working on this script for over a year and have tested it on various instruments stock crypto. It performs well on higher liquidity markets that have at least a year of historical data. Though it can be configured to work on any interval between 15 minutes and 4 hour, trend trading is generally a longer term paradigm. For day trading the 10 to 15 minute interval will allow you to catch momentum breakouts. For intraweek trades 30 minutes to 1 hour should give you a trade every other a day.
Inputs to the script use cone centric measurements in effort to avoid exposing adjustments to the various internal indicators. The goal was to keep the inputs relevant to the actual trade entry and exit locations as opposed to a series of MA input values and the like. As a result the strategy exposes over 12 inputs grouped into long or short sections. Inputs are available for the usual minimum profit and stop-loss as well as trade, modes, presets, reports and lots of calibrations. The inputs are numerous, I’m aware. Unfortunately, at this time, TradingView does not offer any other method to get data in the script. The usual initialization files such as cnf, cfg, ini, json and xml files are currently unsupported.
Example configurations for various instruments along with a detailed PDF user manual is available.
it has no repaint i guaranty this, and you can have 10 days free with comment and check it by yourself
One issue that comes up when comparing the strategy with the study is that the strategy trades show on the chart one bar later than the study. This problem is due to the fact that “strategy.entry()” and “strategy_close()” do not execute on the same bar called. The study, on the other hand, has no such limitation since there are no position routines. However, alerts that are subsequently fired off when triggered in the study are dispatched from the TradingView servers one bar later from the study plot. Therefore the alert you actually receive on your cell phone matches the strategy plot but is one bar later than the study plot.
Please be aware that the data source matters. Cryptocurrency has no central tick repository so each exchange supplies TradingView its feed. Even though it is the same symbol the quality of the data and subsequently the bars that are supplied to the chart varies with the exchange. This script will absolutely produce different results on different data feeds of the same symbol. Be sure to backtest this script on the same data you intend to receive alerts for. Any example settings I share with you will always have the exchange name used to generate the test results.
🟡 Usage
It sends long and short signals with pyramid orders of up to 3, meaning that the strategy can trigger up to 3 orders in the same direction. Good risk and money management.
It's important to note that the strategy combines 2 systems working together (Long and LongX). Let’s describe the specific features of this strategy.
🔵 If Findes Supports And Ressitances And Trend Lines As Best As It Can, And You Can See:
🟢 Frist Simple Long Condition = It Look At The Trend Wait For RSI Cross 30 Number Then Ckeck Risk To Reward, check something else such as divergence:
🟢 Another Long Example:
🔴 Frist Simple Short Condition = It Look At The Trend Wait For RSI Cross 70 Number Then Ckeck Risk To Reward, check something else such as divergence:
🔴 Another Short Example:
The following steps provide a very brief set of instructions that will get you started but will most certainly not produce the best backtest. A trading system that you are willing to risk your hard earned capital will require a well crafted configuration that involves time, expertise and clearly defined goals. As previously mentioned, I have several example configs that I use for my own trading that I can share with you along with a PDF which describes each input in detail. To get hands on experience in setting up your own symbol from scratch please follow the steps below.
The input dialog box contains over 12 inputs, There are four options must to be configured: Choose Target, side, Choose Settings, Money Management,and settings that apply to both. The following steps address these four main options only.
Money Management System For Leverage 10:
Bot Finds Last Lower Low And Calculate Distance From Entry Price, Then Cross It To Initial Capitan And Cross Leverage =>
Position_Size = (((1.64) * (initial Capital)) * (leverage))
And Check Dominances Too For Getting Best Money Management Result
🔵 Settings
* Side, You Can Set Long Or Short Or Both.
* Choose Target, You Can Set One Target Or All Targets.
* Money Management, You Can ON Or OFF It, With OFF You Can USE It For SPOT Trades.
* Choose Settings, In This Field You Can Set Mathematical Optimization, Ddepends On Which Pair You USE.
* Clear With Daily PullBack?, With This Check Box You Can Clear Signals With Daily PullBack.
* Long X, You Can Set Long Leverage.
* Short X, You Can Set Short Leverage.
* Second Order X, You Can Set Pyramiding Leverage.
* Target Long, You Can Set Percent For Long Target.
* Target Short, You Can Set Percent For Short Target.
* Short Martin Percent, You Can Set Short Martingale Percent.
* Long Martin Percent, You Can Set Long Martingale Percent.
🟡 Pyraming 3
🟡 Commission Is 0.065 %
🟡 Slippage Is 10 ticks
🔴Only Use For 1 Hour Chart
🔴 CONCLUSION
We believe that success lies in the association of the user with the indicator, opposed to many traders who have the perspective that the indicator itself can make them become profitable. The reality is much more complicated than that.
The aim is to provide an indicator comprehensive, customizable, and intuitive enough that any trader can be led to understand this truth and develop an actionable perspective of technical indicators as support tools for decision making.
🔴 RISK DISCLAIMER
Trading is risky & most day traders lose money. All content, tools, scripts, articles, & education provided by BitBell are purely for informational & educational purposes only. Past performance does not guarantee future results.

The Flash-Strategy with Minervini Stage Analysis QualifierThe Flash-Strategy (Momentum-RSI, EMA-crossover, ATR) with Minervini Stage Analysis Qualifier
Introduction
Welcome to a comprehensive guide on a cutting-edge trading strategy I've developed, designed for the modern trader seeking an edge in today's dynamic markets. This strategy, which I've honed through my years of experience in the trading arena, stands out for its unique blend of technical analysis and market intuition, tailored specifically for use on the TradingView platform.
As a trader with a deep passion for the financial markets, my journey began several years ago, driven by a relentless pursuit of a trading methodology that is both effective and adaptable. My background in trading spans various market conditions and asset classes, providing me with a rich tapestry of experiences from which to draw. This strategy is the culmination of that journey, embodying the lessons learned and insights gained along the way.
The cornerstone of this strategy lies in its ability to generate precise long signals in a Stage 2 uptrend and equally accurate short signals in a Stage 4 downtrend. This approach is rooted in the principles of trend following and momentum trading, harnessing the power of key indicators such as the Momentum-RSI, EMA Crossover, and Average True Range (ATR). What sets this strategy apart is its meticulous design, which allows it to adapt to the ever-changing market conditions, providing traders with a robust tool for navigating both bullish and bearish scenarios.
This strategy was born out of a desire to create a trading system that is not only highly effective in identifying potential trade setups but also straightforward enough to be implemented by traders of varying skill levels. It's a reflection of my belief that successful trading hinges on clarity, precision, and disciplined execution. Whether you are a seasoned trader or just beginning your journey, this guide aims to provide you with a comprehensive understanding of how to harness the full potential of this strategy in your trading endeavors.
In the following sections, we will delve deeper into the mechanics of the strategy, its implementation, and how to make the most out of its features. Join me as we explore the nuances of a strategy that is designed to elevate your trading to the next level.
Stage-Specific Signal Generation
A distinctive feature of this trading strategy is its focus on generating long signals exclusively during Stage 2 uptrends and short signals during Stage 4 downtrends. This approach is based on the widely recognized market cycle theory, which divides the market into four stages: Stage 1 (accumulation), Stage 2 (uptrend), Stage 3 (distribution), and Stage 4 (downtrend). By aligning the signal generation with these specific stages, the strategy aims to capitalize on the most dynamic and clear-cut market movements, thereby enhancing the potential for profitable trades.
1. Long Signals in Stage 2 Uptrends
• Characteristics of Stage 2: Stage 2 is characterized by a strong uptrend, where prices are consistently rising. This stage typically follows a period of accumulation (Stage 1) and is marked by increased investor interest and bullish sentiment in the market.
• Criteria for Long Signal Generation: Long signals are generated during this stage when the technical indicators align with the characteristics of a Stage 2 uptrend.
• Rationale for Stage-Specific Signals: By focusing on Stage 2 for long trades, the strategy seeks to enter positions during the phase of strong upward momentum, thus riding the wave of rising prices and investor optimism. This stage-specific approach minimizes exposure to less predictable market phases, like the consolidation in Stage 1 or the indecision in Stage 3.
2. Short Signals in Stage 4 Downtrends
• Characteristics of Stage 4: Stage 4 is identified by a pronounced downtrend, with declining prices indicating prevailing bearish sentiment. This stage typically follows the distribution phase (Stage 3) and is characterized by increasing selling pressure.
• Criteria for Short Signal Generation: Short signals are generated in this stage when the indicators reflect a strong bearish trend.
• Rationale for Stage-Specific Signals: Targeting Stage 4 for shorting capitalizes on the market's downward momentum. This tactic aligns with the natural market cycle, allowing traders to exploit the downward price movements effectively. By doing so, the strategy avoids the potential pitfalls of shorting during the early or late stages of the market cycle, where trends are less defined and more susceptible to reversals.
In conclusion, the strategy’s emphasis on stage-specific signal generation is a testament to its sophisticated understanding of market dynamics. By tailoring the long and short signals to Stages 2 and 4, respectively, it leverages the most compelling phases of the market cycle, offering traders a clear and structured approach to aligning their trades with dominant market trends.
Strategy Overview
At the heart of this trading strategy is a philosophy centered around capturing market momentum and trend efficiency. The core objective is to identify and capitalize on clear uptrends and downtrends, thereby allowing traders to position themselves in sync with the market's prevailing direction. This approach is grounded in the belief that aligning trades with these dominant market forces can lead to more consistent and profitable outcomes.
The strategy is built on three foundational components, each playing a critical role in the decision-making process:
1. Momentum-RSI (Relative Strength Index): The Momentum-RSI is a pivotal element of this strategy. It's an enhanced version of the traditional RSI, fine-tuned to better capture the strength and velocity of market trends. By measuring the speed and change of price movements, the Momentum-RSI provides invaluable insights into whether a market is potentially overbought or oversold, suggesting possible entry and exit points. This indicator is especially effective in filtering out noise and focusing on substantial market moves.
2. EMA (Exponential Moving Average) Crossover: The EMA Crossover is a crucial component for trend identification. This strategy employs two EMAs with different timeframes to determine the market trend. When the shorter-term EMA crosses above the longer-term EMA, it signals an emerging uptrend, suggesting a potential long entry. Conversely, a crossover below indicates a possible downtrend, hinting at a short entry opportunity. This simple yet powerful tool is key in confirming trend directions and timing market entries.
3. ATR (Average True Range): The ATR is instrumental in assessing market volatility. This indicator helps in understanding the average range of price movements over a given period, thus providing a sense of how much a market might move on a typical day. In this strategy, the ATR is used to adjust stop-loss levels and to gauge the potential risk and reward of trades. It allows for more informed decisions by aligning trade management techniques with the current volatility conditions.
The synergy of these three components – the Momentum-RSI, EMA Crossover, and ATR – creates a robust framework for this trading strategy. By combining momentum analysis, trend identification, and volatility assessment, the strategy offers a comprehensive approach to navigating the markets. Whether it's capturing a strong trend in its early stages or identifying a potential reversal, this strategy aims to provide traders with the tools and insights needed to make well-informed, strategically sound trading decisions.
Detailed Component Analysis
The efficacy of this trading strategy hinges on the synergistic functioning of its three key components: the Momentum-RSI, EMA Crossover, and Average True Range (ATR). Each component brings a unique perspective to the strategy, contributing to a well-rounded approach to market analysis.
1. Momentum-RSI (Relative Strength Index)
• Definition and Function: The Momentum-RSI is a modified version of the classic Relative Strength Index. While the traditional RSI measures the velocity and magnitude of directional price movements, the Momentum-RSI amplifies aspects that reflect trend strength and momentum.
• Significance in Identifying Trend Strength: This indicator excels in identifying the strength behind a market's move. A high Momentum-RSI value typically indicates strong bullish momentum, suggesting the potential continuation of an uptrend. Conversely, a low Momentum-RSI value signals strong bearish momentum, possibly indicative of an ongoing downtrend.
• Application in Strategy: In this strategy, the Momentum-RSI is used to gauge the underlying strength of market trends. It helps in filtering out minor fluctuations and focusing on significant movements, providing a clearer picture of the market's true momentum.
2. EMA (Exponential Moving Average) Crossover
• Definition and Function: The EMA Crossover component utilizes two exponential moving averages of different timeframes. Unlike simple moving averages, EMAs give more weight to recent prices, making them more responsive to new information.
• Contribution to Market Direction: The interaction between the short-term and long-term EMAs is key to determining market direction. A crossover of the shorter EMA above the longer EMA is an indicator of an emerging uptrend, while a crossover below signals a developing downtrend.
• Application in Strategy: The EMA Crossover serves as a trend confirmation tool. It provides a clear, visual representation of the market's direction, aiding in the decision-making process for entering long or short positions. This component ensures that trades are aligned with the prevailing market trend, a crucial factor for the success of the strategy.
3. ATR (Average True Range)
• Definition and Function: The ATR is an indicator that measures market volatility by calculating the average range between the high and low prices over a specified period.
• Role in Assessing Market Volatility: The ATR provides insights into the typical market movement within a given timeframe, offering a measure of the market's volatility. Higher ATR values indicate increased volatility, while lower values suggest a calmer market environment.
• Application in Strategy: Within this strategy, the ATR is instrumental in tailoring risk management techniques, particularly in setting stop-loss levels. By accounting for the market's volatility, the ATR ensures that stop-loss orders are placed at levels that are neither too tight (risking premature exits) nor too loose (exposing to excessive risk).
In summary, the combination of Momentum-RSI, EMA Crossover, and ATR in this trading strategy provides a comprehensive toolkit for market analysis. The Momentum-RSI identifies the strength of market trends, the EMA Crossover confirms the market direction, and the ATR guides in risk management by assessing volatility. Together, these components form the backbone of a strategy designed to navigate the complexities of the financial markets effectively.
1. Signal Generation Process
• Combining Indicators: The strategy operates by synthesizing signals from the Momentum-RSI, EMA Crossover, and ATR indicators. Each indicator serves a specific purpose: the Momentum-RSI gauges trend momentum, the EMA Crossover identifies the trend direction, and the ATR assesses the market’s volatility.
• Criteria for Signal Validation: For a signal to be considered valid, it must meet specific criteria set by each of the three indicators. This multi-layered approach ensures that signals are not only based on one aspect of market behavior but are a result of a comprehensive analysis.
2. Conditions for Long Positions
• Uptrend Confirmation: A long position signal is generated when the shorter-term EMA crosses above the longer-term EMA, indicating an uptrend.
• Momentum-RSI Alignment: Alongside the EMA crossover, the Momentum-RSI should indicate strong bullish momentum. This is typically represented by the Momentum-RSI being at a high level, confirming the strength of the uptrend.
• ATR Consideration: The ATR is used to fine-tune the entry point and set an appropriate stop-loss level. In a low volatility scenario, as indicated by the ATR, the stop-loss can be set tighter, closer to the entry point.
3. Conditions for Short Positions
• Downtrend Confirmation: Conversely, a short position signal is indicated when the shorter-term EMA crosses below the longer-term EMA, signaling a downtrend.
• Momentum-RSI Confirmation: The Momentum-RSI should reflect strong bearish momentum, usually seen when the Momentum-RSI is at a low level. This confirms the bearish strength of the market.
• ATR Application: The ATR again plays a role in determining the stop-loss level for the short position. Higher volatility, as indicated by a higher ATR, would warrant a wider stop-loss to accommodate larger market swings.
By adhering to these mechanics, the strategy aims to ensure that each trade is entered with a high probability of success, aligning with the market’s current momentum and trend. The integration of these indicators allows for a holistic market analysis, providing traders with clear and actionable signals for both entering and exiting trades.
Customizable Parameters in the Strategy
Flexibility and adaptability are key features of this trading strategy, achieved through a range of customizable parameters. These parameters allow traders to tailor the strategy to their individual trading style, risk tolerance, and specific market conditions. By adjusting these parameters, users can fine-tune the strategy to optimize its performance and align it with their unique trading objectives. Below are the primary parameters that can be customized within the strategy:
1. Momentum-RSI Settings
• Period: The lookback period for the Momentum-RSI can be adjusted. A shorter period makes the indicator more sensitive to recent price changes, while a longer period smoothens the RSI line, offering a broader view of the momentum.
• Overbought/Oversold Thresholds: Users can set their own overbought and oversold levels, which can help in identifying extreme market conditions more precisely according to their trading approach.
2. EMA Crossover Settings
• Timeframes for EMAs: The strategy uses two EMAs with different timeframes. Traders can modify these timeframes, choosing shorter periods for a more responsive approach or longer periods for a more conservative one.
• Source Data: The choice of price data (close, open, high, low) used in calculating the EMAs can be varied depending on the trader’s preference.
3. ATR Settings
• Lookback Period: Adjusting the lookback period for the ATR impacts how the indicator measures volatility. A longer period may provide a more stable but less responsive measure, while a shorter period offers quicker but potentially more erratic readings.
• Multiplier for Stop-Loss Calculation: This parameter allows traders to set how aggressively or conservatively they want their stop-loss to be in relation to the ATR value.
Here are the standard settings:

FlexiMA Variance Tracker - Strategy [presentTrading]█ Introduction and How It Is Different
The FlexiMA Variance Tracker by PresentTrading introduces a novel approach to technical trading strategies. Unlike traditional methods, it calculates deviations between a chosen indicator source (such as price or average) and a moving average with a variable length. This flexibility is achieved through a unique combination of a starting factor and an increment factor, allowing the moving average to adapt dynamically within a specified range. This strategy provides a more responsive and nuanced view of market trends, setting it apart from standard trading methodologies.
BTC 8h L/S
Local
█ Strategy, How It Works: Detailed Explanation
The FlexiMA Variance Tracker, developed by PresentTrading, stands at the forefront of trading strategies, distinguished by its adaptive and multifaceted approach to market analysis. This strategy intricately weaves various technical elements to construct a comprehensive trading logic. Here's an in-depth professional breakdown:
🔶Foundation on Variable-Length Moving Averages:
Central to this strategy is the concept of variable-length Moving Averages (MAs). Unlike traditional MAs with a fixed period, this strategy dynamically adjusts the length of the MA based on a starting factor and an incremental factor. This approach allows the strategy to adapt to market volatility and trend strength more effectively.
Each MA iteration offers a distinct temporal perspective, capturing short-term price movements to long-term trends. This aggregation of various time frames provides a richer and more nuanced market analysis, essential for making informed trading decisions.
🔶Deviation Analysis and Normalization:
The strategy calculates deviations of the price (or the chosen indicator source) from each of these MAs. These deviations are pivotal in identifying the immediate market direction relative to the average trend captured by each MA.
To standardize these deviations for comparability, they undergo a normalization process. The choice of normalization method (Max-Min or Absolute Sum) can significantly influence the interpretation of market conditions, offering distinct insights into price movements and trend strength.
🔹Normalization: Absolute Sum
🔶Composite Oscillator Construction:
A composite oscillator is derived from the median of these normalized deviations. The median serves as a balanced and robust central trend indicator, minimizing the impact of outliers and market noise.
Additionally, the standard deviation of these deviations is computed, providing a measure of market volatility. This volatility indicator is crucial for assessing market risk and can guide traders in setting appropriate stop-loss and take-profit levels.
🔶Integration with SuperTrend Indicator:
The FlexiMA strategy integrates the SuperTrend indicator, renowned for its effectiveness in identifying trend direction and reversals. The SuperTrend's incorporation enhances the strategy's ability to filter out false signals and confirm genuine market trends.
* The SuperTrend Toolkit is made by @QuantiLuxe
This combination of the variable-length MA oscillator with the SuperTrend indicator forms a potent duo, offering traders a dual-confirmation mechanism for trade signals.
🔹Supertrend's incorporation
🔶Strategic Trade Signal Generation:
Trade signals are generated when there is a confluence between the composite oscillator and the SuperTrend indicator. For example, a long position signal might be considered when the oscillator suggests an uptrend, and the SuperTrend flips to bullish.
The strategy's parameters are fully customizable, enabling traders to tailor the signal generation process to their specific trading style, risk tolerance, and market conditions.
█ Usage
To effectively employ the FlexiMA Variance Tracker strategy:
Traders should set their desired trade direction and fine-tune the starting and increment factors according to their market analysis and risk tolerance.
Indicator Length: 5
Indicator Length: 40
The strategy is suitable for a wide range of markets and can be adapted to different time frames, making it a versatile tool for various trading scenarios.
█ Default Settings Impact on Performance: FlexiMA Variance Tracker
1. Trade Direction (Configurable: Long, Short, Both): Determines trade types. 'Long' for buying, 'Short' for selling, 'Both' adapts to market trends.
2. Indicator Source: HLC3: Balances market sentiment by considering high, low, and close, providing comprehensive period analysis.
4. Indicator Length (Default: 10): Baseline for moving averages. Shorter lengths increase responsiveness but add noise, while longer lengths favor trends.
5. Starting and Increment Factor (Default: 1.0): Adjusts MA lengths range. Higher values capture broad market dynamics, lower values focus analysis.
6. Normalization Method (Options: None, Max-Min, Absolute Sum): Standardizes deviations. 'None' for raw deviations, 'Max-Min' for relative scaling, 'Absolute Sum' emphasizes relative strength.
7. SuperTrend Settings (ATR Length: 10, Multiplier: 15.0): Influences indicator sensitivity. Short ATR or high multiplier for short-term, long ATR or low multiplier for long-term trends.
8. Additional Settings (Mesh Style, Color Customization): Enhances visual clarity. Mesh style for detailed deviation view, colors for quick market condition identification.

Dual Regime Strategy (DRS)/Introduction
The Dual Regime Strategy (DRS) is a composite strategy consisting of two signals, both catering to two different market regimes. The stock market experiences periods of high volatility followed by periods of low volatility, a mean reversion strategy performs well during periods of high volatility while a trend following strategy performs well during periods of low volatility. This is the basis for the mean reversion signal and the momentum signal.
/Signals
1. Mean Reversion Signal
Definition: Mean reversion is a financial theory that suggests that asset prices and financial markets tend to fluctuate around a long-term average or mean value. In other words, when the price of an asset moves significantly away from its historical average, it is likely to revert, or move back, towards that average over time.
Concept: Mean reversion assumes that extreme price movements are temporary and that there is an inherent tendency for prices to return to their historical average or equilibrium level. Traders and investors who follow mean reversion strategies often look for overbought or oversold conditions in the market to identify potential trading opportunities. They believe that when prices deviate too far from their mean, there is a higher probability of a reversal.
DRS strategy: The Keltner Channel is a volatility-based technical indicator that consists of three lines: an upper channel, a lower channel, and a middle channel. It is primarily used for mean reversion strategies. The strategy uses a Keltner channel to trigger the mean reversion signals by identifying potential overbought and oversold conditions.
2. Momentum Signal
Definition: Momentum, in the context of financial markets, refers to the tendency of assets to continue moving in the same direction as their recent past price movements. It is based on the idea that assets that have been performing well recently are more likely to continue performing well, and assets that have been performing poorly are more likely to continue performing poorly.
Concept: Momentum traders and investors seek to identify and ride existing price trends. They believe that there is a persistence in price movements, and they aim to capitalize on this persistence by buying assets that have shown recent strength and selling assets that have shown recent weakness.
DRS strategy: The Exponential Moving Average is used to identify the strength and direction of the existing trend. When the price remains above the moving average, it indicates bullish momentum and vice versa for bearish momentum.
/Results
The backtest results are based on a starting capital of $13,700 (convenient amount for retail traders) with 5% of equity for the position size and pyramiding of 2 to allow one open position at a time for each signal. Commissions vary from broker to broker and they are calculated in different ways so a simple $3 per order is used in backtesting this strategy. Slippage of 3 ticks is used to ensure the results are representative of real world, market order trading. The backtest results are available to view at the bottom of this page.
Note:
Past performance in backtesting does not guarantee future results. Broker execution and market changes can significantly affect strategy performance in live trading.
Originality:
The DRS strategy is unique in its combination of both Momentum Strategy and Mean Reversion Strategy components within a single trading strategy. This dual-regime approach allows the strategy to adapt to different market conditions. Additionally, it incorporates short positions for momentum signals, this ensures that the strategy remains active in bear markets.
1. Mean Reverting Regimes
In mean-reverting regimes, markets exhibit high volatility with prices oscillating around a historical average. The DRS employs the Keltner Channel as a core tool for identifying overbought and oversold conditions, which are prevalent in such regimes.
Detection: The strategy detects mean reverting opportunities when prices deviate significantly from the middle band of the Keltner Channel, signaling an overbought or oversold condition.
Execution: Trades are executed with the expectation that prices will revert to the mean. For example, buying when the price is below the lower band (oversold) and selling when it's above the upper band (overbought).
2. Trending Regimes
In trending regimes, markets move in a persistent direction, either up or down. The DRS utilizes the Exponential Moving Average (EMA) to identify and follow these trends.
Trend Identification: The EMA helps in determining the overall direction of the trend, while the number of days price stays above the moving average indicates the strength of the trend.
Trade Execution: The strategy capitalizes on strong trends by taking positions in the direction of the trend (long positions in uptrends and short positions in downtrends).
/Tickers
This strategy has been backtested primarily on SPY. It also performs well on IWF and QQQ.

Price Action Pattern Breakout Strategy: Wedge,Triangle,ChannelIntroducing the Price Action Pattern Breakout Strategy: Wedge,Triangle,Channel 💹🚀
The "Price Action Pattern Breakout Strategy: Wedge, Triangle, Channel" is a dynamic and automated trading strategy that excels in recognizing and capitalizing on breakout opportunities within the realm of powerful price action patterns. It is finely tuned to achieve exceptional precision in detecting three distinct pattern types: Wedge, Triangle, and Channel. This diversity equips you to confidently navigate a wide range of market scenarios and opportunities.
This strategy automates trade entries and exits upon confirmed pattern breakouts, this eliminates human errors in correctly recognizing patterns and prevents emotional decisions. This strategy is designed to work across different time frames, making it suitable for both short-term and long-term traders. Whether you're a day trader, swing trader, or investor, this strategy provides the flexibility you need to thrive in diverse market conditions.
💎 How it Works:
▶️ In this strategy, three price action patterns have been utilized, one of which is the "Wedge" pattern. The Wedge pattern has consistently demonstrated a high level of credibility, typically resulting in sharp and rapid price movements following a confirmed breakout from this pattern. This characteristic makes the Wedge pattern highly noteworthy in our strategy. The second pattern is the "Triangle" pattern, which, depending on its formation, whether ascending or descending, can indicate a strong continuation or reversal of the trend. The last pattern is the "Channel" pattern. The reason for using the Channel pattern is its versatility in various market conditions and its tendency to produce reliable results.
In the snapshot below, you can observe the types of patterns that this strategy is capable of identifying at a glance:
▶️ This strategy employs two types of targeting systems: Fixed Targets and Trailing Targets.
Fixed Targets is the default targeting system of the strategy, incorporating two primary targets: TP1 (Target Point 1) and TP2 (Target Point 2). These targets are thoughtfully adjusted in alignment with specific rules for each pattern. With Fixed Targets, you have the flexibility to designate the position size percentage for your exits at TP1 and TP2. For instance, should you opt to allocate 60% of your position size to TP1, as soon as the price triggers the first take profit level, 60% of your initial position is gracefully closed, leaving the remaining 40% to exit the trade upon reaching TP2.
Trailing Targets represent the strategy's alternative targeting system. With this system, the trailing stop becomes active once the price reaches the specified trigger point. The strategy then exits the trade based on the defined offset percentage and price retracement from the trailing limit.
▶️ This strategy relies on a single type of stop loss, determined by previous pivot points and adjusted based on the trade's direction, whether long or short, placing the stop loss above or below the prior pivot. This stop loss approach has demonstrated reliability when used alongside price action patterns.
In addition to this fixed stop loss, you can specify a percentage buffer, offering protection against potential stop hunting due to market fluctuations. This buffer helps protect your positions from sudden price swings. For example, selecting a 1% buffer means your stop loss will be positioned 1% higher or lower concerning the last pivot, depending on your trade's direction. This added layer of security ensures your trades remain resilient and less vulnerable to market volatility.
▶️ A practical feature of this strategy is the "Risk-Free" option. Once activated, it continuously monitors price movements, and as soon as the price progresses in the trade's direction and surpasses the designated Risk-Free Trigger Point in percentage, the stop loss is dynamically shifted from its initial position to the entry price, effectively making the trade "risk-free." This means that if the trade doesn't go as expected, we exit at the entry point, incurring neither profit nor loss from the trade.
Additionally, you have the flexibility to fine-tune the modified stop loss, positioning it slightly above or below the entry price through the configuration of a specified percentage. This allows for effective consideration of commission fees in your trading strategy.
▶️ Risk management is a crucial concept in trading, playing a significant role in a trader's long-term success. This strategy introduces a unique feature called "Fixed Loss Position Sizing", where upon activation, you can limit the risk exposure to a specified percentage of your capital per trade. Set your preferred risk percentage along with the intended leverage. The strategy independently considers your available capital and designated leverage, determining the position size before executing any trade.
In the case of a stop loss, your loss is limited to the specified risk percentage. For instance, with a $1000 account and a 1% risk set, the strategy adjusts each trade's size to ensure a maximum loss of $10 if the stop loss is triggered. Enabling this feature will ensure disciplined risk management, aligning potential losses precisely with your predetermined risk percentage, contingent upon your total available capital.
▶️ Another feature of this strategy is a sophisticated mechanism called "Loss Compensation". When enabled, Loss Compensation dynamically adjusts the position size after a loss, aiming to recover from previous losses in subsequent trades. This adaptive mechanism continually modifies the position size to mitigate the impact of consecutive losses until reaching a user-defined limit for consecutive loss compensations.
The feature's configurability allows users to set the maximum number of consecutive losses to compensate for and also includes an option to factor in trading fees from prior trades into the compensation calculation. Loss Compensation operates in conjunction with the 'Fixed Loss Position Sizing' setting, ensuring that once losses are sufficiently compensated, subsequent entries revert to the predefined configurations within the 'Fixed Loss Position Sizing' settings.
This advanced tool ensures a stable risk management approach by changing trade sizes dynamically according to past results during consecutive loss periods.
▶️ This strategy incorporates a feature known as the "Counter-Pattern Breakout", altering its approach to wedge, triangle, and channel pattern breakouts. Normally, the strategy relies on standard pattern signals to determine whether to enter long or short positions based on breakout directions.
For example, in an ascending channel or a rising wedge pattern, the strategy typically seeks a short position opportunity upon a confirmed breakout in the lower line, and breakouts from the upper line are disregarded by the strategy. But with this feature enabled, strategy disregards the conventional pattern signals, seizing breakouts from upper or lower lines to open corresponding positions. For instance, in the ascending channel or the rising wedge pattern example, the strategy might enter a long position if the upper line breaks or a short position if the lower line breaks.
This introduces a more adaptive and opportunistic trading style, allowing you to capitalize on price movements, irrespective of the typical signal direction indicated by the pattern.
▶️ This strategy is fully compatible with third-party trading bots, allowing for easy connectivity to popular trading platforms. By leveraging the TradingView webhook functionality, you can effortlessly link the strategy to your preferred bot and receive accurate signals for position entry and exit. The strategy provides all the necessary alert message fields, ensuring a smooth and user-friendly trading experience. With this integration, you can automate the execution of trades, saving time and effort while enjoying the benefits of this powerful strategy.
⚙️ How to Use & Configure User Settings:
To fully utilize the "Price Action Pattern Breakout Strategy: Wedge, Triangle, Channel," it's essential to consider and comprehend the following steps. They play a crucial role in enhancing its functionality and achieving its utmost potential outcomes:
1. General Strategy Settings:
Enable Dark Mode if using a dark TradingView theme for improved chart visibility.
Select the Strategy's Trade Direction: Long, Short, or Both.
Choose Pattern Recognition Accuracy: High for precise recognition but fewer positions, Low for more positions with slightly less accuracy.
Enable 'Prevent New Entry on Opposite Signal While In Position' to avoid new trades if the opposite signal occurs.
Switch to Indicator Mode if solely using the strategy as an indicator or in combination with other strategies.
2. Pattern and Pivot Configuration:
Consider configuring the Number of Patterns and Pivot Lookback Lengths. Here, you can personalize the pivot lookback lengths for wedge, triangle, and channel patterns across eight different settings on your chart. For lower time frames, consider larger lengths to reduce chart noise. Alternatively, to maintain clarity on your chart, you can disable multiple patterns with different lengths while ensuring at least one pattern remains enabled.
Note that enabling more patterns doesn't always equate to increased potential profit. Sometimes, fewer patterns result in greater profit potential, and vice versa. Experiment with lengths and the number of patterns to determine the most profitable and optimal outcome for your trading symbol and timeframe.
3. Targeting System Selection:
Choose between 'Fixed Targets' or 'Trailing Targets' for your targeting system.
'Fixed Targets' is the default setting, operational when 'Trailing Targets' are turned off.
Set the TP1 Position Size as a percentage, defining the size for TP1, and the rest exits at TP2.
Optionally activate 'Skip Entry if TP1 is Passed' to bypass entering positions if the price has exceeded TP1.
Alternatively, opt for the 'Trailing Target' for dynamic exits based on trigger points and offsets. Note that this option disables fixed targets.
4. Stop Loss Configuration:
Determine the number of candles to consider for stop loss placement based on the last pivot.
Optionally add a percentage to the stop loss to create a buffer against market fluctuations, guarding your positions from sudden price swings.
5. Risk Management Configuration:
You can activate the 'Risk-Free' feature, making your trades risk-free by moving the stop loss to the entry price upon reaching a specified trigger point.
You have the possibility to enable 'Fixed Loss Position Sizing' to limit risk to a percentage of total capital per trade, ensuring prudent risk management.
You can employ 'Use Real-Time Balance for Each Entry' to precisely calculate fixed loss position sizing according to the real-time balance for every entry.
The 'Loss Compensation' feature can be activated to automatically adjust trade sizes during consecutive losses and compensate for prior incurred losses.
Loss compensation continues adjusting trade sizes until it reaches the defined limit of consecutive losses specified in the 'Maximum Consecutive Losses To Compensate' field.
You can factor in commission fees by specifying a percentage in the 'Include Trading Fees in Compensation (%)' field, providing an option for more accurate loss compensation calculations.
You have the option to enable 'Limit Compensation to Real-Time Balance' to prevent consecutive loss compensation from exceeding your current real-time account balance.
It's important to note that for the 'Loss Compensation' feature to operate, the 'Fixed Loss Position Sizing' must be enabled.
6. Counter-Pattern Breakout Configuration:
In this section you have the option to enable the "Counter-Pattern Breakout" feature to adjust the strategy's approach to wedge, triangle, and channel pattern breakouts. Once enabled, the strategy disregards traditional pattern signals and capitalizes on breakouts from either the upper or lower lines, initiating corresponding positions accordingly.
Choose between 'Fixed Target' or 'Trailing Target' for your targeting system. If you opt for the 'Fixed Target', set a specific target point as a percentage, serving as the default target for counter-pattern breakouts. Alternatively, choose the 'Trailing Target' for dynamic exits based on trigger points and offsets. Do keep in mind that selecting the 'Trailing Target' option disables the fixed target setting.
Keep in mind that for standard, non-counter-pattern breakouts, the target point settings in their respective sections remain applicable, distinct from the settings configured for targeting within this section.
Note that the stop loss configurations are shared across standard pattern and counter-pattern breakouts and can be adjusted within the stop loss section.
7. Info Tables:
In the info tables section, you can show or hide different tables on the charts. This includes the backtest table, the current balance table displaying available funds, and a table showcasing Maximum Consecutive Wins or Losses. Choose which to display according to your preferences and specific needs.
8.Date & Time Range Filter:
Utilize the Date & Time Range filter feature to precisely select a start and end date, including time, to filter data within the chosen range.
When connecting this strategy to a trading bot for automated trades, ensure to set the start date and time to the intended initiation moment to avoid undesired outcomes as this directly affects the real-time balance calculations of the strategy.
8. Integration with Third-Party Bots:
To automate trading, leverage the strategy's compatibility with third-party trading bots. Seamlessly integrate the strategy into well-known trading platforms by using alert message fields to input commands from third-party trading bots, enabling automated trade execution for both long and short positions.
By furnishing these adjustable settings, the strategy empowers you to personalize it according to your unique requirements, thereby bolstering the adaptability and efficacy of your trading approach.
🔐 Source Code Protection:
The 'Price Action Pattern Breakout Strategy: Wedge, Triangle, Channel' source code is engineered for precision, reliability, and effectiveness. Its original and innovative design warrants protection and restricted access, preserving the strategy's exclusivity. Safeguarding the code maintains the strategy's integrity and distinctiveness, providing users with a competitive advantage in their trading endeavors.

Machine Learning: Donchian DCA Grid Strategy [YinYangAlgorithms]This strategy uses a Machine Learning approach on the Donchian Channels with a DCA and Grid purchase/sell Strategy. Not only that, but it uses a custom Bollinger calculation to determine its Basis which is used as a mild sell location. This strategy is a pure DCA strategy in the sense that no shorts are used and theoretically it can be used in webhooks on most exchanges as it’s only using Spot Orders. The idea behind this strategy is we utilize both the Highest Highs and Lowest Lows within a Machine Learning standpoint to create Buy and Sell zones. We then fraction these zones off into pieces to create Grids. This allows us to ‘micro’ purchase as it enters these zones and likewise ‘micro’ sell as it goes up into the upper (sell) zones.
You have the option to set how many grids are used, by default we use 100 with max 1000. These grids can be ‘stacked’ together if a single bar is to go through multiple at the same time. For instance, if a bar goes through 30 grids in one bar, it will have a buy/sell power of 30x. Stacking Grid Buy and (sometimes) Sells is a very crucial part of this strategy that allows it to purchase multitudes during crashes and capitalize on sales during massive pumps.
With the grids, you’ll notice there is a middle line within the upper and lower part that makes the grid. As a Purchase Type within our Settings this is identified as ‘Middle of Zone Purchase Amount In USDT’. The middle of the grid may act as the strongest grid location (aside from maybe the bottom). Therefore there is a specific purchase amount for this Grid location.
This DCA Strategy also features two other purchase methods. Most importantly is its ‘Purchase More’ type. Essentially it will attempt to purchase when the Highest High or Lowest Low moves outside of the Outer band. For instance, the Lowest Low becomes Lower or the Higher High becomes Higher. When this happens may be a good time to buy as it is featuring a new High or Low over an extended period.
The last but not least Purchase type within this Strategy is what we call a ‘Strong Buy’. The reason for this is its verified by the following:
The outer bounds have been pushed (what causes a ‘Purchase More’)
The Price has crossed over the EMA 21
It has been verified through MACD, RSI or MACD Historical (Delta) using Regular and Hidden Divergence (Note, only 1 of these verifications is required and it can be any).
By default we don’t have Purchase Amount for ‘Strong Buy’ set, but that doesn’t mean it can’t be viable, it simply means we have only seen a few pairs where it actually proved more profitable allocating money there rather than just increasing the purchase amount for ‘Purchase More’ or ‘Grids’.
Now that you understand where we BUY, we should discuss when we SELL.
This Strategy features 3 crucial sell locations, and we will discuss each individually as they are very important.
1. ‘Sell Some At’: Here there are 4 different options, by default its set to ‘Both’ but you can change it around if you want. Your options are:
‘Both’ - You will sell some at both locations. The amount sold is the % used at ‘Sell Some %’.
‘Basis Line’ - You will sell some when the price crosses over the Basis Line. The amount sold is the % used at ‘Sell Some %’.
‘Percent’ - You will sell some when the Close is >= X% between the Lower Inner and Upper Inner Zone.
‘None’ - This simply means don’t ever Sell Some.
2. Sell Grids. Sell Grids are exactly like purchase grids and feature the same amount of grids. You also have the ability to ‘Stack Grid Sells’, which basically means if a bar moves multiple grids, it will stack the amount % wise you will sell, rather than just selling the default amount. Sell Grids use a DCA logic but for selling, which we deem may help adjust risk/reward ratio for selling, especially if there is slow but consistent bullish movement. It causes these grids to constantly push up and therefore when the close is greater than them, accrue more profit.
3. Take Profit. Take profit occurs when the close first goes above the Take Profit location (Teal Line) and then Closes below it. When Take Profit occurs, ALL POSITIONS WILL BE SOLD. What may happen is the price enters the Sell Grid, doesn’t go all the way to the top ‘Exiting it’ and then crashes back down and closes below the Take Profit. Take Profit is a strong location which generally represents a strong profit location, and that a strong momentum has changed which may cause the price to revert back to the buy grid zone.
Keep in mind, if you have (by default) ‘Only Sell If Profit’ toggled, all sell locations will only create sell orders when it is profitable to do so. Just cause it may be a good time to sell, doesn’t mean based on your DCA it is. In our opinion, only selling when it is profitable to do so is a key part of the DCA purchase strategy.
You likewise have the ability to ‘Only Buy If Lower than DCA’, which is likewise by default. These two help keep the Yin and Yang by balancing each other out where you’re only purchasing and selling when it makes logical sense too, even if that involves ignoring a signal and waiting for a better opportunity.
Tutorial:
Like most of our Strategies, we try to capitalize on lower Time Frames, generally the 15 minutes so we may find optimal entry and exit locations while still maintaining a strong correlation to trend patterns.
First off, let’s discuss examples of how this Strategy works prior to applying Machine Learning (enabled by default).
In this example above we have disabled the showing of ‘Potential Buy and Sell Signals’ so as to declutter the example. In here you can see where actual trades had gone through for both buying and selling and get an idea of how the strategy works. We also have disabled Machine Learning for this example so you can see the hard lines created by the Donchian Channel. You can also see how the Basis line ‘white line’ may act as a good location to ‘Sell Some’ and that it moves quite irregularly compared to the Donchian Channel. This is due to the fact that it is based on two custom Bollinger Bands to create the basis line.
Here we zoomed out even further and moved back a bit to where there were dense clusters of buy and sell orders. Sometimes when the price is rather volatile you’ll see it ‘Ping Pong’ back and forth between the buy and sell zones quite quickly. This may be very good for your trades and profit as a whole, especially if ‘Only Buy If Lower Than DCA’ and ‘Only Sell If Profit’ are both enabled; as these toggles will ensure you are:
Always lowering your Average when buying
Always making profit when selling
By default 8% commission is added to the Strategy as well, to simulate the cost effects of if these trades were taking place on an actual exchange.
In this example we also turned on the visuals for our ‘Purchase More’ (orange line) and ‘Take Profit’ (teal line) locations. These are crucial locations. The Purchase More makes purchases when the bottom of the grid has been moved (may dictate strong price movement has occurred and may be potential for correction). Our Take Profit may help secure profit when a momentum change is happening and all of the Sell Grids weren’t able to be used.
In the example above we’ve enabled Buy and Sell Signals so that you can see where the Take Profit and Purchase More signals have occurred. The white circle demonstrates that not all of the Position Size was sold within the Sell Grids, and therefore it was ALL CLOSED when the price closed below the Take Profit Line (Teal).
Then, when the bottom of the Donchian Channel was pushed further down due to the close (within the yellow circle), a Purchase More Signal was triggered.
When the close keeps pushing the bottom of the Buy Grid lower, it can cause multiple Purchase More Signals to occur. This is normal and also a crucial part of this strategy to help lower your DCA. Please note, the Purchase More won’t trigger a Buy if the Close is greater than the DCA and you have ‘Only Purchase If Lower Than DCA’ activated.
By turning on Machine Learning (default settings) the Buy and Sell Grid Zones are smoothed out more. It may cause it to look quite a bit different. Machine Learning although it looks much worse, may help increase the profit this Strategy can produce. Previous results DO NOT mean future results, but in this example, prior to turning on Machine Learning it had produced 37% Profit in ~5 months and with Machine Learning activated it is now up to 57% Profit in ~5 months.
Machine Learning causes the Strategy to focus less on Grids and more on Purchase More when it comes to getting its entries. However, if you likewise attempt to focus on Purchase More within non Machine Learning, the locations are different and therefore the results may not be as profitable.
PLEASE NOTE:
By default this strategy uses 1,000,000 as its initial capital. The amount it purchases in its Settings is relevant to this Initial capital. Considering this is a DCA Strategy, we only want to ‘Micro’ Buy and ‘Micro’ Sell whenever conditions are met.
Therefore, if you increase the Initial Capital, you’ll likewise want to increase the Purchase Amounts within the Settings and Vice Versa. For instance, if you wish to set the Initial Capital to 10,000, you should likewise can the amounts in the Settings to 1% of what they are to account for this.
We may change the Purchase Amounts to be based on %’s in a later update if it is requested.
We will conclude this Tutorial here, hopefully you can see how a DCA Grid Purchase Model applied to Machine Learning Donchian Channels may be useful for making strategic purchases in low and high zones.
Settings:
Display Data:
Show Potential Buy Locations: These locations are where 'Potentially' orders can be placed. Placement of orders is dependant on if you have 'Only Buy If Lower Than DCA' toggled and the Price is lower than DCA. It also is effected by if you actually have any money left to purchase with; you can't buy if you have no money left!
Show Potential Sell Locations: These locations are where 'Potentially' orders will be sold. If 'Only Sell If Profit' is toggled, the sell will only happen if you'll make profit from it!
Show Grid Locations: Displaying won't affect your trades but it can be useful to see where trades will be placed, as well as which have gone through and which are left to be purchased. Max 100 Grids, but visuals will only be shown if its 20 or less.
Purchase Settings:
Only Buy if its lower than DCA: Generally speaking, we want to lower our Average, and therefore it makes sense to only buy when the close is lower than our current DCA and a Purchase Condition is met.
Compound Purchases: Compounding Purchases means reinvesting profit back into your trades right away. It drastically increases profits, but it also increases risk too. It will adjust your Purchase Amounts for the Purchase Type you have set at the same % rate of strategy initial_capital to the amounts you have set.
Adjust Purchase Amount Ratio to Maintain Risk level: By adjusting purchase levels we generally help maintain a safe risk level. Basically we generally want to reserve X amount of % for each purchase type being used and relocate money when there is too much in one type. This helps balance out purchase amounts and ensure the types selected have a correct ratio to ensure they can place the right amount of orders.
Stack Grid Buys: Stacking Buy Grids is when the Close crosses multiple Buy Grids within the same bar. Should we still only purchase the value of 1 Buy Grid OR stack the grid buys based on how many buy grids it went through.
Purchase Type: Where do you want to make Purchases? We recommend lowering your risk by combining All purchase types, but you may also customize your trading strategy however you wish.
Strong Buy Purchase Amount In USDT: How much do you want to purchase when the 'Strong Buy' signal appears? This signal only occurs after it has at least entered the Buy Zone and there have been other verifications saying it's now a good time to buy. Our Strong Buy Signal is a very strong indicator that a large price movement towards the Sell Zone will likely occur. It almost always results in it leaving the Buy Zone and usually will go to at least the White Basis line where you can 'Sell Some'.
Buy More Purchase Amount In USDT: How much should you purchase when the 'Purchase More' signal appears? This 'Purchase More' signal occurs when the lowest level of the Buy Zone moves lower. This is a great time to buy as you're buying the dip and generally there is a correction that will allow you to 'Sell Some' for some profit.
Amount of Grid Buy and Sells: How many Grid Purchases do you want to make? We recommend having it at the max of 10, as it will essentially get you a better Average Purchase Price, but you may adjust it to whatever you wish. This amount also only matters if your Purchase Type above incorporates Grid Purchases. Max 100 Grids, but visuals will only be shown if it's 20 or less.
Each Grid Purchase Amount In USDT: How much should you purchase after closing under a grid location? Keep in mind, if you have 10 grids and it goes through each, it will be this amount * 10. Grid purchasing is a great way to get a good entry, lower risk and also lower your average.
Middle Of Zone Purchase Amount In USDT: The Middle Of Zone is the strongest grid location within the Buy Zone. This is why we have a unique Purchase Amount for this Grid specifically. Please note you need to have 'Middle of Zone is a Grid' enabled for this Purchase Amount to be used.
Sell:
Only Sell if its Profit: There is a chance that during a dump, all your grid buys when through, and a few Purchase More Signals have appeared. You likely got a good entry. A Strong Buy may also appear before it starts to pump to the Sell Zone. The issue that may occur is your Average Purchase Price is greater than the 'Sell Some' price and/or the Grids in the Sell Zone and/or the Strong Sell Signal. When this happens, you can either take a loss and sell it, or you can hold on to it and wait for more purchase signals to therefore lower your average more so you can take profit at the next sell location. Please backtest this yourself within our YinYang Purchase Strategy on the pair and timeframe you are wanting to trade on. Please also note, that previous results will not always reflect future results. Please assess the risk yourself. Don't trade what you can't afford to lose. Sometimes it is better to strategically take a loss and continue on making profit than to stay in a bad trade for a long period of time.
Stack Grid Sells: Stacking Sell Grids is when the Close crosses multiple Sell Grids within the same bar. Should we still only sell the value of 1 Sell Grid OR stack the grid sells based on how many sell grids it went through.
Stop Loss Type: This is when the Close has pushed the Bottom of the Buy Grid More. Do we Stop Loss or Purchase More?? By default we recommend you stay true to the DCA part of this strategy by Purchasing More, but this is up to you.
Sell Some At: Where if selected should we 'Sell Some', this may be an important way to sell a little bit at a good time before the price may correct. Also, we don't want to sell too much incase it doesn't correct though, so its a 'Sell Some' location. Basis Line refers to our Moving Basis Line created from 2 Bollinger Bands and Percent refers to a Percent difference between the Lower Inner and Upper Inner bands.
Sell Some At Percent Amount: This refers to how much % between the Lower Inner and Upper Inner bands we should well at if we chose to 'Sell Some'.
Sell Some Min %: This refers to the Minimum amount between the Lower Inner band and Close that qualifies a 'Sell Some'. This acts as a failsafe so we don't 'Sell Some' for too little.
Sell % At Strong Sell Signal: How much do we sell at the 'Strong Sell' Signal? It may act as a strong location to sell, but likewise Grid Sells could be better.
Grid and Donchian Settings:
Donchian Channel Length: How far back are we looking back to determine our Donchian Channel.
Extra Outer Buy Width %: How much extra should we push the Outer Buy (Low) Width by?
Extra Inner Buy Width %: How much extra should we push the Inner Buy (Low) Width by?
Extra Inner Sell Width %: How much extra should we push the Inner Sell (High) Width by?
Extra Outer Sell Width %: How much extra should we push the Outer Sell (High) Width by?
Machine Learning:
Rationalized Source Type: Donchians usually use High/Low. What Source is our Rationalized Source using?
Machine Learning Type: Are we using a Simple ML Average, KNN Mean Average, KNN Exponential Average or None?
Machine Learning Length: How far back is our Machine Learning going to keep data for.
k-Nearest Neighbour (KNN) Length: How many k-Nearest Neighbours will we account for?
Fast ML Data Length: What is our Fast ML Length?? This is used with our Slow Length to create our KNN Distance.
Slow ML Data Length: What is our Slow ML Length?? This is used with our Fast Length to create our KNN Distance.
If you have any questions, comments, ideas or concerns please don't hesitate to contact us.
HAPPY TRADING!

Trend Confirmation StrategyThe profitability and uniqueness of a trading strategy depend on various factors including market conditions, risk management, and the strategy's ability to capitalize on price movements. I'll describe the strategy provided and highlight its potential benefits and differences compared to other strategies:
Strategy Overview:
The provided strategy combines three technical indicators: Supertrend, MACD, and VWAP. It aims to identify potential entry and exit points by confirming trend direction and considering the proximity to the VWAP level. The strategy also incorporates stop-loss and take-profit mechanisms, as well as a trailing stop.
Unique Aspects and Potential Benefits:
Trend Confirmation: The strategy uses both Supertrend and MACD to confirm the trend direction. This dual confirmation can increase the likelihood of accurate trend identification and filter out false signals.
VWAP Confirmation: The strategy considers the proximity of the price to the VWAP level. This dynamic level can act as a support or resistance and provide additional context for entry decisions.
Adaptive Stop Loss: The strategy sets a stop-loss range, which helps provide some tolerance for minor price fluctuations. This adaptive approach considers market volatility and helps prevent premature stop-loss triggers.
Trailing Stop: The strategy incorporates a trailing stop mechanism to lock in profits as the trade moves in the desired direction. This can potentially enhance profitability during strong trends.
Partial Profit Booking: While not explicitly implemented in the provided code, you could consider booking partial profits when the MACD shows a crossover in the opposite direction. This aspect could help secure gains while still keeping exposure to potential further price movements.
Key Differences from Other Strategies:
Dual Indicator Confirmation: The combination of Supertrend and MACD for trend confirmation is a unique aspect of this strategy. It adds an extra layer of filtering to enhance the accuracy of entry signals.
Dynamic VWAP: Incorporating the VWAP level into the decision-making process adds a dynamic element to the strategy. VWAP is often used by institutional traders, and its inclusion can provide insights into the market sentiment.
Adaptive Stop Loss and Trailing: The strategy's use of an adaptive stop-loss range and a trailing stop can help manage risk and protect profits more effectively during changing market conditions.
Partial Profit Booking: The suggestion to consider partial profit booking upon MACD crossovers in the opposite direction is a practical approach to secure gains while staying in the trade.
Caution and Considerations:
Backtesting: Before deploying any strategy in real trading, it's crucial to thoroughly backtest it on historical data to understand its performance under various market conditions.
Risk Management: While the strategy has built-in risk management mechanisms, it's essential to carefully manage position sizes and overall portfolio risk.
Market Conditions: No strategy works well in all market conditions. It's important to be flexible and adjust the strategy or refrain from trading during particularly volatile or unpredictable periods.
Continuous Monitoring: Even though the strategy includes automated components, continuous monitoring of the trades and market conditions is necessary.
Adaptability: Markets can change over time. Traders need to be prepared to adapt the strategy as necessary to stay aligned with evolving market dynamics.

D-BoT Alpha 'Short' SMA and RSI StrategyDostlar selamlar,
İşte son derece basit ama etkili ve hızlı, HTF de çok iyi sonuçlar veren bir strateji daha, hepinize bol kazançlar dilerim ...
Nedir, Nasıl Çalışır:
Strateji, iki ana girdiye dayanır: SMA ve RSI. SMA hesaplama aralığı 200 olarak, RSI ise 14 olarak ayarlanmıştır. Bu değerler, kullanıcı tercihlerine veya geriye dönük test sonuçlarına göre ayarlanabilir.
Strateji, iki koşul karşılandığında bir short sinyali oluşturur: RSI değeri, belirlenen bir giriş seviyesini (burada 51 olarak belirlenmiş) aşar ve kapanış fiyatı SMA değerinin altındadır.
Strateji, kısa pozisyonu üç durumda kapatır: Kapanış fiyatı, takip eden durdurma seviyesinden (pozisyon açıldığından beri en düşük kapanış olarak belirlenmiştir) büyükse, RSI değeri belirlenen bir durdurma seviyesini (bu durumda 54) aşarsa veya RSI değeri belirli bir kar al seviyesinin (bu durumda 32) altına düşerse.
Güçlü Yönleri:
İki farklı gösterge (SMA ve RSI) kullanımı, yalnızca birini kullanmaktan daha sağlam bir sinyal sağlayabilir.
Strateji, karları korumaya ve fiyat dalgalanmalarında kayıpları sınırlamaya yardımcı olabilecek bir iz süren durdurma seviyesi içerir.
Script oldukça anlaşılır ve değiştirmesi nispeten kolaydır.
Zayıf Yönleri:
Strateji, hacim, oynaklık veya daha geniş piyasa eğilimleri gibi diğer potansiyel önemli faktörleri göz önünde bulundurmaz.
RSI seviyeleri ve SMA süresi için belirli parametreler sabittir ve tüm piyasa koşulları veya zaman aralıkları için optimal olmayabilir.
Strateji oldukça basittir. Trade maliyetini (kayma veya komisyonlar gibi) hesaba katmaz, bu da trade performansını önemli ölçüde etkileyebilir.
Bu Stratejiyle Nasıl İşlem Yapılır:
Strateji, short işlemler için tasarlanmıştır. RSI, 51'in üzerine çıktığında ve kapanış fiyatı 200 periyotluk SMA'nın altında olduğunda işleme girer. RSI, 54'ün üzerine çıktığında veya 32'nin altına düştüğünde veya fiyat, pozisyon açıldığından beri en düşük kapanış fiyatının üzerine çıktığında işlemi kapatır.
Lütfen Dikkat, bu strateji veya herhangi bir strateji izole bir şekilde kullanılmamalıdır. Tüm bu çalışmalar eğitsel amaçlıdır. Yatırım tavsiyesi içermez.
This script defines a trading strategy based on Simple Moving Average (SMA) and the Relative Strength Index (RSI) indicators. Here's an overview of how it works, along with its strengths and weaknesses, and how to trade using this strategy:
How it works:
The strategy involves two key inputs: SMA and RSI. The SMA length is set to 200, and the RSI length is set to 14. These values can be adjusted based on user preferences or back-testing results.
The strategy generates a short signal when two conditions are met: The RSI value crosses over a defined entry level (set at 51 here), and the closing price is below the SMA value.
When a short signal is generated, the strategy opens a short position.
The strategy closes the short position under three conditions: If the close price is greater than the trailing stop (which is set as the lowest close since the position opened), if the RSI value exceeds a defined stop level (54 in this case), or if the RSI value drops below a certain take-profit level (32 in this case).
Strengths:
The use of two different indicators (SMA and RSI) can provide a more robust signal than using just one.
The strategy includes a trailing stop, which can help to protect profits and limit losses as the price fluctuates.
The script is straightforward and relatively easy to understand and modify.
Weaknesses:
The strategy doesn't consider other potentially important factors, such as volume, volatility, or broader market trends.
The specific parameters for the RSI levels and SMA length are hard-coded, and may not be optimal for all market conditions or timeframes.
The strategy is very simplistic. It doesn't take into account the cost of trading (like slippage or commissions), which can significantly impact trading performance.
How to trade with this strategy:
The strategy is designed for short trades. It enters a trade when the RSI crosses above 51 and the closing price is below the 200-period SMA. It will exit the trade when the RSI goes above 54 or falls below 32, or when the price rises above the lowest closing price since the position was opened.
Please note, this strategy or any strategy should not be used in isolation. It's important to consider other aspects of trading such as risk management, capital allocation, and combining different strategies to diversify. Back-testing the strategy on historical data and demo trading before going live is also a recommended practice.

VWAP Breakout Strategy (Momentum, Vol, VWAP, RSI, TrSL)General Description and Unique Features of this Script
Introducing the VWAP Breakout Trading Algorithm for TradingView – the timeless strategy designed to identify the highest probability entries and trades for all financial securities and timeframes.
Unlike other strategies, the VWAP Breakout Strategy considers the buying/selling pressure in the market and supply/demand balance to generate real-time trading signals. The Relative Strength Index (RSI) is used as a technical measure to capture typical breakouts from consolidation periods and pullback entries.
With flexible backtesting options, traders can improve parameter settings depending on their time horizon and the type of financial securities being used. Plus, this pro-version of the VWAP Breakout Strategy offers stop-loss, take-profit, and trailing stop-loss exit strategies for better risk management.
The VWAP Breakout Strategy combines a number of technical indicators, the Moving Average (MA), the Volume Weighted Average Price (VWAP) and the RSI-qualifier to identify potential trend reversals and entry/exit points in the market. The VWAP Breakout Strategy can be used in conjunction with other technical indicators and fundamental analysis to make more informed trading decisions.
To further optimize trading results, this strategy generates trading signals based on real-time price action, rather than relying on the close / open of candles.
The VWAP Breakout Strategy
One important qualifier for generating buy signals is that the stock or other financial security is not in a short-term overbought status (for long-positions), or in a short-term oversold status (for short-positions), respectively.
Additionally, the stock or other financial security needs to go through a consolidation period before buy signals are being generated.
The RSI-indicator is being used as a technical measure in this strategy for that.
• Using moderate parameters for the RSI-qualifier (oversold-level 40 or higher, overbought level 60 or lower) will capture more typical breakouts from consolidation periods.
• Using more extreme parameters for the RSI-qualifier (oversold-level 35 or lower, overbought level 65 or higher) will capture the so-called pullback entries.
Long Entries
When the selling pressure is over and the continuation of the uptrend can be confirmed by the MA / VWAP crossover after reaching a price low, a buy signal is issued by this strategy.
Short Entries
When the byuing pressure is over and the continuation of the downtrend can be confirmed by the MA / VWAP crossover after reaching a price high, a sell signal is issued by this strategy.
Timeless Strategy
The underlying principles of this strategy are based on the buying- / selling pressure in the market as well as the supply and demand balance. The buying / selling volumes are being considered for the generation of trading signals. These sophisticated market principles make this strategy timeless which means it can be applied to 1min-charts, weekly charts as well as anything between those.
Generation of Trading Signals
Real-time process are considered for this pro-version of the VWAP Breakout Strategy. This is another benefit versus many other strategies which only consider the close or open of the canldes for trading signals:
Exit Strategies
This pro-version offers the following exit strategies:
• Stop-Loss
• Take-Profit
• Trailing Stop-Loss
The trailing SL functionality provides another benefit versus most other trading strategies resulting in significantly backtesting- and real-time trading results.
Trades will also be closed when an opposite trading signal is being generated (only applicable for combined long/short strategies).
Flexible Backtesting Option
The strategy offers fully flexible backtesting options to improve the parameter setting strategy, depending on time horizon and type of financial securities being used.
Relative Strength Index (RSI)
The Relative Strength Index (RSI) is a technical indicator developed by Welles Wilder in 1978. The RSI is used to perform a market value analysis and identify the strength of a trend as well as overbought and oversold conditions. The indicator is calculated on a scale from 0 to 100 and shows how much an asset has risen or fallen relative to its own price in recent periods.
The RSI is calculated as the ratio of average profits to average losses over a certain period of time. A high value of the RSI indicates an overbought situation, while a low value indicates an oversold situation. Typically, a value > 70 is considered an overbought threshold and a value < 30 is considered an oversold threshold. A value above 70 signals that a single value may be overvalued and a decrease in price is likely , while a value below 30 signals that a single value may be undervalued and an increase in price is likely.
For example, let's say you're watching a stock XYZ. After a prolonged falling movement, the RSI value of this stock has fallen to 26. This means that the stock is oversold and that it is time for a potential recovery. Therefore, a trader might decide to buy this stock in the hope that it will rise again soon.
The MA / VWAP Crossover Trading Strategy
This strategy combines two popular technical indicators: the Moving Average (MA) and the Volume Weighted Average Price (VWAP). The MA VWAP crossover strategy is used to identify potential trend reversals and entry/exit points in the market.
The VWAP is calculated by taking the average price of an asset for a given period, weighted by the volume traded at each price level. The MA, on the other hand, is calculated by taking the average price of an asset over a specified number of periods. When the MA crosses above the VWAP, it suggests that buying pressure is increasing, and it may be a good time to enter a long position. When the MA crosses below the VWAP, it suggests that selling pressure is increasing, and it may be a good time to exit a long position or enter a short position.
Traders typically use the MA VWAP crossover strategy in conjunction with other technical indicators and fundamental analysis to make more informed trading decisions. As with any trading strategy, it is important to carefully consider the risks and potential rewards before making any trades.
This strategy is applicable to all timeframes and the relevant parameters for the underlying indicators (RSI and MA/VWAP) can be adjusted and optimized as needed.
Backtesting Results
Backtesting gives outstanding results on all timeframes and drawdowns can be reduced to a minimum level. In this example, the hourly chart for MCFT has been used.
Settings for backtesting are:
- Period from April 2020 until April 2021 (1 yr)
- Starting capital 100k USD
- Position size = 25% of equity
- 0.01% commission = USD 2.50.- per Trade
- Slippage = 2 ticks
Other comments
• This strategy has been designed to identify the most promising, highest probability entries and trades for each stock or other financial security.
• The RSI qualifier is highly selective and filters out the most promising swing-trading entries. As a result, you will normally only find a low number of trades for each stock or other financial security per year in case you apply this strategy for the daily charts. Shorter timeframes will result in a higher number of trades / year.
• As a result, traders need to apply this strategy for a full watchlist rather than just one financial security.

LeafAlgo Premium Macro StrategiesA "macro score", as defined here, is created by giving various weights to different signals and adding them together to get one smooth score. Positive or negative values are assigned to each of the signals depending on if the statement is true or false (e.g. DPO > 0: +1, DPO < 0: -1). This manner of strategy allows for a subset of the available signals to be present at one time as opposed to every technical signal having to be active in order for a long/short signal to trigger.
This strategy contains SIX different macro score strategies -- "Base DFMA", "Base DFMG", "Ichimoku", "TSI", "Donchian DFMA", and "Donchian DFMG". These strategies have the signals and weights pre-determined in the code. The "Base DFMA" strategy is based on our Democratic Fibonacci Moving Average (DFMA) indicator; the "Donchian DFMA" is the same as the base DFMA strategy, but with a signal from our Donchian Cloud Score indicator as added confluence. The "Base DFMG" strategy is based on our Democratic Fibonacci McGinley Dynamics (DFMG) indicator; the "Donchian DFMG" is the same, but with the Donchian Cloud Score as added confluence. The "Ichimoku" strategy is based on the major sub-indicators found within an Ichimoku Cloud in addition to our Donchian Cloud Score. The "TSI" strategy is based on the True Strength Index.
The ability to select your strategy of choice can be found at the top of the strategy settings under "Strategy Options", then in the drop-down menu labeled "Strategy Choice".
The DFMA - Democratic Fibonacci Moving Average - is a separate indicator that we have released that takes 10 different Fibonacci MAs (lengths of 3 to 233, at Fibonacci intervals) and averages them to form the DFMA line. This helps by creating a consensus on the trend based on moving averages alone. Crossovers of the DFMA with the various Fib MA lengths as well as a cross of the price source and these lines can provide adequate long and short signals. In the two DFMA strategies, the heaviest weights have been given to crosses of the DFMA line/Fib MA (233) as well as the crosses of the Fib MA (3)/DFMA. Additionally, there are thresholds for DPO ( Detrended Price Oscillator , above or below 0), CMO ( Chande Momentum Oscillator , above or below 0), Jurik Volatility Bands (above or below 0), and Stoch RSI (above or below 50). These four signals hold a lighter weight than the MA cross signals. The macro score itself ranges between -10 and 10. In addition to the macro score line, a momentum line (sourced by the macro score itself) has been included. A crossover/crossunder of the macro score and the macro momentum line is included into the long/short signal syntax in addition to a threshold for the macro score.
The DFMG - Democratic Fibonacci McGinley Dynamics - is a separate indicator that we have released that takes 10 different Fibonacci McGinley Dynamic liness (lengths of 3 to 233, at Fibonacci intervals) and averages them to form the DFMG line. This helps by creating a consensus on the trend based on moving averages alone. Crossovers of the DFMG with the various Fib MG lengths as well as a cross of the price source and these lines can provide adequate long and short signals. This strategy has the signals and weights pre-determined in the code. Heaviest weights have been given to crosses of the DFMG line/ McGinley (233) as well as the crosses of the McGinley (3)/DFMG. Additionally, there are thresholds for DPO ( Detrended Price Oscillator , above or below 0), CMO ( Chande Momentum Oscillator , above or below 0), Jurik Volatility Bands (above or below 0), and Stoch RSI (above or below 50). These four signals hold a lighter weight than the McGinley cross signals. The macro score itself ranges between -10 and 10. In addition to the macro score line, a momentum line (sourced by the macro score itself) has been included. A crossover/crossunder of the macro score and the macro momentum line is included into the long/short signal syntax in addition to a threshold for the macro score.
For the Ichimoku macro score, five signals were considered and weighted equally:
- Kijun-sen < Ichimoku Source
- Tenkan-sen < Ichimoku Source
- Kijun-sen > Chikou-span
- Tenkan-sen > Kijun-sen
- Senkou Span A > Senkou Span B
In addition to these factors, the Ichimoku strategy utilizes the Donchian Cloud Score in the long and short entry signals. Thus, the Donchian Cloud settings are applicable to this strategy.
For the True Strength Index strategy, the heaviest weights have been given to various TSI signals, including a crossover/crossunder of TSI signal and TSI value, a threshold for the TSI Signal (above or below 0), and a crossover/crossunder of the CMO ( Chande Momentum Oscillator ) and the TSI signal line. Additionally, there are thresholds for DPO ( Detrended Price Oscillator , above or below 0), Jurik Volatility Bands (above or below 0), and Stoch RSI (above or below 50). These three signals hold a lighter weight than the three TSI signals. The macro score itself ranges between -10 and 10. In addition to the macro score line, a momentum line (sourced by the macro score itself) has been included. A crossover/crossunder of the macro score and the macro momentum line is included into the long/short signal syntax in addition to a threshold for the macro score.
The Donchian Cloud Score is derived from a set of 5 Donchian channels (upper, lower, and basis plotted) defaulted to lengths of 25, 50, 100, 150, and 200. A set of conditions associated with the channels aims to determine ranging versus trending markets. Weights are given to these conditions accordingly, then tallied up to determine the "cloud score", ranging between -25 and 25. In general, a ranging market is determined by a cloud score between -10 and 10, while a positive trending market has a score higher than 10 and a negative trending market has a score lower than -10. That said, long and short thresholds similar to the macro score itself are included in the user settings and set to a default of 5 or -5. The cloud score is plotted as a line in the underlay with coloration reflecting ranging or trending markets (green color above the long threshold, gray between the thresholds, and red below the short threshold). The cloud score is incorporated into the strategy syntax for long and short positions in that the score must be above or below the set threshold for a trade to be placed. A breakdown for the Donchian scoring is as follows:
- Broke the 25-length DC (DC(25)) upper band in the previous 3 bars - +1 if true, 0 if false
- Broke the DC(50) upper band in the previous 3 bars - +2 if true, 0 if false
- Broke the DC(100) upper band in the previous 3 bars - +3 if true, 0 if false
- Broke the DC(150) upper band in the previous 3 bars - +4 if true, 0 if false
- Broke the DC(200) upper band in the previous 3 bars - +5 if true, 0 if false
- Broke the DC(25) lower band in the previous 3 bars - -1 if true, 0 if false
- Broke the DC(50) lower band in the previous 3 bars - -2 if true, 0 if false
- Broke the DC(100) lower band in the previous 3 bars - -3 if true, 0 if false
- Broke the DC(150) lower band in the previous 3 bars - -4 if true, 0 if false
- Broke the DC(200) lower band in the previous 3 bars - -5 if true, 0 if false
- DC(25) basis line above the DC(50) basis line - +1 if true, -1 if false
- DC(25) basis line above the DC(100) basis line - +1 if true, -1 if false
- DC(25)basis line above the DC(150) basis line - +1 if true, -1 if false
- DC(25) basis line above the DC(200) basis line - +1 if true, -1 if false
- DC(50) basis line above the DC(100) basis line - +1 if true, -1 if false
- DC(50) basis line above the DC(150) basis line - +1 if true, -1 if false
- DC(50) basis line above the DC(200) basis line - +1 if true, -1 if false
- DC(100) basis line above the DC(150) basis line - +1 if true, -1 if false
- DC(100) basis line above the DC(200) basis line - +1 if true, -1 if false
- DC(150) basis line above the DC(200) basis line - +1 if true, -1 if false
Thresholds for both the respective macro score and the Donchian Cloud score have been included. Entry signals for each strategy require the score to be >= the respective thresholds for longs and <= the respective thresholds for shorts.
Additionally, a normalized z-score has been included. The z-score does not affect the entry and exit signals, however, it is displayed on the chart in the form of bar coloration. The z-score has been normalized to a range of -1 to +1. A z-score under -0.60 is displayed as a red bar color, a score between -0.60 and -0.2 is displayed as an orange bar color, a score between -0.2 and 0.2 is displayed as a gray bar color, a score between 0.2 and 0.6 is displayed as a lime bar color, and a score over 0.6 is displayed in green.
Data for each respective strategy will be displayed in an overlaid table. This includes the factors that comprise the macro score of choice, the values of each signal that adds up to the macro score, the macro score itself, the value of the momentum line of the macro score, the normalized z-score value, and the Donchian Cloud score (if applicable). Green coloration notes bullish sentiment within the signals or values, gray coloration is neutral, and red coloration notes bearish sentiment.
Take profit, stop loss, and trailing percentages are also included, found at the bottom of the Input tab under “TT and TTP” as well as “Stop Loss”. The take profit and stop loss levels will be reflected as green and red lines respectively on the chart as they occur. Make sure to understand the TP/SL ratio that you desire before use, as the desired hit rate/profitability percentage will be affected accordingly. The option for adding in a trailing stop has also been included, with options to choose between an ATR-based trail or a percentage-based trail. This strategy does NOT guarantee future returns. Apply caution in trading regardless of discretionary or algorithmic. Understand the concepts of risk/reward and the intricacies of each strategy choice before utilizing them in your personal trading.
Profitview/Pineconnector Settings:
If you wish to utilize Profitview’s automation system, find the included “Profitview Settings” under the Input tab of the strategy settings menu. If not, skip this section entirely as it can be left blank. Options will be “OPEN LONG TITLE”, “OPEN SHORT TITLE”, “CLOSE LONG TITLE”, and “CLOSE SHORT TITLE”. If you wished to trade SOL, for example, you would put “SOL LONG”, “SOL SHORT”, “SOL CLOSE LONG”, and “SOL CLOSE SHORT” in these areas. Within your Profitview extension, ensure that your Alerts all match these titles. To set an alert for use with Profitview, go to the “Alerts” tab in TradingView, then create an alert. Make sure that your desired asset and timeframe are currently displayed on your screen when creating the alert. Under the “Condition” option of the alert, select the strategy, then select the expiration time. If using TradingView Premium, this can be open-ended. Otherwise, select your desired expiration time and date. This can be updated whenever desired to ensure the strategy does not expire. Under “Alert actions”, nothing necessarily needs to be selected unless so desired. Leave the “Alert name” option empty. For the “Message”, delete the generated message and replace it with {{strategy.order.alert_message}} and nothing else. If using Pineconnector, follow the same directions for setting up an alert, but use the ",buy,,risk=" syntax as noted in the tooltips.
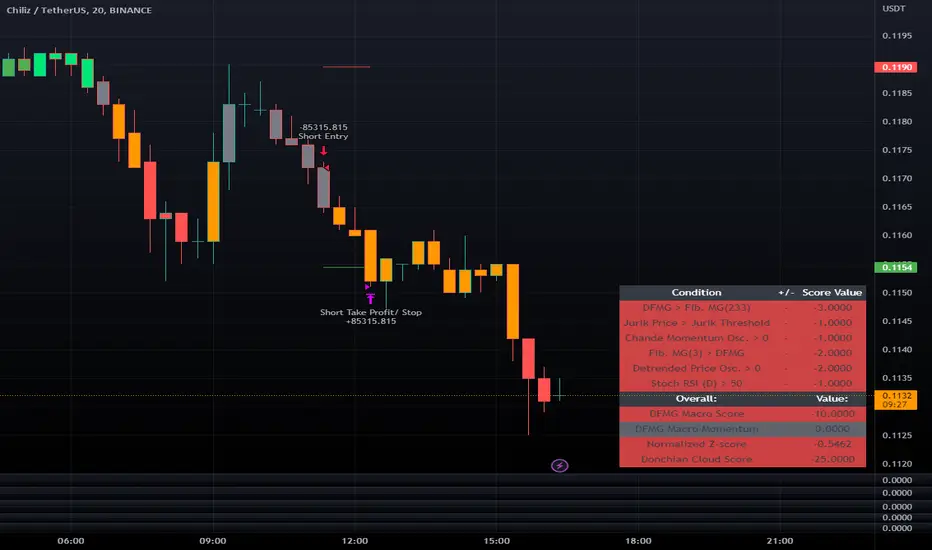
The Flower - Multiple Strategy Options in OneStrategy Overview
This strategy code currently includes four separate strategies to be used to either aid in discretionary trading or to be used algorithmically through the third-party system Profitview (profitview.app). Support for Pineconnector for use with MetaTrader 4 is in the works. The strategies have been designed with cryptocurrency trading in mind, however, the fundamentals apply to other assets.
The four strategies currently included are labeled “TSI Cross” (the default setting), “Oscillator Bands”, “Scalping”, and “McG/MA Cross”. Detailed information for each independent strategy can be found below, including sample settings configurations for each. A dropdown menu to select the strategy can be found under the “Strategy Options” set of settings under the Input tab of the strategy settings menu.
Additionally, the option to receive only long or short signals can be found alongside the Strategy Choice menu.
Take profit, stop loss, and trailing percentages are also included, found at the bottom of the Input tab under “TT and TTP” as well as “Stop Loss”. Make sure to understand the TP/SL ratio that you desire before use, as the desired hit rate/profitability percentage will be affected accordingly.
The only visuals associated with the strategy are two McGinley Dynamic lines, red (slow length) and green (fast length). These are relevant to the McGinley Cross strategy, but can be used alongside the other strategies if desired.
When viewing the backtesting data in the TradingView Strategy Tester, ensure that “use bar magnifier” is activated. This option can be found in the Properties tab of the strategy settings menu.
Profitview Settings
If you wish to utilize Profitview’s automation system, find the included “Profitview Settings” under the Input tab of the strategy settings menu. If not, skip this section entirely as it can be left blank. Options will be “OPEN LONG TITLE”, “OPEN SHORT TITLE”, “CLOSE LONG TITLE”, and “CLOSE SHORT TITLE”. If you wished to trade SOL, for example, you would put “SOL LONG”, “SOL SHORT”, “SOL CLOSE LONG”, and “SOL CLOSE SHORT” in these areas. Within your Profitview extension, ensure that your Alerts all match these titles. A sample of our Profitview syntax can be found below.
To set an alert for use with Profitview, go to the “Alerts” tab in TradingView, then create an alert. Make sure that your desired asset and timeframe are currently displayed on your screen when creating the alert. Under the “Condition” option of the alert, select the strategy, then select the expiration time. If using TradingView Premium, this can be open-ended. Otherwise, select your desired expiration time and date. This can be updated whenever desired to ensure the strategy does not expire. Under “Alert actions”, nothing necessarily needs to be selected unless so desired. Leave the “Alert name” option empty. For the “Message”, delete the generated message and replace it with {{strategy.order.alert_message}} and nothing else.
Strategy Choices
As mentioned above, this strategy code contains four separate strategy options. A detailed breakdown of each follows below:
Total Strength Index (TSI) Cross
This strategy option is the default choice. The main signal involved in this strategy is a crossover or crossunder of the TSI value line and TSI signal line, however, there are a few other signals involved in the creation of a long or short entry. In addition to the TSI, the strategy includes an Average Directional Index (ADX) threshold value, Jurik Volatility Bands (JVB), a Stoch RSI threshold, and an oscillator of choice in conjunction with a threshold of 0. This oscillator choice can be selected under the “Signal Options” menu in the Input tab of the strategy settings. The default oscillator is the Detrended Price Oscillator (DPO), though the option for Chande Momentum (CMO) or Rate of Change (RoC) are both viable for this strategy.
Individual settings for these can be found in the Input tab under “Oscillator Settings” (TSI, Stoch RSI, DPO, CMO, ROC), “Band/Channel Settings” (Jurik Volatility Bands Length/Smoothing), and “Directional Settings” (ADX Smoothing Long, DI Length Short, ADX Threshold).
Sample settings for SOLUSDT using the 20M timeframe:
- Oscillator Settings -- DPO Length (21), DPO *not* centered, RSI (Stoch) Length (4), Stochastic Length (4), TSI Long Length (25), TSI Short Length (13), TSI Signal Length (13), K (3), D (3)
- Band/Channel Settings -- Jurik Volatility Bands Length (25), Jurik Volatility Bands Smoothing (5)
- Directional Settings – JVB Price Threshold (0), ADX Smoothing Long (5), DI Length Short (5), ADX Threshold (23)
- Take Profit/Stop Loss – 0.85% TP, 0.005% TTP, 1.3% SL
Oscillator Bands
This strategy involves the usage of bands or channels that use oscillators as a source input. The main signal for this strategy derives from a cross of the band or channel and a hline of 0. Additionally, this includes a “Directional Filter” and a “MA Filter”. The selections for all of these can be found in the “Signal Options” section of the Input tab.
First option is for Oscillator Choice and includes DPO, CMO, ROC, RSI, TSI, and the Jurik price line. The individual settings for these can be found in the “Oscillator Settings” section. Different channels can be selected for the upper or lower bands, though it is not necessary for them to differ. These current options include Bollinger Bands and Jurik Volatility Bands, the individual settings for each found in the “Band/Channel Settings” section. Next is the MA Filter, of which you can select SMA, EMA, SMMA, WMA, VWMA, KAMA, JMA, or McGinley Dynamic. All options for these settings can be found in the “MA Filter Settings” section. Lastly, the Directional Filters can be selected for either direction like the upper/lower band selection. These filters include the ADX, Bull-Bear Power (BBP), Parabolic SAR (PSAR), or Jurik.
Sample settings for WAVESUSDT using the 20M timeframe:
- Oscillator Choice – DPO (Length – 30, uncentered)
- Upper and Lower Band – JVB Upper/Lower (Jurik Volatility Bands Length – 25; Smoothing – 10)
- MA Filter – VWMA – (MA Length – 40; Source – Open)
- Directional Filter – ADX (ADX Smoothing Long – 14; DI Length Short – 5; ADX Threshold – 22)
- Take Profit/Stop Loss – 0.85% TP, 0.005% TTP, 1.3% SL
Scalping
This strategy heavily relies on the usage of Parabolic SAR, accompanied by a “Directional Filter” (as discussed in the previous section) other than PSAR. This strategy can provide a higher frequency of trades as opposed to the other strategies available, however, it comes with slightly higher risk inherently. A riskier take profit/stop loss spread is recommended here, though risk should always be managed. The settings required for this strategy are all found under the “Directional Settings” section of the strategy inputs.
Sample settings for NEARUSDT using the 20M timeframe:
- Directional Filter set to ADX
- Directional Settings – ADX Smoothing Long (5), DI Length Short (5), ADX Threshold (22), PSAR Start Value (0.02), PSAR Increment (0.005), PSAR Max Value (0.15), PSAR Source (Close)
- Take Profit/Stop Loss – 0.75% TP, 0.005% TTP, 1.5% SL
McGinley Cross
This strategy revolves around the crossing of two McGinley Dynamic lines of varying lengths alongside an ADX filter as well as a DPO filter. McGinley is used as opposed to a standard moving average cross strategy as it adjusts for shifts in market speed and can better gauge market trends. The McGinley length settings can be found with the “MA Filter” settings, labeled as Fast Length and Slow Length. The fast length number should be smaller than the slow length.
Sample settings for SOLUSDT using the 20M timeframe:
- Oscillator Settings – DPO Length (30), uncentered
- MA Filter Settings – McGinley Fast Length (4), McGinley Slow Length (21)
- Take Profit/Stop Loss – 0.85% TP, 0.005% TTP, 1.4% SL
Comprehensive Settings List
Date and Time: From date and to date, adjustable for backtesting purposes.
Signal Options:
Oscillator Choices: Chande Momentum Oscillator (CMO), Detrended Price Oscillator (DPO), Rate of Change (ROC), Relative Strength Index (RSI), True Strength Index (TSI), Jurik Volatility Bands Priceline (JVB) – *** for use with TSI Cross or Oscillator Bands strategies only ***
Upper and Lower Band/Channel Choices: Bollinger Bands (BB) or Jurik Volatility Bands (JVB) -- *** for use with Oscillator Bands strategy only ***
MA/McG Filter: SMA, EMA, RMA, WMA, VWMA, Kaufmann MA, Jurik MA, McGinley Dynamic -- *** for use with Oscillator Bands strategy only ***
Directional Filter Long/Short: Average Directional Index (ADX), Bull/Bear Power (BBP), Parabolic SAR (PSAR), Jurik -- *** for use with Oscillator Bands strategy only ***
Profitview Settings: *** For use with ProfitView extension only, otherwise ignore ***
Oscillator Settings: *** For use with TSI Cross, Oscillator Bands, and McGinley Cross strategies ***
CMO Length, CMO Source – for Chande Momentum Oscillator
DPO Length, DPO Centered – for Detrended Price Oscillator
RoC Length, RoC Source – for Rate of Change
RSI Length, RSI MA Length – for Relative Strength Index
RSI (Stoch) Length, Stochastic Length, Stoch RSI Source, K, D – for Stochastic RSI
TSI Long Length, TSI Short Length, TSI Signal Length – for True Strength Index
Band/Channel Settings: *** For use with Oscillator Bands strategy ***
Jurik Volatility Bands Length, Jurik Volatility Bands Smoothing – for Jurik Volatility Bands
Bollinger Band Length, Bollinger Band Multiplier – for Bollinger Bands
Directional Settings: *** For use with Scalping and Oscillator Bands strategies ***
JVB Price Threshold – for Jurik Volatility as a directional setting
ADX Smoothing Long, DI Length Short, ADX Threshold – for Average Directional Index
PSAR Start Value, PSAR Increment, PSAR Max Value, PSAR Source – for Parabolic SAR
MA Filter Settings: *** For use with Oscillator Bands and McGinley Cross strategies ***
McGinley Fast/Slow Length – for McGinley Dynamic
MA Length, MA Source, MA Offset – for any other moving average
TP and TTP / Stop Loss: *** For use with ALL strategies ***
Long/Short Take Profit % -- for standard take profit settings
Enable Trailing, Trailing Take Profit % -- for trailing settings
Stop Loss % -- for standard stop loss settings; trailing can be enabled or disabled for stop loss
Disclaimers:
Some open-source code has been included -- Jurik Volatility Bands (by "ProValueTrader") and Trailing Take Profit/Stop Loss code (by jason5480). Additional code was used from the TradingView built-ins.
These strategies do NOT guarantee future returns. Apply caution in trading regardless of discretionary or algorithmic. Understand the concepts of risk/reward and the intricacies of each strategy choice before utilizing them in your personal trading.
Invites to the strategy will only be disseminated to those with express consent and knowledge of the invite prior to the action itself.
