Three EMA and Stochastic RSI Signals with TP and SL AlertsThis is kind of similar to one of my other scripts but I figured people might be looking for this one in a simple wrapped up package. It takes 3 EMAs, a 50, 14 and an 8 and the trade signals come from crossovers of the Stochastic RSI lines and conditions that marry up with the EMAs lining up in an uptrend or downtrend condition. I used the TP and SL lines from one of my other scripts so you can see where the winners and losers are. Includes alerts so they can be used with webhooks to automate however you wish. I have added signal confirmation with Weiss Wave Volume on side with trend. Stop and TP Levels are configurable in the settings as well as the periods for the ATR used in these calculations.
Поиск скриптов по запросу "tp"

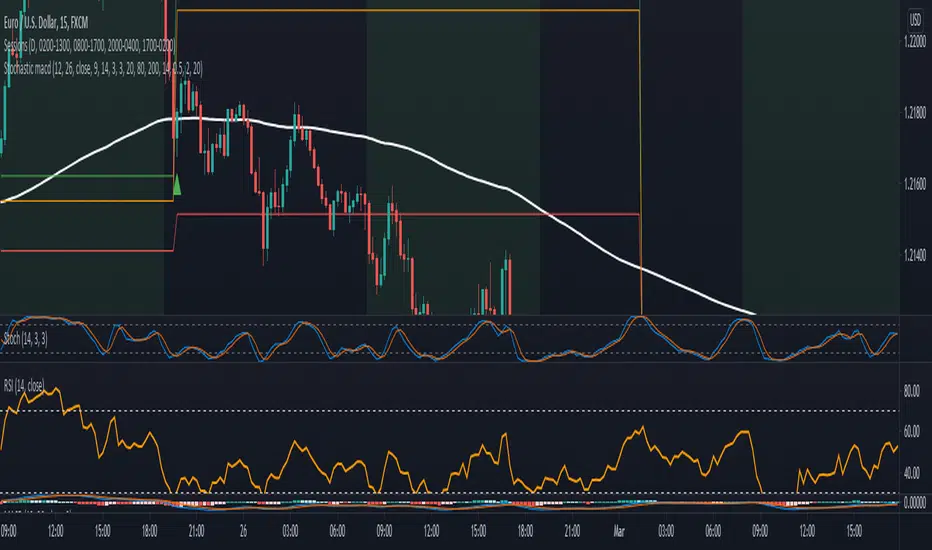
Stochastic with MACD filter + SL/TP + AlertsLong Arrow : close of the candle is above ema + Stochastic is oversold + MACD is below 0 + Stochastic cross up
Short Arrow : close of candle is below ema + Stochastic is overbought + MACD is above 0 + Stochastic cross down
Also added SL, 1:1 and TP where SL can be varied by ATR value and TP is set to 2:1 RR but it can be varied too.
It is not meant to take every single trade even though that might already be profitable.
For higher winrate look for the higher timeframe trend for example when trading the 15min look if the Daily 8ema is going up or down.
Also only take trades when there is either a hidden divergence on RSI or a smaller normal divergence.
The I take the normal divergenes alo when there is no higher high like an M or lower low for longs like a W these tend to work out pretty good too.
Alerts are in it too.
Have Fun :)
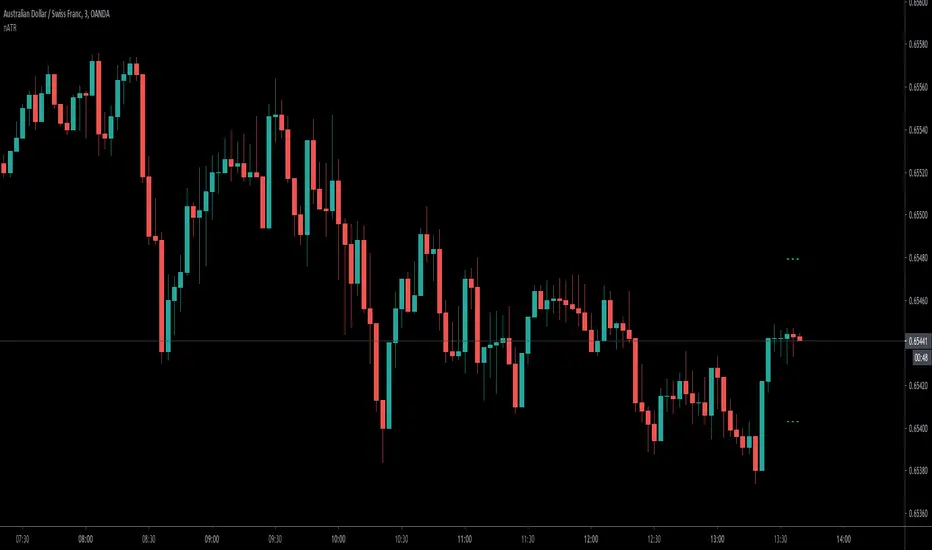
ATR draw on the candle easily setup SL&TPHi,Guys,
Build-in ATR need to read the pips then add on current price to setup safe SL.
But under stress of trading, calculation is not effective.
Input:
Length:Length of ATR
n:n*ATR=Risk
m:m*Risk=TP
the dash line means current price plus n*ATR and minus n*ATR for setup sell or buy stop loss.
If increase m more than 1,you can see the additional line outside the original line in order to setup TP with Reward:Risk more than 1.
Hope you guys enjoy it, and welcome to comment.
Daily Range Zones: PDH/PDL with SL/TPThis indicator automatically plots the previous day's High and Low levels and projects dynamic Stop Loss (SL) and Take Profit (TP) zones based on the daily range percentage.
It is designed for traders focusing on daily range breakouts or mean reversion strategies around the Previous Day High (PDH) and Previous Day Low (PDL).
Key Features:
Level 0 & 1: Visualizes the exact High and Low of the reference timeframe (Daily).
Inner Zone (Orange): Calculated inside the range. Acts as a buffer for Stop Loss placement or entry zones for mean reversion.
Outer Zone (Purple): Calculated outside the range (extension). Acts as a primary Take Profit target for breakout trades.
Settings:
Fully customizable percentages for inner and outer zones.
Option to toggle between current day or previous day data.
Works on any timeframe (intraday charts recommended).

XRP Non-Stop Strategy (TP 25% / SL 15%)This strategy performs continuous automated trading exclusively on XRP. It opens long positions during favorable trend conditions, using a fixed Take Profit target of 25% above the entry price and a fixed Stop Loss of 15% below the entry. Once a trade is closed (either TP or SL), the strategy automatically re-enters on the next valid signal, enabling uninterrupted trading.
The script includes:
Dynamic Take Profit & Stop Loss lines
Optional EMA trend filter
Visual BUY and EXIT markers
TradingView alerts for automation or notifications
This strategy is built for traders who want a simple, price-action-driven system without fixed price levels, relying only on percentage-based movement from each entry.

Crypto Grid 2025+ Long Only (Asym TP)Crypto Grid 2025+ Long Only (Asymmetric Take-Profit) is a long-only mean-reversion grid strategy designed for intraday cryptocurrency trading.
The core idea is to accumulate long positions as price moves downward within a locally defined price range and to exit positions on upward retracements.
The strategy automatically builds a multi-level grid between the highest and lowest price over a user-defined lookback period (“range length”). Each grid level acts as a potential entry point when price crosses it from above.
Key Features
1. Long-only grid logic
The strategy opens long positions only, progressively increasing exposure as price moves into lower grid levels.
2. Asymmetric take-profit mechanism
Instead of taking profit strictly at the next grid level, the strategy allows targeting multiple levels above the entry point. This increases the average profit per winning trade and shifts the reward-to-risk profile toward larger, less frequent wins.
3. Optional partial take-profit
A portion of each trade can be closed at the nearest grid level, while the remainder is held for a more distant asymmetric target. This balances consistency and profit potential.
4. Volume-based market filter
Entries can be restricted to periods of healthy market activity by requiring volume to exceed a moving-average baseline.
5. Capital-scaled position sizing
Position size is determined by risk percentage, grid spacing, and a dynamic sizing mode (original / conservative / aggressive).
6. Built-in risk controls
global stop below the lower boundary of the range,
global take-profit above the upper boundary,
automatic shutdown after a configurable loss-streak.
Market Philosophy
This strategy belongs to the mean-reversion family: it expects short-term overshoots to revert back toward mid-range liquidity zones.
It is not trend-following.
It performs best in choppy, range-bound, or slow-grinding markets — especially on liquid crypto pairs.
Recommended Use Cases
Short timeframes (1–15 minutes)
High-liquidity crypto pairs
Sideways or rotational price action
Exchanges with low fees (due to higher order count)
Not Intended For
Strong trending markets without pullbacks
Assets with thin order books
Use with leverage without additional risk controls
Summary
Crypto Grid 2025+ Long Only (Asymmetric TP) is a refined grid-based mean-reversion strategy optimized for modern crypto markets. Its asymmetric take-profit framework is specifically engineered to reduce the classical issue of “small wins and large occasional losses” found in traditional grid systems, giving it a more favorable long-term trade distribution.

Position Size CalculatorSet TP SL and entry point, over any chart to follow the points without drawing lines

Daily ATR SL/TP Labels on ChartATR-Based Stop Loss & Take Profit Calculator
This script calculates 20% of the Average True Range (ATR) to determine optimal Stop Loss and Take Profit levels. Designed to assist traders in setting precise risk parameters when placing Buy/Sell orders based on daily market volatility.
Key Features:
Computes 20% of ATR value for proportional risk management
Provides dynamic SL/TP levels aligned to current market conditions
Optimised for Daily timeframe analysis to capture full trading day range
Recommended Usage:
Apply on Daily (1D) timeframe for most accurate results, as this captures the complete intraday price movement and provides reliable volatility measurements for position sizing and risk management decisions.

HV Spike Strategy (HVP + OR Breakout + Reversal + TP/SL Modes)Here is a script that I tried to make it simple, although it has several parameters, I will try to explain, here we go:
Logic: Open Range Breakout: otherwise knows as First Candle Rule, usually used for the first candle in the opening of a market session, in my strategy there is an option to use it even for Crypto that operate 24/7, how to do that? Simply by detecting Volatility from the HVP (Historical Volatility Percentile). Then the ORB logic kicks in and the first candle with high volatility gives the ranges for the trades. The proper HVP Activation Threshold has to be selected for each currency pair/index/crypto in order to have maximum profit.
Enter a trade: when the price goes 100% above/below the First Candle Rule Range. That way it is filtering fake breakouts. Also if the price reverses back into the range the strategy takes the opposite trade.
Exit a trade: SL/TP By percentage or ATR, selection in the input menu.
My intention is to avoid using lagging indicators or guessing of Price Action, purely Bull/Bear indication by the first candle.
I hope you find this helpful! Wishing all successful Trades!

σ-Based SL/TP (Long & Short). Statistical Volatility (Quant Upgrade of ATR)
Instead of ATR’s simple moving average, use standard deviation of returns (σ), realized volatility, or implied volatility (options data).
SL = kσ, TP = 2kσ (customizable).
Why better than ATR: more precise reflection of actual distribution tails, not just candle ranges.

AymaN Entry Signal – With HTF + Pin Bar + Multi TP + BE + V1Ayman Entry Signal – Indicator Description
Overview
Ayman Entry Signal – With HTF + Pin Bar + Multi TP + BE + Stats Panel (V1)
This is a professional-grade Pine Script indicator designed for scalping and intraday trading, with full trade management, multi-confirmation logic, and advanced visualization. The tool is ideal for traders focused on XAUUSD (Gold), Forex, and other volatile instruments who seek both precision entries and structured exits with dynamic risk control.
Main Features
Advanced Entry Logic:
- EMA fast/slow crossovers (configurable)
- Optional conditions: Break of Structure (BoS), Order Block (OB), Fair Value Gap (FVG), Liquidity sweeps, Pin Bars
- HTF confirmation using EMA or BoS
- Real-time entry condition display
Trade Management:
- Dynamic calculation of Entry, SL (with ATR buffer), TP1, TP2
- Supports Partial Close and Break Even logic after TP1
- Visual PnL label (dynamic and color-coded)
Statistics Panel:
- Shows total trades, win/loss/breakeven count, cumulative PnL
- Filter by custom date or session
- Fully customizable panel appearance
Trade Visualization:
- Trade box includes all trade levels (Entry, SL, TP1, TP2)
- Visual display of trade conditions and PnL result
- Option to keep previous trades on chart
Alert System:
- Alerts for Buy and Sell entries
- Compatible with webhook automation systems like MT5/MT4
Customization & Inputs
- Capital & risk per trade
- Value per pip/point
- SL buffer (ATR-based)
- Manual EMA override
- Enable/disable: EMA, BoS, OB, FVG, Liquidity, Pin Bars
- HTF: timeframe + confirmation logic
- Trade box/labels visibility
- Full color customization
- PnL label position: top, center, or bottom
Recommended Use
- Ideal for Gold scalping (XAUUSD), also effective for Forex
- Best on 1m–15m charts; use HTF confirmation from 15m–4H
- Pairs well with semi-automated systems using alerts and webhooks
Disclaimer
Note: This is a non-executing indicator. It does not place trades but provides visual and statistical guidance for professional manual or semi-automated trading.

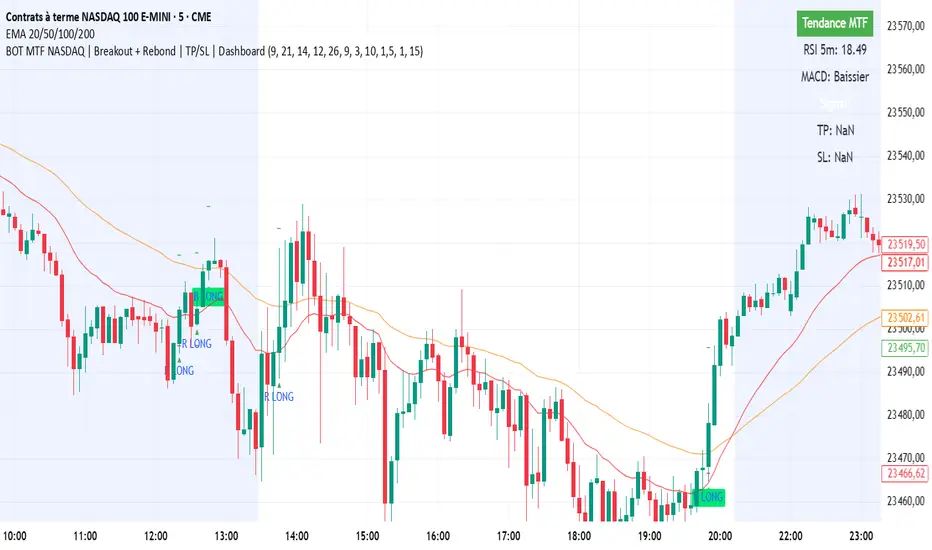
BOT MTF NASDAQ | Breakout + Rebond | TP/SL | DashboardBOT MTF NASDAQ | Breakout + Rebond | TP/SL | Dashboard
High Probability Buy/Sell with SL & TP High-accuracy Buy/Sell signals with dynamic SL & Target—perfect for scalpers and swing traders,Smart trading signals with built-in risk management. Never miss a move.Auto Buy/Sell entries with real-time SL & TP levels—trade with confidence.Turn signals into strategy. Precision entries, clear exits.Your all-in-one trading assistant: entry, stop loss, and take profit—automated.Built for serious traders: Clean signals, sharp exits, and solid risk-reward.

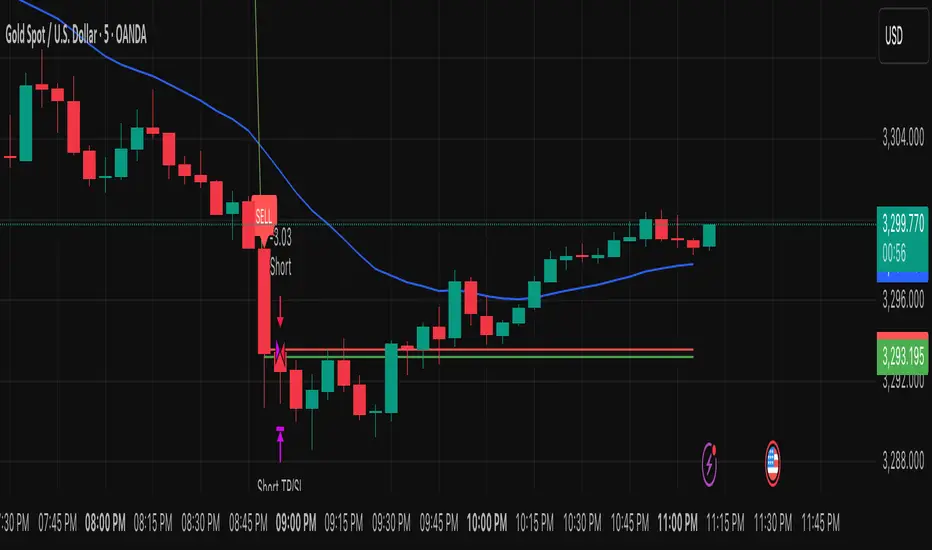
TPC Strategy XAUUSD - M5 with Fixed SL/TPThis script implements a trend-following strategy for XAUUSD on the 5-minute chart, using 200 EMA and 21 EMA to filter direction. Entries are triggered based on RSI, MACD crossovers, and price action alignment. It includes fixed Stop Loss (15 pips) and Take Profit (22.5 pips) with visual SL/TP lines, BUY/SELL labels, and alert conditions for automated notifications. Designed for intraday scalping and low-risk entries during trending conditions.
AltcoinEvreni Entry/TP RR ToolMulti-Entry / Take-Profit Risk-Reward Tool
This indicator is designed to help traders visually plan and manage their trade entries, take-profit targets, stop-loss levels, and risk/reward calculations directly on the chart.
Key Features:
--- Up to 3 customizable entry levels with separate position sizing for each.
--- Up to 5 take-profit (TP) levels, each with individual allocation percentages.
--- Automatic calculation of weighted average entry price.
--- Dynamic risk and potential profit calculation based on your inputs.
--- Visual colored zones for entry, stop-loss, and take-profit areas on the chart.
--- Adjustable leverage and margin for position sizing.
--- Informative floating table displaying position type, entries, stop-loss, risk in $, potential
--- profit in $, and overall RR ratio.
--- Fully customizable appearance (colors, box width, table font size, etc.).
How to Use:
1- Set your trade direction (Long or Short).
2- Enter your planned entry prices, allocation percentages, and stop-loss.
3- Configure your take-profit levels and their respective allocation percentages.
4- Adjust margin, leverage, and visual preferences as desired.
5- The tool will display all relevant zones and statistics, helping you make better risk-managed trading decisions.
Notes:
--- All calculations and drawings update dynamically as you change your parameters.
--- Works on any symbol and timeframe.
--- For educational and planning purposes – always use your own judgment and risk management.

Hammer + EMA Strategy with Tick-based SL/TPWhat This Script Does:
Detects Hammer (bullish reversal) and Inverted Hammer (bearish reversal) patterns
Requires a simple trend context (using 2 bars back)
Confirms price position relative to EMA 50
Applies tick-based SL and TP
Plots buy/sell signals on chart with emoji labels

Range Filter Strategy with ATR TP/SLHow This Strategy Works:
Range Filter:
Calculates a smoothed average (SMA) of price
Creates upper and lower bands based on standard deviation
When price crosses above upper band, it signals a potential uptrend
When price crosses below lower band, it signals a potential downtrend
ATR-Based Risk Management:
Uses Average True Range (ATR) to set dynamic take profit and stop loss levels
Take profit is set at entry price + (ATR × multiplier) for long positions
Stop loss is set at entry price - (ATR × multiplier) for long positions
The opposite applies for short positions
Input Parameters:
Adjustable range filter length and multiplier
Customizable ATR length and TP/SL multipliers
All parameters can be optimized in TradingView's strategy tester
You can adjust the input parameters to fit your trading style and the specific market you're trading. The ATR-based exits help adapt to current market volatility.

Supertrade's RVI Long-Only Strategy with SL/TP (RR 1:3)This strategy, titled "Supertrade’s RVI Long-Only Strategy with SL/TP (RR 1:3)", is designed to capitalize on potential bullish reversals using the Relative Vigor Index (RVI) as its core signal generator. It is best optimized for trading XAUUSD on the 15-minute timeframe , where it has demonstrated favorable historical performance.
The RVI is calculated using a 10-period standard deviation of the closing price, with smoothing applied through a 14-period exponential moving average. This approach helps to distinguish between uptrend and downtrend volatility, allowing the strategy to identify momentum shifts with precision. A long position is triggered when the RVI crosses above the 20 level, suggesting a potential transition from a weak to a stronger bullish phase.
Risk management is embedded through a user-defined stop-loss (default set at 1% below the entry price) and a fixed reward-to-risk ratio of 1:3. This means that for every 1% of capital risked, the strategy targets a 3% gain, maintaining favorable risk-reward dynamics throughout its execution. Once a position is entered, it will exit automatically at either the stop-loss or take-profit level, depending on which is reached first.
This strategy is meant for educational and research purposes only. While it has performed well historically on specific assets and timeframes, past performance is not indicative of future results . Market conditions can change, and no strategy guarantees success in all environments. Please exercise proper risk management and test thoroughly before applying in live markets.

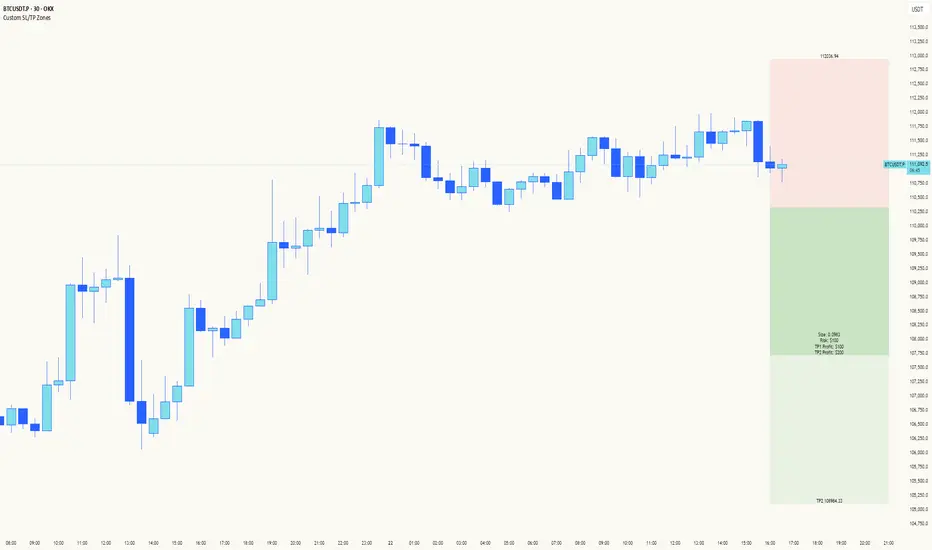
Custom SL/TP ZonesThe "Please Don't Stop Me Now" Indicator 📊
Ever found yourself staring at a chart, thinking "This is DEFINITELY the bottom!" only to watch your stop loss get hit faster than your ex replacing you? Well, this indicator won't stop that from happening, but at least you'll know exactly where you're going to be wrong! 🎯
How it works:
See a setup you like? Pick your candle of choice (make sure it's closed - we're not fortune tellers here)
Hit either Bull or Bear (choose wisely, or don't - we all know it's 50/50 anyway)
3. Marvel at the beautiful boxes showing your:
Take Profit Zone (where you'll exit too early)
Stop Loss Zone (where you'll probably exit, let's be honest)
Features:
Uses ATR for dynamic zones because "one size fits all" only works in disappointing Halloween costumes
Extends 10 bars into the future, giving you plenty of time to watch your prediction go wrong
Price labels included so you know exactly where to set your alerts (and subsequently ignore them)
Customizable multipliers for when you're feeling extra brave (or foolish)
Clean interface that won't distract you from your bad decisions
Remember: The market can stay irrational longer than you can stay solvent, but at least with this indicator, you'll know exactly where your rationality ends and your "This time it's different" begins!
Happy Trading! (Results may vary, tears not included)
Settings:
TP Multiplier: How far to your dreams (Default: 4.0)
SL Multiplier: How far to your nightmares (Default: 2.0)
Bar Offset: Pick your poison (1 = last closed bar)
Colors: Because trading isn't painful enough in grayscale
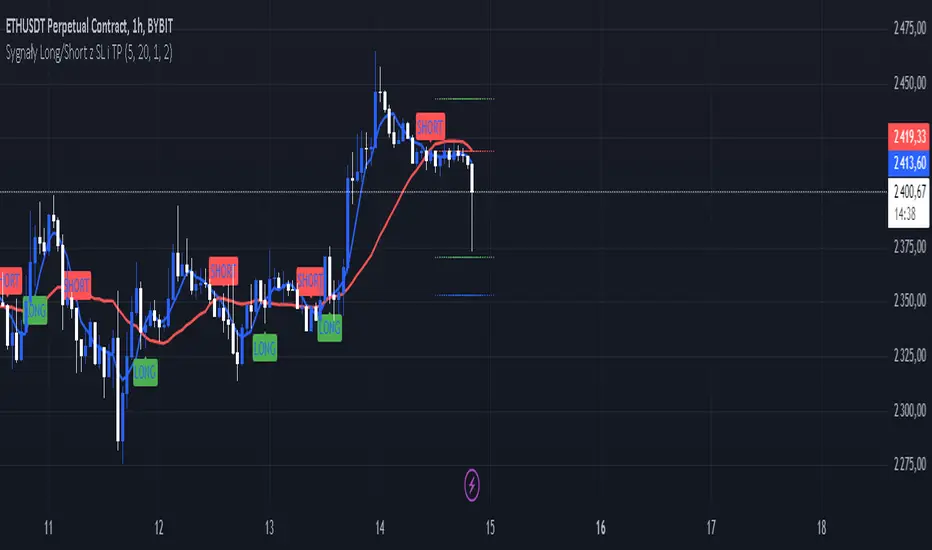
Sygnały Long/Short z SL i TPChoosing the Best Timeframe for Your Trading Strategy
The ideal timeframe for your trading strategy depends on several factors, including your trading style, risk preferences, and the goals of your strategy. Here’s a guide to different timeframes and their applications:
Timeframes and Their Uses:
Short-Term Timeframes (e.g., 5-minute, 15-minute):
Advantages: Provide more frequent signals and allow for quick responses to market changes. Ideal for day traders who prefer short, rapid trades.
Disadvantages: Can generate more false signals and be more susceptible to market noise. Requires more frequent attention and monitoring.
Medium-Term Timeframes (e.g., 1-hour, 4-hour):
Advantages: Offer fewer false signals compared to shorter timeframes. Suitable for swing traders looking to capture short-term trends.
Disadvantages: Fewer signals compared to shorter timeframes. Requires less frequent monitoring.
Long-Term Timeframes (e.g., daily, weekly):
Advantages: Provide more stable signals and are less affected by market noise. Ideal for long-term investors and those trading based on trends.
Disadvantages: Fewer signals, which may be less frequent but more reliable. Requires longer confirmation times.
Recommendation for Your Strategy:
For a strategy based on moving averages (MA) and generating long/short signals, the 5-minute and 15-minute timeframes might be suitable if:
You are a day trader and want to generate multiple signals per day.
You prefer quick responses to price changes and want to execute trades within a shorter timeframe.
For more stable signals and fewer false signals:
1-hour or 4-hour timeframes might be more appropriate.
Testing and Optimization:
Test Different Timeframes: See how your strategy performs on various timeframes to find the one that works best for you.
Adjust Parameters: Modify the lengths of the short and long SMAs, as well as the SL and TP levels, to fit the chosen timeframe.
How to Test:
Add the script to your chart on different timeframes on TradingView.
Observe the effectiveness and accuracy of the signals.
Adjust settings based on results and personal preferences.
Summary:
There isn’t a single “best” timeframe as it depends on your trading style and objectives. Start by testing on shorter timeframes if you are interested in day trading, and then explore how the strategy performs on longer timeframes for more stable signals.
Average SL% Calculator with TP Levels by GorkiAverage Stop Loss And Take Profit Calculator For Futures Trading by Gorki
Description
The "Average SL% Calculator with TP Levels" script, is a simple tool for traders to plan the trades and check how much loss they are going to receive if they run this strategy. This script calculates the average price of up to four entry points, determines the percentage distance to the stop-loss level, and provides potential loss information based on margin and leverage. Additionally, it includes multiple take-profit levels to help traders systematically capture profits. Visual elements such as horizontal lines and labels make it easy to monitor key levels directly on the chart.
Why To Use This Indicator?
Risk Management: Automatically calculates the percentage distance to the stop-loss level, helping you to understand potential losses.
Profit Optimization: Supports up to four take-profit levels, enabling a structured approach to capturing gains.
Visual Clarity: Displays key levels and important information directly on the chart for easy monitoring.
Alerts: Generates alerts when the price crosses specified levels, ensuring you never miss critical trading signals.
How to Use the Script
Add the Script to Your Chart: Apply the script to your TradingView chart.
Set Input Values: Entry Points: Define up to four limit prices (LIMIT 1, LIMIT 2, LIMIT 3, LIMIT 4).
Stop-Loss: Set your stop-loss price (STOP LOSS).
Take Profits: Specify up to four take-profit levels (Take Profit 1, Take Profit 2, Take Profit 3, Take Profit 4).
Leverage: Input your leverage factor.
Margin: Enter the total margin amount for the trade.
View Calculations: The script will calculate the average entry price, the percentage distance to the stop-loss, and the potential loss based on margin and leverage.
Monitor Levels: Horizontal lines and labels will appear on the chart, showing entry points, stop-loss, and take-profit levels.
Set Alerts: Alerts will trigger when the price crosses your defined levels, helping you to take timely action.
Calculation Details
Average Price: Calculated as the mean of the specified limit prices.
Distance to Stop-Loss: Determined as the percentage difference between the average price and the stop-loss level.
Leveraged Distance: The stop-loss distance percentage multiplied by the leverage factor.
Potential Loss: Calculated by applying the leveraged distance percentage to the margin amount.
Take Profit Percentages: The percentage difference between the average price and each take-profit level.
This comprehensive indicator is a must-have for any trader looking to manage risks effectively while maximizing potential profits. Happy trading!

Zone TP SL [By Gone]It creates a price zone for TP 3 Level, increasing from the price by 500 points and setting an SL zone of 500 points of the price.
You must enter the price range yourself, recommended to be 500 points apart.
1. select Type Bay And Sell
2. Input Price Start And End
suitable for gold
Made to help with hitting the price zone. For use in making decisions about trading.

Trend Signals with TP & SL [UAlgo]The "Trend Signals with TP & SL " indicator is a versatile tool designed to assist traders in identifying potential trend continuation opportunities within financial markets Utilizing a combination of technical indicators and user-defined parameters, this indicator aims to provide clear and actionable signals to aid traders in making informed trading decisions.
🔶 Features:
Trend Continuation Signals : The indicator generates signals to identify potential trend continuation points based on the input parameters such as sensitivity, ATR length, and cloud moving average length.
Take-Profit and Stop-Loss Levels: It calculates and plots three levels of take-profit (1R, 2R, 3R) and stop-loss levels based on the entry price of the trade.
Short Position Example:
Long Position Example:
Visualization: The script visualizes the trend signals, entry points, take-profit levels, and stop-loss levels on the price chart, making it easier for traders to interpret the signals.
Alert System: The indicator includes an alert system that notifies the user when there is a change in trend direction or when a buy/sell signal is generated. The alerts provide essential information such as entry price, take-profit levels, and stop-loss levels.
🔶 Calculations :
Trend Calculation: Trend signals are determined based on the comparison between the current closing price and the upper and lower bounds calculated using the Average True Range (ATR) multiplied by a sensitivity factor. A trend is considered bullish if the closing price is above the upper bound and bearish if it's below the lower bound.
Entry, Stop Loss, and Take Profit Calculation: Entry points for long and short positions are identified when there's a change in trend direction.
Stop-loss levels are calculated as a percentage of the entry price, where users can define the percentage based on their risk tolerance.
Take-profit levels are calculated as multiples of the stop-loss level (1R, 2R, 3R).
Cloud Moving Averages: Simple moving averages (SMAs) are calculated for high and low prices over a specified period to create a "cloud" visualization on the chart.
MACD Clouds: Moving Average Convergence Divergence (MACD) indicator is used to determine the market's momentum and trend direction. Positive and negative clouds are plotted based on the MACD line and its signal line, indicating potential bullish or bearish trends.
Signal Generation: Buy and sell signals are generated based on specific conditions such as RSI, CMO (Chande Momentum Oscillator), and pivot points.
Signals are triggered when certain criteria are met, indicating potential opportunities for entering or exiting trades.
🔶 Disclaimer:
Use at Your Own Risk: Trading involves significant risk, and this script is provided for educational and informational purposes only. It does not guarantee profitable trades, and users should exercise caution and perform their own analysis before making trading decisions.
Parameter Sensitivity: The effectiveness of the indicator may vary depending on the chosen parameters, market conditions, and timeframe. Users are encouraged to backtest the script thoroughly and adjust the parameters according to their trading preferences.
Not Financial Advice: The information provided by this script should not be considered as financial advice. Users are solely responsible for their trading decisions and should consult with a qualified financial advisor if needed.
Backtesting and Validation: Before implementing this indicator in live trading, users are strongly encouraged to conduct rigorous backtesting and validation to assess its performance under various market conditions. Past performance is not indicative of future results, and users should carefully evaluate the effectiveness of the indicator based on their individual trading preferences and risk tolerance.
