Multi-Market Swing Trader Webhook Ready [HullBuster]
Introduction
This is an all symbol swing trading strategy intended for webhook integration to live accounts. This script employs an adjustable bandwidth ping pong algorithm which can be run in long only, short only or bidirectional modes. Additionally, this script provides advanced features such as pyramiding and DCA. It has been in development for nearly three years and exposes over 90 inputs to accommodate varying risk reward ratios. Equipped with a proper configuration it is suitable for professional traders seeking quality trades from a cloud based platform. This is my most advanced Pine Script to date which combines my RangeV3 and TrendV2 scripts. Using this combination it tries to bridge the gap between range bound and trending markets. I have put a lot of time into creating a system that could transition by itself so as to require less human intervention and thus be able to withstand long periods in full automation mode.
As a Pine strategy, hypothetical performance can be easily back-tested. Allowing you to Iron out the configuration of your target instrument. Now with recent advancements from the Pine development team this same script can be connected to a webhook through the alert mechanism. The requirement of a separate study script has been completely removed. This really makes things a lot easier to get your trading system up and running. I would like to also mention that TradingView has made significant advancements to the back-end over the last year. Notably, compile times are much faster now permitting more complex algorithms to be implemented. Thank you TradingView!
I used QuantConnect as my role model and strived to produce a base script which could compete with higher end cloud based platforms while being attractive to similarly experienced traders. The versatility of the Pine Language combined with the greater selection of end point execution systems provides a powerful alternative to other cloud based platforms. At the very least, with the features available today, a modular trading system for everyday use is a reality. I hope you'll agree.
This is a swing trading strategy so the behavior of this script is to buy on weakness and sell on strength. In trading parlance this is referred to as Support and Resistance Trading. Support being the point at which prices stop falling and start rising. Resistance being the point at which prices stop rising and fall. The chart real estate between these two points being defined as the range. This script seeks to implement strategies to profit from placing trades within this region. Short positions at resistance and long positions at support. Just to be clear, the range as well as trends are merely illusions as the chart only receives prices. However, this script attempts to calculate pivot points from the price stream. Rising pivots are shorts and falling pivots are longs. I refer to pivots as a vertex in this script which adds structural components to the chart formation (point, sides and a base). When trading in “Ping Pong” mode long and short positions are interleaved continuously as long as there exists a detectable vertex.
This is a non-hedging script so those of us subject to NFA FIFO Rule 2-43(b) should be generally safe to webhook into signals emitted from this script. However, as covered later in this document, there are some technical limitations to this statement. I have tested this script on various instruments for over two years and have configurations for forex, crypto and stocks. This script along with my TrendV2 script are my daily trading vehicles as a webhook into my forex and crypto accounts. This script employs various high risk features that could wipe out your account if not used judiciously. You should absolutely not use this script if you are a beginner or looking for a get-rich-quick strategy. Also please see my CFTC RULE 4.41 disclosure statement at the end of the document. Really!
Does this script repaint? The short answer is yes, it does, despite my best efforts to the contrary. EMAs are central to my strategy and TradingView calculates from the beginning of the series so there is just no getting around this. However, Pine is improving everyday and I am hopeful that this issue will be address from an architectural level at some point in the future. I have programmed my webhook to compensate for this occurrence so, in the mean time, this my recommended way to handle it (at the endpoint and before the broker).
Design
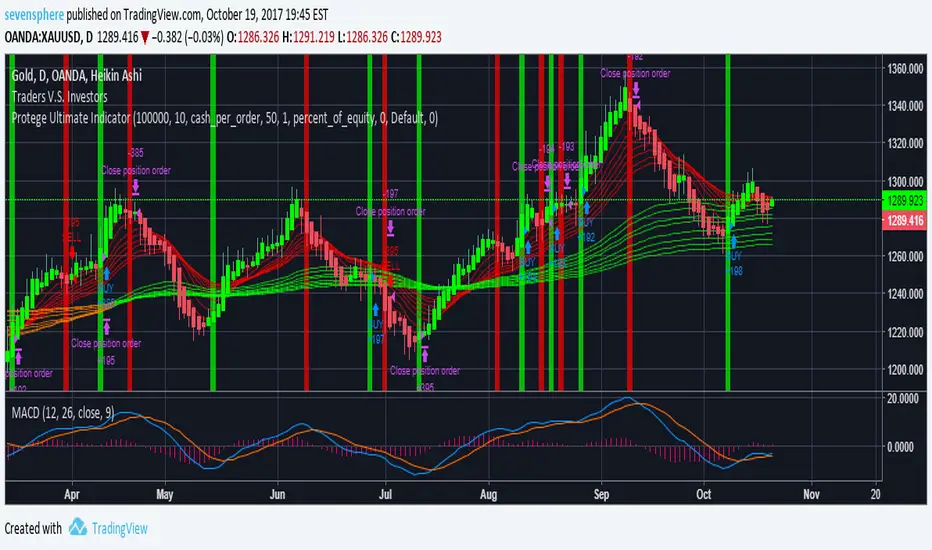
This strategy uses a ping pong algorithm of my own design. Basically, trades bounce off each other along the price stream. Trades are produced as a series of reversals. The point at which a trade reverses is a pivot calculation. A measurement is made between the recent valley to peak which results in a standard deviation value. This value is an input to implied probability calculation.Yes, the same implied probability used in sports betting. Odds are then calculated to determine the likelihood of price action continuing or retracing to the pivot. Based on where the account is at alert time, the action could be an entry, take profit or pyramid signal. In this design, trades must occur in alternating sequence. A long followed by a short then another long followed by a short and so on. In range bound price action trades appear along the outer bands of the channel in the aforementioned sequence. Shorts on the top and longs at the bottom. Generally speaking, the widths of the trading bands can be adjusted using the vertex dynamics in Section 2. There are a dozen inputs in this section used to describe the trading range. It is not a simple adjustment. If pyramids are enabled the strategy overrides the ping pong reversal pattern and begins an accumulation sequence. In this case you will see a series of same direction trades.
This script uses twelve indicators on a single time frame. The original trading algorithms are a port from a C++ program on proprietary trading platform. I’ve converted some of the statistical functions to use standard indicators available on TradingView. The setups make heavy use of the Hull Moving Average in conjunction with EMAs that form the Bill Williams Alligator as described in his book “New Trading Dimensions” Chapter 3. Lag between the Hull and the EMAs play a key role in identifying the pivot points. I really like the Hull Moving Average. I use it in all my systems, including 3 other platforms. It’s is an excellent leading indicator and a relatively light calculation.
The trend detection algorithms rely on several factors:
1. Smoothed EMAs in a Willams Alligator pattern.
2. Number of pivots encountered in a particular direction.
3. Which side debt is being incurred.
4. Settings in Section 4 and 5 (long and short)
The strategy uses these factors to determine the probability of prices continuing in the most recent direction. My TrendV2 script uses a higher time frame to determine trend direction. I can’t use that method in this script without exceeding various TradingView limitations on code size. However, the higher time frame is the best way to know which trend is worth pursuing or better to bet against.
The entire script is around 2400 lines of Pine code which pushes the limits of what can be created on this platform given the TradingView maximums for: local scopes, run-time duration and compile time. The module has been through numerous refactoring passes and makes extensive use of ternary statements. As such, It takes a full minute to compile after adding it to a chart. Please wait for the hovering dots to disappear before attempting to bring up the input dialog box. Scrolling the chart quickly may bring up an hour glass.
Regardless of the market conditions: range or trend. The behavior of the script is governed entirely by the 91 inputs. Depending on the settings, bar interval and symbol, you can configure a system to trade in small ranges producing a thousand or more trades. If you prefer wider ranges with fewer trades then the vertex detection settings in Section 2 should employ stiffer values. To make the script more of a trend follower, adjustments are available in Section 4 and 5 (long and short respectively). Overall this script is a range trader and the setups want to get in that way. It cannot be made into a full blown trend trading system. My TrendV2 is equipped for that purpose. Conversely, this script cannot be effectively deployed as a scalper either. The vertex calculation require too much data for high frequency trading. That doesn’t work well for retail customers anyway. The script is designed to function in bar intervals between 5 minutes and 4 hours. However, larger intervals require more backtest data in order to create reliable configurations. TradingView paid plans (Pro) only provide 10K bars which may not be sufficient. Please keep that in mind.
The transition from swing trader to trend follower typically happens after a stop is hit. That means that your account experiences a loss first and usually with a pyramid stack so the loss could be significant. Even then the script continues to alternate trades long and short. The difference is that the strategy tries to be more long on rising prices and more short on falling prices as opposed to simply counter trend trading. Otherwise, a continuous period of rising prices results in a distinctly short pyramid stack. This is much different than my TrendV2 script which stays long on peaks and short on valleys. Basically, the plan is to be profitable in range bound markets and just lose less when a trend comes along. How well this actually plays out will depend largely on the choices made in the sectioned input parameters.
Sections
The input dialog for this script contains 91 inputs separated into six sections.
Section 1: Global settings for the strategy including calculation model, trading direction, exit levels, pyramid and DCA settings. This is where you specify your minimum profit and stop levels. You should setup your Properties tab inputs before working on any of the sections. It’s really important to get the Base Currency right before doing any work on the strategy inputs. It is important to understand that the “Minimum Profit” and “Limit Offset” are conditional exits. To exit at a profit, the specified value must be exceeded during positive price pressure. On the other hand, the “Stop Offset” is a hard limit.
Section 2: Vertex dynamics. The script is equipped with four types of pivot point indicators. Histogram, candle, fractal and transform. Despite how the chart visuals may seem. The chart only receives prices. It’s up to the strategy to interpret patterns from the number stream. The quality of the feed and the symbol’s bar characteristics vary greatly from instrument to instrument. Each indicator uses a fundamentally different pattern recognition algorithm. Use trial and error to determine the best fit for your configuration. After selecting an indicator type, there are eight analog fields that must be configured for that particular indicator. This is the hardest part of the configuration process. The values applied to these fields determine how the range will be measured. They have a big effect on the number of trades your system will generate. To see the vertices click on the “Show Markers” check box in this section. Red markers are long positions and blue markers are short. This will give you an idea of where trades will be placed in natural order.
Section 3: Event thresholds. Price spikes are used to enter and exit trades. The magnitude which define these spikes are configured here. The rise and fall events are primarily for pyramid placement. The rise and fall limits determine the exit threshold for the conditional “Limit Offset” field found in Section 1. These fields should be adjusted one at a time. Use a zero value to disengage every one but the one you are working on. Use the fill colors found in Section 6 to get a visual on the values applied to these fields. To make it harder for pyramids to enter stiffen the Event values. This is more of a hack as the formal pyramid parameters are in Section 1.
Section 4 and 5: Long and short settings. These are mirror opposite settings with all opposing fields having the same meaning. Its really easy to introduce data mining bias into your configuration through these fields. You must combat against this tendency by trying to keep your settings as uniform as possible. Wildly different parameters for long and short means you have probably fitted the chart. There are nine analog and thirteen Boolean fields per trade direction. This section is all about how the trades themselves will be placed along the range defined in Section 2. Generally speaking, more restrictive settings will result in less trades but higher quality. Remember that this strategy will enter long on falling prices and short on rising prices. So getting in the trade too early leads to a draw-down. However, this could be what you want if pyramiding is enabled. I, personally, have found that the best configurations come from slightly skewing one side. I just accept that the other side will be sub-par.
Section 6: Chart rendering. This section contains one analog and four Boolean fields. More or less a diagnostic tool. Of particular interest is the “Symbol Debt Sequence” field. This field contains a whole number which paints regions that have sustained a run of bad trades equal or greater than specified value. It is useful when DCA is enabled. In this script Dollar Cost Averaging on new positions continues only until the symbol debt is recouped. To get a better understanding on how this works put a number in this field and activate DCA. You should notice how the trade size increases in the colored regions. The “Summary Report” checkbox displays a blue information box at the live end of the chart. It exposes several metrics which you may find useful if manually trading this strategy from audible alerts or text messages.
Pyramids
This script features a downward pyramiding strategy which increases your position size on losing trades. On purely margin trades, this feature can be used to, hypothetically, increase the profit factor of positions (not individual trades). On long only markets, such as crypto, you can use this feature to accumulate coins at depressed prices. The way it works is the stop offset, applied in the Section 1 inputs, determines the maximum risk you intend to bear. Additional trades will be placed at pivot points calculated all the way down to the stop price. The size of each add on trade is increased by a multiple of its interval. The maximum number of intervals is limited by the “Pyramiding” field in the properties tab. The rate at which pyramid positions are created can be adjusted in Section 1. To see the pyramids click on the “Mark Pyramid Levels” check box in the same section. Blue triangles are painted below trades other than the primary.
Unlike traditional Martingale strategies, the result of your trade is not dependent on the profit or loss from the last trade. The position must recover the R1 point in order to close. Alternatively, you can set a “Pyramid Bale Out Offset” in Section 1 which will terminate the trade early. However, the bale out must coincide with a pivot point and result in a profitable exit in order to actually close the trade. Should the market price exceed the stop offset set in Section 1, the full value of the position, multiplied by the accepted leverage, will be realized as a loss to the trading account. A series of such losses will certainly wipe out your account.
Pyramiding is an advanced feature intended for professional traders with well funded accounts and an appropriate mindset. The availability of this feature is not intended to endorse or promote my use of it. Use at your own risk (peril).
DCA
In addition to pyramiding this script employs DCA which enables users to experiment with loss recovery techniques. This is another advanced feature which can increase the order size on new trades in response to stopped out or winning streak trades. The script keeps track of debt incurred from losing trades. When the debt is recovered the order size returns to the base amount specified in the properties tab. The inputs for this feature are found in section 3 and include a limiter to prevent your account from depleting capital during runaway markets. The main difference between DCA and pyramids is that this implementation of DCA applies to new trades while pyramids affect open positions. DCA is a popular feature in crypto trading but can leave you with large “bags” if your not careful. In other markets, especially margin trading, you’ll need a well funded account and much experience.
To be sure pyramiding and dollar cost averaging is as close to gambling as you can get in respectable trading exchanges. However, if you are looking to compete in a spot trading contest or just want to add excitement to your trading life style those features could find a place in your strategies. Although your backtest may show spectacular gains don’t expect your live trading account to do the same. Every backtest has some measure of data mining bias. Please remember that.
Webhook Integration
The TradingView alerts dialog provides a way to connect your script to an external system which could actually execute your trade. This is a fantastic feature that enables you to separate the data feed and technical analysis from the execution and reporting systems. Using this feature it is possible to create a fully automated trading system entirely on the cloud. Of course, there is some work to get it all going in a reliable fashion. To that end this script has several things going for it. First off, it is a strategy type script. That means that the strategy place holders such as {{strategy.position_size}} can be embedded in the alert message text. There are more than 10 variables which can write internal script values into the message for delivery to the specified endpoint. Additionally, my scripts output the current win streak and debt loss counts in the {{strategy.order.alert_message}} field. Depending on the condition, this script will output other useful values in the JSON “comment” field of the alert message. Here is an excerpt of the fields I use in my webhook signal:
"broker_id": "kraken",
"account_id": "XXX XXXX XXXX XXXX",
"symbol_id": "XMRUSD",
"action": "{{strategy.order.action}}",
"strategy": "{{strategy.order.id}}",
"lots": "{{strategy.order.contracts}}",
"price": "{{strategy.order.price}}",
"comment": "{{strategy.order.alert_message}}",
"timestamp": "{{time}}"
Though TradingView does a great job in dispatching your alert this feature does come with a few idiosyncrasies. Namely, a single transaction call in your script may cause multiple transmissions to the endpoint. If you are using placeholders each message describes part of the transaction sequence. A good example is closing a pyramid stack. Although the script makes a single strategy.close() call, the endpoint actually receives a close message for each pyramid trade. The broker, on the other hand, only requires a single close. The incongruity of this situation is exacerbated by the possibility of messages being received out of sequence. Depending on the type of order designated in the message, a close or a reversal. This could have a disastrous effect on your live account. This broker simulator has no idea what is actually going on at your real account. Its just doing the job of running the simulation and sending out the computed results. If your TradingView simulation falls out of alignment with the actual trading account lots of really bad things could happen. Like your script thinks your are currently long but the account is actually short. Reversals from this point forward will always be wrong with no one the wiser. Human intervention will be required to restore congruence. But how does anyone find out this is occurring? In closed systems engineering this is known as entropy. In practice your webhook logic should be robust enough to detect these conditions. Be generous with the placeholder usage and give the webhook code plenty of information to compare states. Both issuer and receiver. Don’t blindly commit incoming signals without verifying system integrity.
Operation
This is a swing trading strategy so the fundamental behavior of this script is to buy on weakness and sell on strength. As such trade orders are placed in a counter direction to price pressure. What you will see on the chart is a short position on peaks and a long position on valleys. This is slightly misleading since a range as well as a trend are best recognized, in hindsight, after the patterns occur on the chart. In the middle of a trade, one never knows how deep valleys will drop or how high peaks will rise. For certain, long trades will continue to trigger as the market prices fall and short trades on rising prices. This means that the maximum efficiency of this strategy is achieved in choppy markets where the price doesn’t extend very far from its adjacent pivot point. Conversely, this strategy will be the least efficient when market conditions exhibit long continuous single direction price pressure. Especially, when measured in weeks. Translation, the trend is not your friend with this strategy. Internally, the script attempts to recognize prolonged price pressure and changes tactics accordingly. However, at best, the goal is to weather the trend until the range bound market returns. At worst, trend detection fails and pyramid trades continue to be placed until the limit specified in the Properties tab is reached. In all likelihood this could trigger a margin call and if it hits the stop it could wipe out your account.
This script has been in beta test four times since inception. During all that time no one has been successful in creating a configuration from scratch. Most people give up after an hour or so. To be perfectly honest, the configuration process is a bear. I know that but there is no way, currently, to create libraries in Pine. There is also no way specify input parameters other than the flattened out 2-D inputs dialog. And the publish rules clearly state that script variations addressing markets or symbols (suites) are not permitted. I suppose the problem is systemic to be-all-end-all solutions like my script is trying to be. I needed a cloud strategy for all the symbols that I trade and since Pine does not support library modules, include files or inter process communication this script and its unruly inputs are my weapon of choice in the war against the market forces. It takes me about six hours to configure a new symbol. Also not all the symbols I configure are equally successful. I should mention that I have a facsimile of this strategy written in another platform which allows me to run a backtest on 10 years of historical data. The results provide me a sanity check on the inputs I select on this platform.
My personal configurations use a 10 minute bar interval on forex instruments and 15 minutes on crypto. I try to align my TradingView scripts to employ standard intervals available from the broker so that I can backtest longer durations than those available on TradingView. For example, Bitcoin at 15 minute bars is downloadable from several sources. I really like the 10 minute bar. It provides lots of detectable patterns and is easy to store many years in an SQL database.
The following steps provide a very brief set of instructions that will get you started but will most certainly not produce the best backtest. A trading system that you are willing to risk your hard earned capital will require a well crafted configuration that involves time, expertise and clearly defined goals. As previously mentioned, I have several example configurations that I use for my own trading that I can share with you if you like. To get hands on experience in setting up your own symbol from scratch please follow the steps below.
Step 1. Setup the Base currency and order size in the properties tab.
Step 2. Select the calculation presets in the Instrument Type field.
Step 3. Select “No Trade” in the Trading Mode field
Step 4. Select the Histogram indicator from Section 2. You will be experimenting with different ones so it doesn’t matter which one you try first.
Step 5. Turn on Show Markers in Section 2.
Step 6. Go to the chart and checkout where the markers show up. Blue is up and red is down. Long trades show up along the red markers and short trades on the blue.
Step 7. Make adjustments to “Base To Vertex” and “Vertex To Base” net change and ROC in Section 2. Use these fields to move the markers to where you want trades to be.
Step 8. Try a different indicator from Section 2 and repeat Step 7 until you find the best match for this instrument on this interval. This step is complete when the Vertex settings and indicator combination produce the most favorable results.
Step 9. Go to Section 4 and enable “Apply Red Base To Base Margin”.
Step 10. Go to Section 5 and enable “Apply Blue Base To Base Margin”.
Step 11. Go to Section 2 and adjust “Minimum Base To Base Blue” and “Minimum Base To Base Red”. Observe the chart and note where the markers move relative to each other. Markers further apart will produce less trades but will reduce cutoffs in “Ping Pong” mode.
Step 12. Turn off Show Markers in Section 2.
Step 13. Put in your Minimum Profit and Stop Loss in the first section. This is in pips or currency basis points (chart right side scale). Percentage is not currently supported. Note that the profit is taken as a conditional exit on a market order not a fixed limit. The actual profit taken will almost always be greater than the amount specified. The stop loss, on the other hand, is indeed a hard number which is executed by the TradingView broker simulator when the threshold is breached.
Step 14. Return to step 3 and select a Trading Mode (Long, Short, BiDir, Ping Pong). If you are planning to trade bidirectionally its best to configure long first then short. Combine them with “BiDir” or “Ping Pong” after setting up both sides of the trade individually. The difference between “BiDir” and “Ping Pong” is that “Ping Pong” uses position reversal and can cut off opposing trades less than the specified minimum profit. As a result “Ping Pong” mode produces the greatest number of trades.
Step 15. Take a look at the chart. Trades should be showing along the markers plotted earlier.
Step 16. Make adjustments to the Vertex fields in Section 2 until the TradingView performance report is showing a profit. This includes the “Minimum Base To Base” fields. If a profit cannot be achieved move on to Step 17.
Step 17. Improve the backtest profitability by adjusting the “Entry Net Change” and “Entry ROC” in Section 4 and 5.
Step 18. Enable the “Mandatory Snap” checkbox in Section 4 and 5 and adjust the “Snap Candle Delta” and “Snap Fractal Delta” in Section 2. This should reduce some chop producing unprofitable reversals.
Step 19. Increase the distance between opposing trades by adding an “Interleave Delta” in Sections 4 and 5. This is a floating point value which starts at 0.01 and typically does not exceed 2.0.
Step 20. Increase the distance between opposing trades even further by adding a “Decay Minimum Span” in Sections 4 and 5. This is an absolute value specified in the symbol’s quote currency (right side scale of the chart). This value is similar to the minimum profit and stop loss fields in Section 1.
Step 21. The “Buy Composite Strength” input works in tandem with “Long Decay Minimum Span” in Section 4. Try enabling and see if it improves the performance. This field is only relevant when there is a value in “Long Decay Minimum Span”.
Step 22. The “Sell Composite Weakness” input works in tandem with “Short Decay Minimum Span” in Section 5. Try enabling and see if it improves the performance. This field is only relevant when there is a value in “Short Decay Minimum Span”.
Step 23. Improve the backtest profitability by adjusting the “Adherence Delta” in Section 4 and 5. This field requires the “Adhere to Rising Trend” checkbox to be enabled.
Step 24. At this point your strategy should be more or less working. Experiment with the remaining check boxes in Section 4 and 5. Keep the ones which seem to improve the performance.
Step 25. Examine the chart and see that trades are being placed in accordance with your desired trading goals. This is an important step. If your desired model requires multiple trades per day then you should be seeing hundreds of trades on the chart. Alternatively, you may be looking to trade fewer steep peaks and deep valleys in which case you should see trades at major turning points. Don’t simply settle for what the backtest serves you. Work your configuration until the system aligns with your desired model. Try changing indicators and even intervals if you cannot reach your simulation goals. Generally speaking, the histogram and Candle indicators produce the most trades. The Fractal indicator captures the tallest peaks and valleys. The Transform indicator is the most reliable but doesn’t well work on all instruments.
Example Settings
To reproduce the performance shown on the chart please use the following configuration:
1. Select XBTUSD Kraken as the chart symbol.
2. On the properties tab set the Order Size to: 0.01 Bitcoin
3. On the properties tab set the Pyramiding to: 10
4. In Section 1: Select “Forex” for the Instrument Type
5. In Section 1: Select “Ping Pong” for the Trading Mode
6. In Section 1: Input 1200 for the Minimum Profit
7. In Section 1: Input 15000 for the Stop Offset
8. In Section 1: Input 1200 for the Pyramid Minimum Span
9. In Section 1: Check mark the Ultra Wide Pyramids
10. In Section 2: Check mark the Use Transform Indicator
So to be clear, I used a base position size of one - one hundredth of a Bitcoin and allow the script to add up to 10 downward pyramids. The example back-test did hit eight downward pyramids. That means the account would have to be able to withstand a base position size (0.01) times 28. The resulting position size is 0.28 of a Bitcoin. If the price of Bitcoin is 35K then the draw down amount (not including broker fees) would be $9800 dollars. Since I have a premium subscription my backtest chart includes 20K historical bars. That's roughly six months of data. As of today, pro accounts only get 10K bars so the performance cannot be exactly matched with such a difference in historical data. Please keep that in mind.
There are, of course, various ways to reduce the risk incurred from accumulating pyramids. You can increase the “Pyramid Minimum Span” input found in Section 2 which increases the space between each pyramid trade. Also you can set a “Pyramid Bale Out Offset” in the same input section. This lets you out of the trade faster on position recovery. For example: Set a value of 8000 into this input and the number of trades increase to 178 from 157. Since the positions didn’t go full term, more trades were created at less profit each. The total brute force approach would be to simply limit the number of pyramids in the Properties tab.
It should be noted that since this is crypto, accumulating on the long side may be what you want. If you are not trading on margin and thus outright buying coins on the Kraken exchange you likely are interested in increasing your Bitcoin position at depressed prices. This is a popular feature on some of the other crypto trading packages like CryptoHopper and Profit Trailer. Click on Enable TV Long Only Rule in Section 1. This switches the signal emitter to long only. However, you may still see short trades on the chart. They are treated as a close instead of a reversal.
Feel free to PM me with any questions related to this script. Thank you and happy trading!
CFTC RULE 4.41
These results are based on simulated or hypothetical performance results that have certain inherent limitations. Unlike the results shown in an actual performance record, these results do not represent actual trading. Also, because these trades have not actually been executed, these results may have under-or over-compensated for the impact, if any, of certain market factors, such as lack of liquidity. Simulated or hypothetical trading programs in general are also subject to the fact that they are designed with the benefit of hindsight. No representation is being made that any account will or is likely to achieve profits or losses similar to these being shown.
Поиск скриптов по запросу "track"

(IK) Base Break BuyThis strategy first calculates areas of support (bases), and then enters trades if that support is broken. The idea is to profit off of retracement. Dollar-cost-averaging safety orders are key here. This strategy takes into account a .1% commission, and tests are done with an initial capital of 100.00 USD. This only goes long.
The strategy is highly customizable. I've set the default values to suit ETH/USD 15m. If you're trading this on another ticker or timeframe, make sure to play around with the settings. There is an explanation of each input in the script comments. I found this to be profitable across most 'common sense' values for settings, but tweaking led to some pretty promising results. I leaned more towards high risk/high trade volume.
Always remember though: historical performance is no guarantee of future behavior . Keep settings within your personal risk tolerance, even if it promises better profit. Anyone can write a 100% profitable script if they assume price always eventually goes up.
Check the script comments for more details, but, briefly, you can customize:
-How many bases to keep track of at once
-How those bases are calculated
-What defines a 'base break'
-Order amounts
-Safety order count
-Stop loss
Here's the basic algorithm:
-Identify support.
--Have previous candles found bottoms in the same area of the current candle bottom?
--Is this support unique enough from other areas of support?
-Determine if support is broken.
--Has the price crossed under support quickly and with certainty?
-Enter trade with a percentage of initial capital.
-Execute safety orders if price continues to drop.
-Exit trade at profit target or stop loss.
Take profit is dynamic and calculated on order entry. The bigger the 'break', the higher your take profit percentage. This target percentage is based on average position size, so as safety orders are filled, and average position size comes down, the target profit becomes easier to reach.
Stop loss can be calculated one of two ways, either a static level based on initial entry, or a dynamic level based on average position size. If you use the latter (default), be aware, your real losses will be greater than your stated stop loss percentage . For example:
-stop loss = 15%, capital = 100.00, safety order threshold = 10%
-you buy $50 worth of shares at $1 - price average is $1
-you safety $25 worth of shares at $0.9 - price average is $0.966
-you safety $25 worth of shares at $0.8. - price average is $0.925
-you get stopped out at 0.925 * (1-.15) = $0.78625, and you're left with $78.62.
This is a realized loss of ~21.4% with a stop loss set to 15%. The larger your safety order threshold, the larger your real loss in comparison to your stop loss percentage, and vice versa.
Indicator plots show the calculated bases in white. The closest base below price is yellow. If that base is broken, it turns purple. Once a trade is entered, profit target is shown in silver and stop loss in red.

POW EdgeHello fellow Trading View member,
Eventually our rebranded update with some extra features for our exclusive 'Edge' Strategy Script.
In this description I will run through;
The strategy itself, what is it?
What does it do?
How does it work?
How can it help you?
How good is it?
What is it.....
The Edge Strategy itself is based upon 5 indicators lining up in total confluence to enter a position in line with a trending move. Adding them together adds more confluence and probability to each individual trade outcome over the longer term. The individual strategies used are based on Trend strategies all used in combination.
The uniqueness to this is how they are combined. Indicators can work to a point individually of course, but combining them together and only trading when all are in a line was our concept, whilst reviewing how each individual indicator can be optimised to work with the others.
Also the motivation was to be the right side of the market in a trending move and capitalising on as much as that move as possible.
The first part is to ensure the candle close is above or below our moving average, we can then check the state and validity of each of the other 4 indicators. Once this confluence is in alignment a trade is valid for entry - this has to be valid at the same time - but not all valid on the same candle - they will come into alignment in different stages. But once they are, our trade is valid.
I will not reveal the other individual 3 indicators but the other is also an ADX function to add a threshold into the strategy to identify a trend - usually above 20/25. This has upsides and downsides as any user can visualise and see in the testing.
We also add to the script to look for a Buy then Sell, Sell then Buy - we found this had more profitable results overall and next phase was to review the money management; where and how we placed our SL and when and why we exited the trade.
Example - for a BUY trade to be valid, all 5 indictors must meet their own criteria before a BUY is printed on the chart. Absolutely no technical analysis is needed to trade this strategy and the data we have is based on using the strategy in isolation - how you wish to use this either independently or supporting your own trading is of course, up to you.
The SL and TP's are based on ATR Multipliers thus ensuring we are factoring in market volatility at that time. We also have a FT (Follow Trend) option, which is a worthy addition for capitalising on big trending moves.
This strategy will work on all markets and timeframes.
We understand and accept that all pairs and markets are different thus we have optimised certain pairs and timeframes with different parameters to provide increased returns, these are hard coded (H1 Timeframe) and also provided for your review.
Profitability is easily viewable in the ‘Strategy Tester’ - this is a great tool. This is where you can see historic / live data for the strategy.
Data like;
The Net Profit
Number of trades
Win Percentage
Every trade taken
Average Win
Average Loss
Maximal DD , etc.
We have individually optimised each pair to ensure this is the case and hard coded these parameters into the strategy. All you need to do is flick between the pairs - the strategy will then identify the pair you are on and change the parameters to suit in the background.
Whilst a trade is open, the strategy will convert all candles to the relevant colour - Green for an uptrend and Red for a downtrend (all customisable).
We find this is helpful for traders psychology - not getting 'spooked' by other candle colours, affecting your decision making.
When a new signal is valid, 'POW BUY' or 'POW SELL' will be displayed on the first candle open for entry. As well as this, you will also have the trade label print which will display the following;
- EP – Entry price
- SL – Stop loss
- TP – Take Profit
- Lot size
The trade information printed will also tell you the pip values of your stop loss and take profit based on how far away they are from the trade entry price.
The lot size printed is customisable and unique to your account- within the strategy settings you can simply input your account balance, currency and risk approach which includes a fixed risk amount, fixed lot size or a fixed percentage.
This removes the need for 3rd party apps or websites to quickly calculate your specific risk on your trade. Thus saving you time and making sure you aren't 'guessing' with your lot size.
No one likes losing more than they thought.
The progress and initial challenges....
To start, our first version simply showed the buy and sell arrows when a trade was valid. However, this caused subjectivity with where we would place our stop loss and how we would manage the exit of the trade once we were in it. So, we identified a solid strategy for this was incorporating the Average True Range (ATR) for SL and TP options.
I was especially keen to add the SL and exit management so I could obtain solid back testing data to support my thoughts that 'this works'. Every trader requires confidence and belief in their strategy, without it you simply won't succeed or be disciplined in your execution.
The other challenge we all face is calculating the lot sizes of our trades right? So, it was important that we incorporated a lot size calculator - its all about making it easy when a trade is valid to enter without trying to calculate this accurately.
Lastly, when pairs are stuck in a range - this can be a testing period of 'chop' for a trend strategy, so we also incorporated the ADX function to enable us to set a threshold level to identify when the instrument is more likely to be trending.
What does it do?
Ultimately, tells you when to buy and sell - where to place your SL and when to exit. Whilst also ensuring your risk management is on point, by displaying your trading lot size. Also providing you with live back tested data at your finger tips thank you to the strategy tester.
How does it work?
This will be visible on your trading view charts once you get access. And will work across all your devices, the trading view website or the app on your phone for example.
You can also use Trading View alerts, so you won't miss a trade and can go about your day as normal without watching the screen. This will work on the Free version of TV, however, in order to benefit from more alerts and templates it makes sense to upgrade to a higher package.
How can it help you?
This will help give you a mechanical approach to your trading. This means, less decision making on your part, with the instant benefit of seeing the data you have at your fingertips thanks to the 'Strategy Tester' TV Function.
It will save you time, you don't need to be in front of your screen or completing any subjective analysis.
Integrated lot size calculator can ensure you are always accurate with your risk - either in percentage or a fixed amount of risk - whichever you prefer.
Understand Probability - this is the key one for me. Losing runs happen in any trading strategy. The great benefit here, is you can see them. How long were the losing runs? How can I prepare and plan my risk management around them are all fundamental keys to managing your emotions and being detached from your trades. No one wants to feel stressed or anxious when trading.
Customisable exit strategies - A specific TP for a 1:1 RR or 1:10 RR for example can be adjusted and you can see instantly how this affects the profitability.
The exit strategy options are shown below;
TP 1/2/3
FT - Follow Trend (no stop loss and follow's from Buys to Sells, Sell to Buy, etc.
SL + FT - SL present, but trade is held until a reverse signal is presented.
How good is it?
We have some really positive back testing data across a range of pairs and markets - equities and indices too.
Drop me a DM to see these and I'll be happy to share.
Below let me show you a screen shot of how this can work for you.
How do you access this?
Please visit our website for signup / purchase information in the first instance (the link is on our trading view signature) or send us a private message on here - its impossible to keep track of comments on our posts so to ensure we don't miss you, a private DM will be great please.
The Back test shown on this example is based on the Trading View mid price and also a realistic starting Capital of £10,000. This test result is also based on a 0.1% risk per trade, with a 5 tick spread and a commission of
Regards
Darren
Disclaimer alert.
Please remember past performance is exactly that - how our strategy performed over those dates tested, it is not obviously a guarantee of future performance. Most of our H1 data is valid from Jan 2017 to now - so 4+ years and data on 650+ trades per pair.

Bollinger Bands Strategy with Intraday Intensity IndexFor Educational Purposes. Results can differ on different markets and can fail at any time. Profit is not guaranteed.
This only works in a few markets and in certain situations. Changing the settings can give better or worse results for other markets.
This is a mean reversion strategy based on Bollinger Bands and the Intraday Intensity Index (a volume indicator). John Bollinger mentions that the Intraday Intensity Index can be used with Bollinger Bands and is one of the top indicators he recommends in his book. It seems he prefers it over the other volume indicators that he compares to for some reason. III looks a lot like Chaikin Money Flow but without the denominator in that calculation. On the default settings of the BBs, the III helps give off better entry signals. John Bollinger however is vague on how to use the BBs and it's hard to say if one should enter when it is below/above the bands or when the price crosses them. I find that with many indicators and strategies it's best to wait for a confirmation of some sort, in this case by waiting for some crossover of a band. Like most mean reversion strategies, the exit is very loose if using BBs alone. Usually the plan to exit is when the price finally reverts back to the mean or in this case the middle band. This can potentially lead to huge drawdowns and/or losses. Mean reversion strategies can have high win/loss ratios but can still end up unprofitable because of the huge losses that can occur. These drawdowns/losses that mean reversion strategies suffer from can potentially eat away at a large chunk of all that was previously made or perhaps up to all of it in the worst cases, can occur weeks or perhaps up to months after being profitable trading such a strategy, and will take a while and several trades to make it all back or keep a profitable track record. It is important to have a stop loss, trailing stop, or some sort of stop plan with these types of strategies. For this one, in addition to exiting the trade when price reverts to the middle band, I included a time-based stop plan that exits with a gain or with a loss to avoid potentially large losses, and to exit after only a few periods after taking the trade if in profit instead of waiting for the price to revert back to the mean.

HFT Divergence Hunter BacktesterDefault Settings are meant to be used in BTC /USDT chart on 5 min time frame on Binance Futures . If you want to use for another asset on another time frame YOU MUST CHANGE THE SETTINGS
This is a divergence finding strategy developed by HFT Research. It is a highly customizable strategy and provides endless opportunities to find profitable trades in the market.
Default Settings are meant to be used in BTC /USDT chart on 5 min time frame on Binance Futures . If you want to use for another asset on another time frame YOU MUST CHANGE THE SETTINGS
This is a divergence finding indicator developed by HFT Research. It is a highly customizable indicator and provides endless opportunities to find profitable trades in the market.
Use Envelope , this is the main decision maker in this strategy. The idea behind is that you choose the length of the moving average and set an offset % to create an upper and lower band. If you click on “display envelope” you will be able to visually see the band you have created. This way, you get to scalp the market as the price is diverging and moving away from the moving average. As the famous saying goes, moving averages act like magnets and prices always visits them back. Using this ideology, we aim to capitilize on the price swings that move away from the chosen moving average by x%.
STARC Bands ;
These are two bands that are applied above and below a simple moving average of an asset’s price. The upper band is created by adding the value of the average true range (ATR) or a multiple of i. The lower band is created by subtracting the value of the ATR from the SMA . The channel can provide traders with ideas on when to buy or sell. During an overall uptrend, buying near the lower band and selling near the top band is favorable. However, from our testing results it does fairly poorly in crypto markets while it does pretty well in traditional markets.
Use RSI ;
One of the most commonly used indicators in the trading world. The idea is simple, buy when its oversold and sell when its overbought. You can use RSI as a secondary confirmation of the dips. It can be turned on and off.
Use MFI
MFI stands for Money Flow Index and it is an oscillator like RSI . However, it does track the price in a different fashion than RSI providing a reliable option. It uses the price and volume data for identifying overbought and oversold signals in an asset.
Use Fisher Transform
Even though, it has a funny name, Fisher is actually a very decent and reliable indicator. It converts the prices into a Gaussian normal distribution channel. Therefore, the indicator detects when the prices have moved to an extreme, based on recent price action.
Use VWAP
VWAP stands for volume weighted average price . It is an extremely useful indicator when trading intra-day. It does reset every trading session which is at 00:00 UTC . Instead of looking at x number of candles and providing an average price, it will take into consideration the volume that’s traded at a certain price and weigh it accordingly. It will NOT give entry signals but act as a filter. If the price is above VWAP will filter out the shorts and other way around for longs.
Use ADX
Average directional index is a powerful indicator when one is assessing the strength of a trend as well as measuring the volatility in the market. Unfortunately, the worst market condition for this strategy is sideways market. ADX becomes a useful tool since it can detect trend. If the volatility is low and there is no real price movement, ADX will pick that up and will not let you get in trades during a sideways market. It will allow you to enter trades only when the market is trending.
Use Super trend Filter
The indicator works well in a trending market but can give false signals when a market is trading in a range.
It uses the ATR ( average true range ) as part of its calculation which takes into account the volatility of the market. The ATR is adjusted using the multiplier setting which determines how sensitive the indicator is.
Use MA Filter
Lookback: It is an option to look back x number of candles to validate the price crossing. If the market is choppy and the price keeps crossing up and down the moving average you have chosen, it will generate a lot of “noisy” signals. This option allows you to confirm the cross by selecting how many candles the price needs to stay above or below the moving average. Setting it 0 will turn it off.
MA Filter Type: There is a selection of moving averages that is available on TradingView currently. You can choose from 14 different moving average types to detect the trend as accurate as possible.
Filter Length: You can select the length of your moving average. Most commonly used length being 50,100 and 200.
Filter Type: This is our propriety smoothing method in order to make the moving averages lag less and influence the way they are calculated slightly. Type 1 being the normal calculation and type 2 being the secret sauce .
Reverse MA Filter: This option allows you to use the moving average in reverse. For example, the strategy will go long when the price is above the moving average. However, if you use the reserve MA Filter, you will go short when the price is above the moving average. This method works best in sideways market where price usually retraces back to the moving average. So, in an anticipation of price reverting back to the moving average, it is a useful piece of option to use during sideway markets.
Use MACD Filter
MACD here will act as a filter rather than an entry signal generator. There are a few different ways to use this MACD filter. You can click on the Use MACD filter and it will use filter out the shorts generated in a bullish territory and longs generated in the bearish territory. It will greatly reduce the number of trades the strategy will trade because MACD is a lagging indicator. By the time MACD turns bullish or bearish , most of the other indicators will have already generated the signals. Therefore, resulting in less trades. You can use MACD filter as MA oscillator meaning that it will only look at the MA lines in MACD to filter out trades. Alternatively, you can use it with the histogram (Signal lines) meaning that it will only look at the histogram whether its below or above the zero line in order to filter out the trades.
TP (%)
Place your desired take profit percentage here. Default is 1.5%
Move SL At Entry x% Profit
This is when the strategy will move your SL to the entry point if the position reaches x% profit. It can also generate a signal which can be automated to adjust the SL on the exchange.
SL (%)
Place your desired stop loss percentage here. Default is 1%
The backtester assumes the following;
- 1000$ capital
- 0.06% commission based on binance
- 1% risk meaning 100% equity on cross leverage
- Backtest results are starting from 2020
If you want to get access to this indicator please DM me or visit our website.

BlueFX Strategy We are re publishing the script so the Script Title doesn't display the old version number, to stop further confusion with our members.
This title will now remain constant, until you click into the strategy and the latest version number will be shown.
The previous release notes below are copied from the previous descriptions with the release note updates shown.
Hi Traders,
I hope everyone is great - its a long one - but worth the read, I promise....
Firstly, thank you to our members for being patient with this release - it took longer than anticipated but now with even more functionality too - and some improved profitability in back-testing on our H1 time frame especially - explained further below.
Secondly, thank you to the individuals that have made this happen - you know who you are! Sounds like an Oscar speech right.... sorry.
This tool we believe really does change the game - please read on to find out more.
As a brief reminder this builds upon on initial V1 and V2 indicator/scripts ...
The strategy itself
Our strategy will help you identify the current trend in the markets and highlight when this is changing. The strategy itself is based upon 4 indicators lining up in total confluence to increase the probability of the trade being a success.
Absolutely no technical analysis is needed to trade this successfully - this can be used on all time frames and all pairs - obviously with varying profitability as all pairs work differently - this can be reviewed quickly in 'Strategy Tester' to hone in on your own desired settings.
When all criteria is in alignment the strategy will convert all candles to the relevant colour - Green for an uptrend and Red for a downtrend; a candle that is printed normally simply shows that no current trend is in place to warrant a colour change. A normal coloured candle could possibly indicate a change in current market direction or the market consolidating before a further move in the initial direction.
When a new signal is valid, 'Blue FX Buy'' or 'Blue FX Sell' will be displayed and the small arrow shown on candle open for entry. (*Now along with Entry Price (EP), Stop Loss (SL), Take Profit (TP) and Lot size that is based on the risk parameters you have set personally on V3)
Version 2 was created with H4 confluence built in and also a display of a suggested Stop Loss (SL) and multiple Take Profits (TP's) on the H1 (One Hour) time frame - thus making your entry even easier and your SL more reliable - these suggested SL's and targets were based on the ATR of that pair at that time - a popular choice amongst traders - automatically built in.
What is a Trading View Script?
A script is like an indicator but better, we can prove the success of our strategy by using Trading Views strategy tester function. As shown below and on the chart - you can see the 'Buy' and 'Close Buy' on the chart, supported by a live trading log showing you the entry, entry price date, volume and closing price.
This is a great function for numerous reasons; firstly, you know you are using a profitable strategy, secondly you can use this as a trading journal to support your trading too. This in itself can help you with your trading psychology - letting winning trades run is a prime example of this. Take confidence in the statistics and performance over time.
Ultimately, we believe we have saved YOU the need to firstly, find an edge and a strategy - and all of the time it takes to BACKTEST a strategy - to then find it may or may not work - and then you start again!
Well guess what?
We know this works and it takes you seconds to see it.
Everyone can see the statistics themselves for 2020 to date (and previous!); an account gain of over 500% if you managed to catch all trades risking 1% per trade. I understand that catching all trades is difficult but even if you caught a third, that's still not too bad right?
Disclaimer alert; Please remember past performance is exactly that - how our strategy performed over those dates tested, it is not obviously a guarantee of future performance.
Even better, you/we can still hone in these settings to find an improved performance per pair on any given time frame and money management plan. (We are currently looking into automating this process too)
Default settings are set for use with the H1 time frame - no extra confluence checking is needed with these settings.
So what are the specific changes I hear you ask?
- Visibility of the SL and TP labels across all time frames.
- Visibility of all previous SL and TP labels with the click of a button (Prev. was only 2).
- Proof of the profitability of the strategy - we had this in V1 but this was based on trend following with the exit - we didn't in V2 when we added the SL and TP display function.
- The ability to customise the parameters and see the instant impact of the desired pair/time-frame and testing date range - of course some work better than others and will do at different times - once we have found a way to test this in an automated way we could look to do this monthly/quarterly to ensure we are using 'optimal' parameters at all times.
- Another game changer here is the addition of a lot size calculator - set your balance, set your risk and the LOT SIZE you should be trading will appear as if by magic - no need to use any other tool to do this. For inexperienced traders and especially trading stocks/ gold / commodities we suggest you check the contract sizes first as some brokers may operate differently. This visual cue will help ensure you are managing your risk and save you time in checking the right Lot Size for your trade (every pair has a different pip value and every trade a different SL).
- Although not required in our H1 settings currently - we have added more higher time frame confluences - which can improve the profitability of different pairs on different time frames in testing.
- As our tool can be used across all instruments we have a pull down menu for Crypto/Metals/Stocks/ Commodities , etc.
- The option to also test fixed lot size or percentage - see the benefit of compounding right away.
- The option to turn the testing function on and off.
Let's see an example......
An example trade - display Entry, SL, multiple TP, lot size and contract size.
snapshot
We have deliberately set the TP3 to be an increased target, this way we can capitalise on a large move in the market, should the move reverse and the opposite signal appears we close the trade anyway and follow the new signal.
I am unable to add other pictures in this Script description - but we will include in our Public channel and update our website to show them over the coming days.
I hope you can all see the functionality in this tool, the profitability in historic tests and how it can be used to give you your edge.
How do you access this I hear you ask?
Please visit our website for signup / purchase information in the first instance (the link is on our trading view profile / signature) or send us a private message on here - its impossible to keep track of comments on our posts so to ensure we don't miss you, a private DM will be great please.
Thank you for reading, we hope you choose to join our vastly growing community.
Kind regards
Darren
Blue FX
Jun 14
Release Notes: Default settings have been improved, providing a 600% gain YTD in back testing with less trades too.
Jul 4
Release Notes: Trend filter using ADX - our strategy is based on a trending market, adding the ADX filter to our strategy allows us to remove trades under the threshold level set. Previously - we tried to teach our members how to spot the ranging markets to help further increase their successes (although the stats were not based on any manual intervention) - now they don't have too.
Specific parameters set into the code - detects the pair and TF to shown them automatically - our method has been solid YOY growth based on a fixed 0.01 lot size to gain consistent yearly consistent results.
Trade volumes substantially reduced with a much higher win rate - due to the specific parameters and ADX filter.
No pull down menu when flicking between instruments - all done automatically; making it easier for trades flicking between trading instruments.
More TP options for testing - we have TP1/2/3 and other variables including FT (Follow Trend) / FT + SL (Follow trend with Stop loss) / TS (Trail Stop function)
Smaller labels showing entry, SL and TP, etc - much clearer on screen and on your app.
Lot sizes fixed - we had a previous bug affecting some currencies - as always where money is involved and managing risk, ensure you check and are comfortable this is correct of course
Filter for days of the week - some pairs hate specific days, a great tool, see how removing Fridays affects the performance in seconds.
Back testing on all instruments - not previously available - trade stocks like Tesla or Lloyds - or indices? We can give you back testing data for them all.
Filter for trading sessions - like the days of the week - if you are only trading London and US sessions, back testing data for other sessions is pretty pointless - now you can remove them too!
If you wish to just stay with the default V3 settings its simple, turn 'Use pre-defined parameter?' Off - and turn off ADX - your chart will then look like the initial v3.0 strategy anyway. However, every pair has improved performance we have found when including ADX - each pair is affected differently with a higher or lower ADX Threshold - this is parameter #9.
I don't think there is much more that can be added now - fuelled by our ambition - to provide our members with an easy yet profitable trading strategy for both beginner or experienced trader. We have this at the forefront of our minds when adding and reviewing functions.
Follow the trades, stay disciplined and don't focus on the money. Focus on the 'process' of following the strategy, its much easier on your mind too. Far easier following instructions than trying to do something without - follow your plan, the process and the money will follow.
If you wish to see all of the back testing data for each pair - hop into our Discord Server and check out the #public-backtesting-channel - all of them will be there when I post them tonight.
Jul 5
Release Notes: Another quick update.
More days of week added - Sat and Sunday trading sessions - (Sat - just crypto is open on TV)
Also a specific setting for trading just a certain time of day - this is based on EST time you will will need to convert back to your time zone for this to work.
For example, if you would like to test trading EURUSD between 7am and 11am - you will need to find the EST time for this which is 2am to 6am, you will then see these trades in the list of trades section. This is ideal for scalping certain sessions where all trades will be open and closed promptly.
I use the 'Time Buddy' app for this as its quite straight forward.
Regards
Darren
18 hours ago
Release Notes: Update - correcting the entry price label error.

HFT Momentum BacktesterDefault Settings are meant to be used in XBT/USD chart on 1 hour time frame. If you want to use for another asset on another time frame YOU MUST CHANGE THE SETTINGS
This is momentum-based strategy designed by HFT Research in order to take advantage of volatile, trending markets.
Use ADX
ADX stands for average directional index . It is an indicator that measures volatility in the market. Unfortunately, the worst market condition for this strategy is sideways market. ADX becomes a useful tool since it can detect trend. If the volatility is low and there is no real price movement, ADX will pick that up and will not let you get in trades during a sideways market. It will allow you to enter trades only when the market is trending.
Use MA CrossOver
This strategy’s main driver is the moving average cross over however, unlike many other indicators, this strategy has ALL the moving averages that are on trading view. Total of 13 different moving averages all calculated in a different fashion available in a drop-down menu. You are able to choose two different moving averages to cross for your entry as well as being able to adjust the length of each individual moving average.
Use MA Spread % Filter
As an extra protection, we introduced MA spread % filter. We all know that momentum strategy works when there is actually a trend that has momentum. When there is no trend and market side choppy, we get a lot of noisy signals. In order to battle that we have introduced MA spread % filter. Using this piece of setting, you will be able to chose how strong the cross over actually is. If price is moving sideways, the moving averages will cross each other barely. If the price has actually any steam and momentum, MA 1 will cross over MA 2 aggressively because it will be trending market.
First you chose what the minimum % difference there should be between your 2 moving averages. If you keep this too tight, it won’t be as useful and if you keep this too large then the script will not generate any signals. Trust us, there is a fine balance in between! Then you proceed to chose your moving averages that the bot should keep track of.
Check our website for more information.
Backtest assumes the following;
You have 1000$ to trade
You use 1% of your capital on cross margin with 1% Stop Loss. Therefore, every trade has 100% equity effect on your balance and 1% stop loss has 1% loss effect
0.06% commission taking Binance as base. Please change commission if you are using another exchange.

McGinley Dynamic Indicator This is a strategy based on the Mcginley Dynamic Moving Average indicator, a type of moving average that was designed to track the market better than existing moving average indicators. It is a technical indicator that improves upon moving average lines by adjusting for shifts in market speed.
Moving averages used:
EMA: 21
EMA: 42
The chart used for the backtest was the Bovespa Futures Index ( WIN1! Continuous: current contract in front )

All Instrument Swing Trader with Pyramids, DCA and Leverage
Introduction
This is my most advanced Pine 4 script so far. It combines my range trader algorithms with my trend following pyramids all on a single interval. This script includes my beta tested DCA feature along with simulated leverage and buying power calculations. It has a twin study with several alerts. The features in this script allow you to experiment with different risk strategies and evaluate the approximate impact on your account capital. The script is flexible enough to run on instruments from different markets and at various bar intervals. This strategy can be run in three different modes: long, short and bidirectional. The bidirectional mode has two split modes (Ping Pong and BiDir). It also generates a summary report label with information not available in the TradingView Performance report such as Rate Of Return Standard Deviation and other Sharpe Ratio input values. Notable features include the following:
- Swing Trading Paradigm
- Uni or Bidirectional trading modes
- Calculation presets for Crypto, Stocks and Forex
- Conditional Minimum Profit
- Hard stop loss field
- Two types of DCA (Positive and Negative)
- Discretionary Pyramid levels with threshold adjustment and limiter
- Consecutive loss counter with preset and label
- Reentry loss limiter and trade entry caution fields
- Simulated Leverage and margin call warning label (approximation only)
- Buying power report labels (approximation only)
- Rate Of Return report with input values for Sharpe Ratio, Sortino and others
- Summary report label with real-time status indicators
- Trend follow bias modes (Its still range trading)
- Six anti-chop settings
- Single interval strategy to reduce repaint occurrence
This is a swing trading strategy so the behavior of this script is to buy on weakness and sell on strength. As such trade orders are placed in a counter direction to price pressure. What you will see on the chart is a short position on peaks and a long position on valleys. Just to be clear, the range as well as trends are merely illusions as the chart only receives prices. However, this script attempts to calculate pivot points from the price stream. Rising pivots are shorts and falling pivots are longs. I refer to pivots as a vertex in this script which adds structural components to the chart formation (point, sides and a base). When trading in “Ping Pong” mode long and short positions are intermingled continuously as long as there exists a detectable vertex. Unfortunately, this can work against your backtest profitability on long duration trends where prices continue in a single direction without pullback. I have designed various features in the script to compensate for this event. A well configured script should perform in a range bound market and minimize losses in a trend. For a range trader the trend is most certainly not your friend. I also have a trend following version of this script for those not interested in trading the range.
This script makes use of the TradingView pyramid feature accessible from the properties tab. Additional trades can be placed in the draw-down space increasing the position size and thereby increasing the profit or loss when the position finally closes. Each individual add on trade increases its order size as a multiple of its pyramid level. This makes it easy to comply with NFA FIFO Rule 2-43(b) if the trades are executed here in America. The inputs dialog box contains various settings to adjust where the add on trades show up, under what circumstances and how frequent if at all. Please be advised that pyramiding is an advanced feature and can wipe out your account capital if your not careful. You can use the “Performance Bond Leverage” feature to stress test your account capital with varying pyramid levels during the backtest. Use modest settings with realistic capital until you discover what you think you can handle. See the“Performance Bond Leverage” description for more information.
In addition to pyramiding this script employs DCA which enables users to experiment with loss recovery techniques. This is another advanced feature which can increase the order size on new trades in response to stopped out or winning streak trades. The script keeps track of debt incurred from losing trades. When the debt is recovered the order size returns to the base amount specified in the TV properties tab. The inputs for this feature include a limiter to prevent your account from depleting capital during runaway markets. The main difference between DCA and pyramids is that this implementation of DCA applies to new trades while pyramids affect open positions. DCA is a popular feature in crypto trading but can leave you with large “bags” if your not careful. In other markets, especially margin trading, you’ll need a well funded account and much experience.
To be sure pyramiding and dollar cost averaging is as close to gambling as you can get in respectable trading exchanges. However, if you are looking to compete in a Forex contest or want to add excitement to your trading life style those features could find a place in your strategies. Although your backtest may show spectacular gains don’t expect your live trading account to do the same. Every backtest has some measure to data mining bias. Please remember that.
This script is equipped with a consecutive loss counter. A limit field is provided in the report section of the input dialog box. This is a whole number value that, when specified, will generate a label on the chart when consecutive losses exceed the threshold. Every stop hit beyond this limit will be reported on a version 4 label above the bar where the stop is hit. Use the location of the labels along with the summary report tally to improve the adaptability of system. Don’t simply fit the chart. A good trading system should adapt to ever changing market conditions. On the study version the consecutive loss limit can be used to halt live trading on the broker side (managed manually).
This script can simulate leverage applied to your account capital. Basically, you want to know if the account capital you specified in the properties tab is sufficient to trade this script with the order size, pyramid and DCA parameters needed. TradingView does not halt trading when the account capital is depleted nor do you receive notification of such an event. Input the leverage you intend to trade with and simulate the stress on your account capital. When the check box labeled “Report Margin Call” is enabled a marker will plot on the chart at the location where the threshold was breached. Additionally, the Summary Report will indicated such a breach has occurred during the backtest. Please note that the margin calculation uses a performance bond contract model which is the same type of leverage applied to Forex accounts. This is not the same leverage as stock margin accounts since shares are not actually borrowed. It is also not applicable to futures contracts since we do not calculate maintenance margin. Also note that the account margin and buying power are calculated using the U.S. Dollar as a funding currency. Margin rules across the globe vary considerably so use this feature as an approximation. The “Report Margin Call” plot only appears on negative buying power which is well beyond the NFA enforced margin closeout price. Vary the order size and account capital and activate the buying power plot to get as close as you can to the desired margin call threshold. Also keep in mind that rollover fees, commissions, spreads, etc affect the margin call in actual live trading. This feature does not include any of those costs.
Inputs
The script input dialog box is divided into five sections. The last section, Section 5, contains all of the script reporting options. Notable reporting options are the inputs which provide support for calculating actual Sharpe Ratios and other risk / performance metrics. The TradingView performance report does not produce a scalable Sharpe Ratio which is unfortunate considering the limited data supplied to the backtest. Three report fields made available in this section are intended to enable users to measure the performance of this script using various industry standard risk metrics. In particular, The Sharpe Ratio, Sortino Ratio, Alpha Calculation, Beta Calculation, R-Squared and Monthly Standard Deviation. The following fields are dedicated to this effort:
– ROR Sample Period - Integer number which specifies the rate of return period. This number is a component of the Sharpe Ratio and determines the number of sample periods divisible in the chart data. The number specified here is the length of the period measured in bar intervals. Since the quantity of TradingView historical data is limited this number should reflect the scalar value applied to your Sharpe calculation. When the checkbox “Report Period ROR” is enabled red boxes plot on the dates corresponding to the ROR sample period. The red boxes display information useful in calculating various risk and performance models. Ongoing buying power is included in the period report which is especially useful in assessing the DCA stress on account capital. Important: When the “ROR Sample Period” is specified the script computes the ROR mean value and displays the result in the summary report label on the live end of the chart. Use this number to calculate the historical standard deviation of period returns.
– Return Mean Value - This is the ROR mean value which is displayed in the summary report field “ROR Mean”. Enter the value shown in the summary report here in order to calculate the standard deviation of returns. Once calculated the result is displayed in the summary report field “Standard Dev”. Please note that ROR and standard deviation are calculated on the quote currency of the chart and not the account currency. If you intend to calculate risk metrics based on other denominated returns use the period calculations in a spreadsheet. Important: Do not change the account denomination on the properties tab simply to force a dollar calculation. It will alter the backtest itself since the minimum profit, stop-loss and other variables are always measured in the quote currency of the chart.
– Report Period ROR - This checkbox is used to display the ROR period report which plots a red label above the bars corresponding to the ROR sample period. The sample period is defined by the value entered into the “ROR Sample Period” field. This checkbox only determines if the period labels plot on the chart. It does not enable or disable the ROR calculation itself. Please see input description“ROR Sample Period” for a detailed description of this feature.
Design
This script uses twelve indicators on a single time frame. The original trading algorithms are a port from a much larger program on another trading platform. I’ve converted some of the statistical functions to use standard indicators available on TradingView. The setups make heavy use of the Hull Moving Average in conjunction with EMAs that form the Bill Williams Alligator as described in his book “New Trading Dimensions” Chapter 3. Lag between the Hull and the EMAs form the basis of the entry and exit points. The vertices are calculated using one of five featured indicators. Each indicator is actually a composite of calculations which produce a distinct mean. This mathematical distinction enables the script to be useful on various instruments which belong to entirely different markets. In other words, at least one of these indicators should be able generate pivots on an arbitrarily selected instrument. Try each one to find the best fit.
The entire script is around 2200 lines of Pine code which pushes the limits of what can be created on this platform given the TradingView maximums for: local scopes, run-time duration and compile time. This script incorporates code from both my range trader and trend following published programs. Both have been in development for nearly two years and have been in beta test for the last several months. During the beta test of the range trading script it was discovered that by widening the stop and delaying the entry, add on trading opportunities appeared on the chart. I determined that by sacrificing a few minor features code space could be made available for pyramiding capability in the range trader. The module has been through several refactoring passes and makes extensive use of ternary statements. As such, It takes a full three minutes to compile after adding it to a chart. Please wait for the hovering dots to disappear before attempting to bring up the input dialog box. For the most part the same configuration settings for the range script can be applied to this script.
Inputs to the script use cone centric measurements in effort to avoid exposing adjustments to the various internal indicators. The goal was to keep the inputs relevant to the actual trade entry and exit locations as opposed to a series of MA input values and the like. As a result the strategy exposes over 70 inputs grouped into long or short sections. Inputs are available for the usual minimum profit and stop-loss as well as safeguards, trade frequency, pyramids, DCA, modes, presets, reports and lots of calibrations. The inputs are numerous, I know. Unfortunately, at this time, TradingView does not offer any other method to get data in the script. The usual initialization files such as cnf, cfg, ini, json and xml files are currently unsupported.
I have several example configuration settings that I use for my own trading. They include cryptocurrencies and forex instruments on various time frames.
Indicator Repainting and Anomalies
Indicator repainting is an industry wide problem which mainly occurs when you mix backtest data with real-time data. It doesn't matter which platform you use some form of this condition will manifest itself on your chart over time. The critical aspect being whether live trades on your broker’s account continue to match your TradingView study.
Based on my experience with Pine, most of the problems stem from TradingView’s implementation of multiple interval access. Whereas most platforms provide a separate bar series for each interval requested, the Pine language interleaves higher time frames with the primary chart interval. The problem is exacerbated by allowing a look-ahead parameter to the Security function. The goal of my repaint prevention is simply to ensure that my signal trading bias remains consistent between the strategy, study and broker. That being said this is what I’ve done address this issue in this script:
1. This script uses only 1 time frame. The chart interval.
2. Every entry and exit condition is evaluated on closed bars only.
3. No security functions are called to avoid a look-ahead possibility.
4. Every contributing factor specified in the TradingView wiki regarding this issue has been addressed.
5. Entry and exit setups are not reliant on crossover conditions.
6. I’ve run a 10 minute chart live for a week and compared it to the same chart periodically reloaded. The two charts were highly correlated with no instances of completely opposite real-time signals. I do have to say that there were differences in the location of some trades between the backtest and the study. But, I think mostly those differences are attributable to trading off closed bars in the study and the use of strategy functions in the backtest.
The study does indeed bring up the TV warning dialog. The only reason for this is because the script uses an EMA indicator which according to TradingView is due to “peculiarities of the algorithm”. I use the EMA for the Bill Williams Alligator so there is no way to remove it.
One issue that comes up when comparing the strategy with the study is that the strategy trades show on the chart one bar later than the study. This problem is due to the fact that “strategy.entry()” and “strategy_exit()” do not execute on the same bar called. The study, on the other hand, has no such limitation since there are no position routines.
Please be aware that the data source matters. Cryptocurrency has no central tick repository so each exchange supplies TradingView its feed. Even though it is the same symbol the quality of the data and subsequently the bars that are supplied to the chart varies with the exchange. This script will absolutely produce different results on different data feeds of the same symbol. Be sure to backtest this script on the same data you intend to receive alerts for. Any example settings I share with you will always have the exchange name used to generate the test results.
Usage
The following steps provide a very brief set of instructions that will get you started but will most certainly not produce the best backtest. A trading system that you are willing to risk your hard earned capital will require a well crafted configuration that involves time, expertise and clearly defined goals. As previously mentioned, I have several example configs that I use for my own trading that I can share with you. To get hands on experience in setting up your own symbol from scratch please follow the steps below.
The input dialog box contains over 70 inputs separated into five sections. Each section is identified as such with a makeshift separator input. There are three main areas that must to be configured: long side, short side and settings that apply to both. The rest of the inputs apply to pyramids, DCA, reporting and calibrations. The following steps address these three main areas only. You will need to get your backtest in the black before moving on to the more advanced features.
Step 1. Setup the Base currency and order size in the properties tab.
Step 2. Select the calculation presets in the Instrument Type field.
Step 3. Select “No Trade” in the Trading Mode field.
Step 4. Select the Histogram indicator from Section 2. You will be experimenting with different ones so it doesn’t matter which one you try first.
Step 5. Turn on Show Markers in Section 2.
Step 6. Go to the chart and checkout where the markers show up. Blue is up and red is down. Long trades show up along the red markers and short trades on the blue.
Step 7. Make adjustments to “Base To Vertex” and “Vertex To Base” net change and roc in Section 3. Use these fields to move the markers to where you want trades to be.
Step 8. Try a different indicator from Section 2 and repeat Step 7 until you find the best match for this instrument on this interval. This step is complete when the Vertex settings and indicator combination produce the most favorable results.
Step 9. Go to Section 3 and enable “Apply Red Base To Base Margin”.
Step 10. Go to Section 4 and enable “Apply Blue Base To Base Margin”.
Step 11. Go to Section 2 and adjust “Minimum Base To Base Blue” and “Minimum Base To Base Red”. Observe the chart and note where the markers move relative to each other. Markers further apart will produce less trades but will reduce cutoffs in “Ping Pong” mode.
Step 12. Return to Section 3 and 4 and turn off “Base To Base Margin” which was enabled in steps 9 and 10.
Step 13. Turn off Show Markers in Section 2.
Step 14. Put in your Minimum Profit and Stop Loss in the first section. This is in pips or currency basis points (chart right side scale). Percentage is not currently supported. This is a fixed value minimum profit and stop loss. Also note that the profit is taken as a conditional exit on a market order not a fixed limit. The actual profit taken will almost always be greater than the amount specified (due to the exit condition). The stop loss, on the other hand, is indeed a hard number which is executed by the TradingView broker simulator when the threshold is breached. On the study version, the stop is executed at the close of the bar.
Step 15. Return to step 3 and select a Trading Mode (Long, Short, BiDir, Ping Pong). If you are planning to trade bidirectionally its best to configure long first then short. Combine them with “BiDir” or “Ping Pong” after setting up both sides of the trade individually. The difference between “BiDir” and “Ping Pong” is that “Ping Pong” uses position reversal and can cut off opposing trades less than the specified minimum profit. As a result “Ping Pong” mode produces the greatest number of trades.
Step 16. Take a look at the chart. Trades should be showing along the markers plotted earlier.
Step 17. Make adjustments to the Vertex fields in Section 2 until the TradingView performance report is showing a profit. This includes the “Minimum Base To Base” fields. If a profit cannot be achieved move on to Step 18. Other adjustments may make a crucial difference.
Step 18. Improve the backtest profitability by adjusting the “Entry Net Change” and “Entry ROC” in Section 3 and 4.
Step 19. Enable the “Mandatory Snap” checkbox in Section 3 and 4 and adjust the “Snap Candle Delta” and “Snap Fractal Delta” in Section 2. This should reduce some chop producing unprofitable reversals.
Step 20. Increase the distance between opposing trades by adding an “Interleave Delta” in Sections 3 and 4. This is a floating point value which starts at 0.01 and typically does not exceed 2.0.
Step 21. Increase the distance between opposing trades even further by adding a “Decay Minimum Span” in Sections 3 and 4. This is an absolute value specified in the symbol’s quote currency (right side scale of the chart). This value is similar to the minimum profit and stop loss fields in Section 1.
Step 22. Improve the backtest profitability by adjusting the “Sparse Delta” in Section 3 and 4.
Step 23. Improve the backtest profitability by adjusting the “Chase Delta” in Section 3 and 4.
Step 24. Improve the backtest profitability by adjusting the “Adherence Delta” in Section 3 and 4. This field requires the “Adhere to Rising Trend” checkbox to be enabled.
Step 25. Try each checkbox in Section 3 and 4. See if it improves the backtest profitability. The “Caution Lackluster” checkbox only works when “Caution Mode” is enabled.
Step 26. Enable the reporting conditions in Section 5. Look for long runs of consecutive losses or high debt sequences. These are indications that your trading system cannot withstand sudden changes in market sentiment.
Step 27. Examine the chart and see that trades are being placed in accordance with your desired trading goals. This is an important step. If your desired model requires multiple trades per day then you should be seeing hundreds of trades on the chart. Alternatively, you may be looking to trade fewer steep peaks and deep valleys in which case you should see trades at major turning points. Don’t simply settle for what the backtest serves you. Work your configuration until the system aligns with your desired model. Try changing indicators and even intervals if you cannot reach your simulation goals. Generally speaking, the histogram and Candle indicators produce the most trades. The Macro indicator captures the tallest peaks and valleys.
Step 28. Apply the backtest settings to the study version and perform forward testing.
This script is open for beta testing. After successful beta test it will become a commercial application available by subscription only. I’ve invested quite a lot of time and effort into making this the best possible signal generator for all of the instruments I intend to trade. I certainly welcome any suggestions for improvements. Thank you all in advance.
One final note. I'm not a fan of having the Performance Overview (blue wedge) automatically show up at the end of the publish page since it could be misleading. On the EUR/USD backtest showing here I used a minimum profit of 65 pips, a stop of 120 pips, the candle indicator and a 5 pyramid max value. Also Mark Pyramid Levels (blue triangles) are enabled along with a 720 ROR Sample Period (red labels).

TrendLines with AlertsThis isn't my own work, hence giving it in Open Source library for others to benefit from it too.
I have tried to refin the output of trendlines in this Strategy
The original Code is available at
The script needs some modifications, so I'll be making further updates in future, but for now I'm publishing this because most people don't know how to track trandlines, moreover, some use Line.New() by tradingview Pinescript, which again is a bit difficult to deal with.
This script is a basic version of trendlines on a certain angle (anglecheck was provided by the original author in his script).
Nothing fancy in this script.
Also Converted the original Script to Pinescript v4.
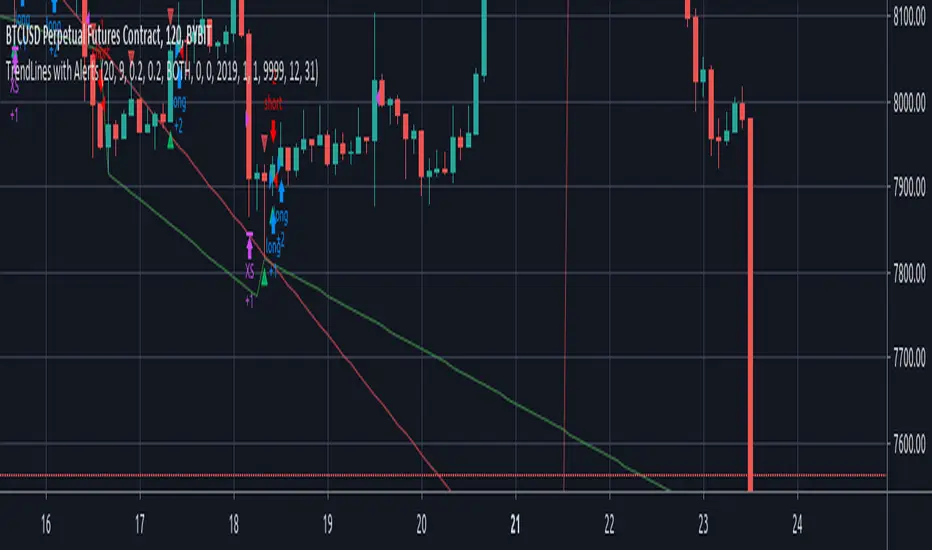
Full Range Trading Strategy with DCA - Crypto, Forex, Stocks
Introduction
This is a Pine 4 range trading strategy. It has a twin study with several alerts. The design intent is to produce a commercial grade signal generator that can be adapted to any symbol and interval. Ideally, the script is reliable enough to be the basis of an automated trading system web-hooked to a server with API access to crypto, forex and stock brokerages. The strategy can be run in three different modes: long, short and bidirectional.
As a range trading strategy, the behavior of the script is to buy on weakness and sell on strength. As such trade orders are placed in a counter direction to price pressure. What you will see on the chart is a short position on peaks and a long position on valleys. Just to be clear, the range as well as trends are merely illusions as the chart only receives prices. However, this script attempts to calculate pivot points from the price stream. Rising pivots are shorts and falling pivots are longs. I refer to pivots as a vertex in this script which adds structural components to the chart formation. When trading in “Ping Pong” mode long and short positions are intermingled continuously as long as there exists a detectable vertex. Unfortunately, this can work against your backtest profitability on long duration trends where prices continue in a single direction without pullback. I have designed various features in the script to compensate for this event. A well configured script should perform in a range bound market and minimize losses in a trend. I also have a trend following version of this script for those not interested in trading the range. Please be aware these are two types of traders. You should know who you are.
This script employs a DCA feature which enables users to experiment with loss recovery techniques. This is an advanced feature which can increase the order size on new trades in response to stopped out or winning streak trades. The script keeps track of debt incurred from losing trades. When the debt is recovered the order size returns to the base amount specified in the TV properties tab. The inputs for this feature include a limiter to prevent your account from depleting capital during runaway markets. This implementation of DCA does not use pyramid levels. Only the order size on subsequent new trades are affected. Pyramids on the other hand increase the size of open positions. If you are interested in seeing pyramids in action please see the trend version of this script which features both DCA and pyramids. While DCA is a popular feature in crypto trading, it can make you a “bag” holder if your not careful. In other markets, especially margin trading, you’ll need a well funded account and much trading experience to manage this feature safely.
Consecutive loss limit can be set to report a breach of the threshold value. Every stop hit beyond this limit will be reported on a version 4 label above the bar where the stop is hit. Use the location of the labels along with the summary report tally to improve the adaptability of system. Don’t simply fit the chart. A good trading system should adapt to ever changing market conditions. On the study version the consecutive loss limit can be used to halt live trading on the broker side (managed manually).
Design
This script uses twelve indicators on a single time frame. The original trading algorithms are a port from a much larger program on another trading platform. I’ve converted some of the statistical functions to use standard indicators available on TradingView. The setups make heavy use of the Hull Moving Average in conjunction with EMAs that form the Bill Williams Alligator as described in his book “New Trading Dimensions” Chapter 3. Lag between the Hull and the EMAs form the basis of the entry and exit points. The vertices are calculated using one of five featured indicators. Each indicator is actually a composite of calculations which produce a distinct mean. This mathematical distinction enables the script to be useful on various instruments which belong to entirely different markets. In other words, at least one of these indicators should be able generate pivots on an arbitrarily selected instrument. Try each one to find the best fit.
The entire script is around 1800 lines of Pine code which is the maximum incidental size given the TradingView limits: local scopes, run-time duration and compile time. I’ve been working on this script for nearly two years and have tested it on various instruments stocks, forex and crypto. It performs well on higher liquidity markets that have at least a year of historical data. Although the script can be implemented on any interval, it has been optimized for small time frames down to 5 minutes. The 10 minute BTC/USD produces around 500 trades in 2 ½ months. The 1 hour BTC/USD produces around 1300 trades in 1 ½ years. Originally, this script contained both range trading and trend following logic but had to be broken into separate scripts due to the aforementioned limitations.
Inputs to the script use cone centric measurements in effort to avoid exposing adjustments to the various internal indicators. The goal was to keep the inputs relevant to the actual trade entry and exit locations as opposed to a series of MA input values and the like. As a result the strategy exposes over 50 inputs grouped into long or short sections. Inputs are available for the usual minimum profit and stop-loss as well as safeguards, trade frequency, DCA, modes, presets, reports and lots of calibrations. The inputs are numerous, I’m aware. Unfortunately, at this time, TradingView does not offer any other method to get data in the script. The usual initialization files such as cnf, cfg, ini, json and xml files are currently unsupported.
Example configurations for various instruments along with a detailed PDF user manual is available.
Indicator Repainting And Anomalies
Indicator repainting is an industry wide problem which mainly occurs when you mix backtest data with real-time data. It doesn't matter which platform you use some form of this condition will manifest itself on your chart over time. The critical aspect being whether live trades on your broker’s account continue to match your TradingView study.
Tackling this repainting issue has been a major project goal of this script. Based on my experience with Pine, most of the problems stem from TradingView’s implementation of multiple interval access. Whereas most platform provide a separate bar series for each interval requested, the Pine language interleaves higher time frames with the primary chart interval. The problem is exacerbated by allowing a look-ahead parameter to the Security function. The goal of my repaint prevention is simply to ensure that my signal trading bias remains consistent between the strategy, study and broker. That being said this is what I’ve done address this issue in this script:
1. This script uses only 1 time frame. The chart interval.
2. Every entry and exit condition is evaluated on closed bars only.
3. No security functions are called to avoid a look-ahead possibility.
4. Every contributing factor specified in the TradingView wiki regarding this issue has been addressed.
5. I’ve run a 10 minute chart live for a week and compared it to the same chart periodically reloaded. The two charts were highly correlated with no instances of completely opposite real-time signals.
The study does indeed bring up the TV warning dialog. The only reason for this is because the script uses an EMA indicator which according to TradingView is due to “peculiarities of the algorithm”.
One issue that comes up when comparing the strategy with the study is that the strategy trades show on the chart one bar later than the study. This problem is due to the fact that “strategy.entry()” and “strategy_exit()” do not execute on the same bar called. The study, on the other hand, has no such limitation since there are no position routines.
Please be aware that the data source matters. Cryptocurrency has no central tick repository so each exchange supplies TradingView its feed. Even though it is the same symbol the quality of the data and subsequently the bars that are supplied to the chart varies with the exchange. This script will absolutely produce different results on different data feeds of the same symbol. Be sure to backtest this script on the same data you intend to receive alerts for. Any example settings I share with you will always have the exchange name used to generate the test results.
Usage
The following steps provide a very brief set of instructions that will get you started but will most certainly not produce the best backtest. A trading system that you are willing to risk your hard earned capital will require a well crafted configuration that involves time, expertise and clearly defined goals. As previously mentioned, I have several example configs that I use for my own trading that I can share with you along with a PDF which describes each input in detail. To get hands on experience in setting up your own symbol from scratch please follow the steps below.
The input dialog box contains over 50 inputs separated into five sections. Each section is identified as such with a makeshift separator input. There are three main areas that must to be configured: long side, short side and settings that apply to both. The rest of the inputs apply to DCA, reporting and calibrations. The following steps address these three main areas only. You will need to get your backtest in the black before moving on to the more advanced features.
Step 1. Setup the Base currency and order size in the properties tab.
Step 2. Select the calculation presets in the Instrument Type field.
Step 3. Select “No Trade” in the Trading Mode field.
Step 4. Select the Histogram indicator from Section 2. You will be experimenting with different ones so it doesn’t matter which one you try first.
Step 5. Turn on Show Markers in Section 2.
Step 6. Go to the chart and checkout where the markers show up. Blue is up and red is down. Long trades show up along the red markers and short trades on the blue.
Step 7. Make adjustments to “Base To Vertex” and “Vertex To Base” net change and roc in Section 3. Use these fields to move the markers to where you want trades to be.
Step 8. Try a different indicator from Section 2 and repeat Step 7 until you find the best match for this instrument on this interval. This step is complete when the Vertex settings and indicator combination produce the most favorable results.
Step 9. Go to Section 3 and enable “Apply Red Base To Base Margin”.
Step 10. Go to Section 4 and enable “Apply Blue Base To Base Margin”.
Step 11. Go to Section 2 and adjust “Minimum Base To Base Blue” and “Minimum Base To Base Red”. Observe the chart and note where the markers move relative to each other. Markers further apart will produce less trades but will reduce cutoffs in “Ping Pong” mode.
Step 12. Return to Section 3 and 4 and turn off “Base To Base Margin” which was enabled in steps 9 and 10.
Step 13. Turn off Show Markers in Section 2.
Step 14. Put in your Minimum Profit and Stop Loss in the first section. This is in pips or currency basis points (chart right side scale). Percentage is not currently supported. This is a fixed value minimum profit and stop loss. Also note that the profit is taken as a conditional exit on a market order not a fixed limit. The actual profit taken will almost always be greater than the amount specified. The stop loss, on the other hand, is indeed a hard number which is executed by the TradingView broker simulator when the threshold is breached. On the study version, the stop is executed at the close of the bar.
Step 15. Return to step 3 and select a Trading Mode (Long, Short, BiDir, Ping Pong). If you are planning to trade bidirectionally its best to configure long first then short. Combine them with “BiDir” or “Ping Pong” after setting up both sides of the trade individually. The difference between “BiDir” and “Ping Pong” is that “Ping Pong” uses position reversal and can cut off opposing trades less than the specified minimum profit. As a result “Ping Pong” mode produces the greatest number of trades.
Step 16. Take a look at the chart. Trades should be showing along the markers plotted earlier.
Step 17. Make adjustments to the Vertex fields in Section 2 until the TradingView performance report is showing a profit. This includes the “Minimum Base To Base” fields. If a profit cannot be achieved move on to Step 18.
Step 18. Improve the backtest profitability by adjusting the “Long Entry Net Change” and “Long Entry ROC” in Section 3.
Step 19. Improve the backtest profitability by adjusting the “Short Entry Net Change” and “Short Entry ROC” in Section 4.
Step 20. Improve the backtest profitability by adjusting the “Sparse Long Delta” in Section 3.
Step 21. Improve the backtest profitability by adjusting the “Chase Long Delta” in Section 3.
Step 22. Improve the backtest profitability by adjusting the “Long Adherence Delta” in Section 3. This field requires the “Adhere to Rising Trend” checkbox to be enabled.
Step 23. Try each checkbox in Section 3 and see if it improves the backtest profitability. The “Caution Lackluster Longs” checkbox only works when “Long Caution Mode” is enabled.
Step 24. Improve the backtest profitability by adjusting the “Sparse Short Delta” in Section 4.
Step 25. Improve the backtest profitability by adjusting the “Chase Short Delta” in Section 4.
Step 26. Improve the backtest profitability by adjusting the “Short Adherence Delta” in Section 4. This field requires the “Adhere to Falling Trend” checkbox to be enabled.
Step 27. Try each checkbox in Section 4 and see if it improves the backtest profitability. The “Caution Lackluster Shorts” checkbox only works when “Short Caution Mode” is enabled.
Step 28. Enable the reporting conditions in Section 5. Look for long runs of consecutive losses or high debt sequences. These are indications that your trading system cannot withstand sudden changes in market sentiment.
Step 29. Examine the chart and see that trades are being placed in accordance with your desired trading goals. This is an important step. If your desired model requires multiple trades per day then you should be seeing hundreds of trades on the chart. Alternatively, you may be looking to trade fewer steep peaks and deep valleys in which case you should see trades at major turning points. Don’t simply settle for what the backtest serves you. Work your configuration until the system aligns with your desired model. Try changing indicators and even intervals if you cannot reach your simulation goals. Generally speaking, the histogram and Candle indicators produce the most trades. The Macro indicator captures the tallest peaks and valleys.
Step 30. Apply the backtest settings to the study version and perform forward testing.
This script is open for beta testing. After successful beta test it will become a commercial application available by subscription only. I’ve invested quite a lot of time and effort into making this the best possible signal generator for all of the instruments I intend to trade. I certainly welcome any suggestions for improvements. Thank you all in advance.

Strategy to accumulate ADA Cardano cryptocurrency
This strategy was specifically developed for short ADA cryptocurrency operations in the ADA / BITCOIN pair.
Instructions:
- The strategy should be used on the daily chart of ADABTC;
- Entries should only be made from 21:00 in Brazil time zone;
- When the arrow indicates sale you should sell your ADAs to repurchase at a lower price, so you will be increasing your ADA quantity;
- When the arrow indicates "recomprar" you must repurchase the ADAs you sold on the sell signal given by the indicator;
- Use good risk management when using this strategy, avoid applying more than 50% of your ADAs to operations;
- A estratégia não possui um stop de perca. A saida de operações com prejuizo deve ser feita quando o indicador mandar recomprar as ADAs;
- When the ADA goes into a bullish trend this indicator performance may turn out to be bad, so the trader should be aware of possible developments that make the ADA appreciate against bitcoin.
Performance Information:
- First, it is important to note that there is no guarantee that past performance will continue in the future, so it is important that you do good risk management;
- The strategy was able to have a hit rate of over 60% on the daily chart between 2018 and October 2019. This means that with each operation you are more than 60% likely to have more ADAs.
- The largest loss occurred during the historical track tested was 4.72%, ie, those who entered the unsuccessful operation left with 4.72% less ADAs at the end of the operation;
- The operation with the highest profit in the series studied gave 90% return, that is, those who entered the operation almost doubled the equity in ADAs.

Total Trend Follow Strategy with Pyramid and DCA
Introduction
This is a Pine 4 trend following strategy. It has a twin study with several alerts. The design intent is to produce a commercial grade signal generator that can be adapted to any symbol and interval. Ideally, the script is reliable enough to be the basis of an automated trading system web-hooked to a server with API access to crypto, forex and stock brokerages. The strategy can be run in three different modes: long, short and bidirectional.
As a trend following strategy, the behavior of the script is to buy on strength and sell on weakness. As such the trade orders maintain its directional bias according to price pressure. What you will see on the chart is long positions on the left side of the mountain and short on the right. Long and short positions are not intermingled as long as there exists a detectable trend. This is extremely beneficial feature in long running bull or bear markets. The script uses multiple setups to avoid the situation where you got in on the trend, took a small profit but couldn’t get back in because the logic is waiting for a pullback or some other intricate condition.
Deep draw-downs are a characteristic of trend following systems and this system is no different. However, this script makes use of the TradingView pyramid feature accessible from the properties tab. Additional trades can be placed in the draw-down space increasing the position size and thereby increasing the profit or loss when the position finally closes. Each individual add on trade increases its order size as a multiple of its pyramid level. This makes it easy to comply with NFA FIFO Rule 2-43(b) if the trades are executed here in America. The inputs dialog box contains various settings to adjust where the add on trades show up, under what circumstances and how frequent if at all. Please be advised that pyramiding is an advanced feature and can wipe out your account capital if your not careful. During the backtest use modest setting with realistic capital until you discover what you think you can handle.
In addition to pyramiding this script employs DCA which enables users to experiment with loss recovery techniques. This is another advanced feature which can increase the order size on new trades in response to stopped out or winning streak trades. The script keeps track of debt incurred from losing trades. When the debt is recovered the order size returns to the base amount specified in the TV properties tab. The inputs for this feature include a limiter to prevent your account from depleting capital during runaway markets. The main difference between DCA and pyramids is that this implementation of DCA applies to new trades while pyramids affect open positions. DCA is a popular feature in crypto trading but can leave you with large “bags” if your not careful. In other markets, especially margin trading, you’ll need a well funded account and much experience.
Consecutive loss limit can be set to report a breach of the threshold value. Every stop hit beyond this limit will be reported on a version 4 label above the bar where the stop is hit. Use the location of the labels along with the summary report tally to improve the adaptability of system. Don’t simply fit the chart. A good trading system should adapt to ever changing market conditions. On the study version the consecutive loss limit can be used to halt live trading on the broker side (Managed manually).
Design
This script uses nine indicators on two time frames. The chart (primary) interval and one higher time frame which is based on the primary. The higher time frame identifies the trend for which the primary will trade. I’ve tried to keep the higher time frame around five times greater than the primary. The original trading algorithms are a port from a much larger program on another trading platform. I’ve converted some of the statistical functions to use standard indicators available on TradingView. The setups make heavy use of the Hull Moving Average in conjunction with EMAs that form the Bill Williams Alligator as described in his book “New Trading Dimensions” Chapter 3. Lag between the Hull and the EMAs form the basis of the entry and exit points. The alligator itself is used to identify the trend main body.
The entire script is around 1700 lines of Pine code which is the maximum incidental size given the TradingView limits: local scopes, run-time duration and compile time. I’ve been working on this script for over a year and have tested it on various instruments stocks, forex and crypto. It performs well on higher liquidity markets that have at least a year of historical data. Though it can be configured to work on any interval between 5 minutes and 1 day, trend trading is generally a longer term paradigm. For day trading the 10 to 15 minute interval will allow you to catch momentum breakouts. For intraweek trades 30 minutes to 1 hour should give you a trade every other a day. Four hours and above are for seasoned deep pocket traders. Originally, this script contained both range trading and trend following logic but had to be broken into separate scripts due to the aforementioned limitations.
Inputs to the script use cone centric measurements in effort to avoid exposing adjustments to the various internal indicators. The goal was to keep the inputs relevant to the actual trade entry and exit locations as opposed to a series of MA input values and the like. As a result the strategy exposes over 50 inputs grouped into long or short sections. Inputs are available for the usual minimum profit and stop-loss as well as safeguards, trade frequency, DCA, modes, presets, reports and lots of calibrations. The inputs are numerous, I’m aware. Unfortunately, at this time, TradingView does not offer any other method to get data in the script. The usual initialization files such as cnf, cfg, ini, json and xml files are currently unsupported.
Example configurations for various instruments along with a detailed PDF user manual is available.
Indicator Repainting And Anomalies
Indicator repainting is an industry wide problem which mainly occurs when you mix backtest data with real-time data. It doesn't matter which platform you use some form of this condition will manifest itself on your chart over time. The critical aspect being whether live trades on your broker’s account continue to match your TradingView study. Since this trading system is featured as two separate scripts, indicator repainting is addressed in the study version. The strategy (this script) is intended to be used on historical data to determine the appropriate trading inputs to apply in the study. As such, the higher time frame of this strategy will indeed repaint. Please do not attempt to trade from the strategy. Please see the study version for more information.
One issue that comes up when comparing the strategy with the study is that the strategy trades show on the chart one bar later than the study. This problem is due to the fact that “strategy.entry()” and “strategy_exit()” do not execute on the same bar called. The study, on the other hand, has no such limitation since there are no position routines. However, alerts that are subsequently fired off when triggered in the study are dispatched from the TradingView servers one bar later from the study plot. Therefore the alert you actually receive on your cell phone matches the strategy plot but is one bar later than the study plot. A lot can happen in four hours if you are trading off a 240 bar.
Please be aware that the data source matters. Cryptocurrency has no central tick repository so each exchange supplies TradingView its feed. Even though it is the same symbol the quality of the data and subsequently the bars that are supplied to the chart varies with the exchange. This script will absolutely produce different results on different data feeds of the same symbol. Be sure to backtest this script on the same data you intend to receive alerts for. Any example settings I share with you will always have the exchange name used to generate the test results.
Usage
The following steps provide a very brief set of instructions that will get you started but will most certainly not produce the best backtest. A trading system that you are willing to risk your hard earned capital will require a well crafted configuration that involves time, expertise and clearly defined goals. As previously mentioned, I have several example configs that I use for my own trading that I can share with you along with a PDF which describes each input in detail. To get hands on experience in setting up your own symbol from scratch please follow the steps below.
The input dialog box contains over 50 inputs separated into seven sections. Each section is identified as such with a makeshift separator input. There are three main areas that must to be configured: long side, short side and settings that apply to both. The rest of the inputs apply to pyramids, DCA, reporting and calibrations. The following steps address these three main areas only. You will need to get your backtest in the black before moving on to the more advanced features
Step 1. Setup the Base currency and order size in the properties tab.
Step 2. Select the calculation presets in the Instrument Type field.
Step 3. Select “No Trade” in the Trading Mode field.
Step 4. Select the Histogram indicator from section 3. You will be experimenting with different ones so it doesn’t matter which one you try first.
Step 5. Turn on Show Markers in Section 3.
Step 6. Go to the chart and checkout where the markers show up. Blue is up and red is down. Long trades show up along the blue markers and short trades on the red.
Step 7. Make adjustments to Base To Vertex and Vertex To Base net change and roc in section 3. Use these fields to move the markers to where you want trades to be. Blue is long and red is short.
Step 8. Try a different indicator from section 3 and repeat Step 7 until you find the best match for this instrument on this interval. This step is complete when the Vertex settings and indicator combination produce the most favorable results.
Step 9. Turn off Show Markers in Section 3.
Step 10. Enable the Symmetrical and Deviation calculation models at the top of section 5 and 6 (Symmetrical, Deviation).
Step 11. Put in your Minimum Profit and Stop Loss in the first section. This is in pips or currency basis points (chart right side scale)
Step 12. Return to step 3 and select a Trading Mode (Long, Short, BiDir, Flip Flop). If you are planning to trade bidirectionally its best to configure long first then short. Combine them with BiDir or Flip Flop after setting up both sides of the trade individually.
Step 13. Trades should be showing on the chart.
Step 14. Make adjustments to the Vertex fields in section 3 until the TradingView performance report is showing a profit.
Step 15. Change indicators and repeat step 14. Pick the best indicator.
Step 16. Use the check boxes in sections 5 and 6 to improve the performance of each side.
Step 17. Try adding the Correlation calculation model to either side. This model can sometimes produce a negative result but can be improved by enabling “Adhere To Markers” or “Narrow Correlation Scope” in the sections 5 and 6.
Step 18. Enable the reporting conditions in section 7. Look for long runs of consecutive losses or high debt sequences. These are indications that your trading system cannot withstand sudden changes in market sentiment.
Step 19. Examine the chart and see that trades are being placed in accordance with your desired trading model.
Step 20. Apply the backtest settings to the study version and perform forward testing.
This script is open for beta testing. After successful beta test it will become a commercial application available by subscription only. I’ve invested quite a lot of time and effort into making this the best possible signal generator for all of the instruments I intend to trade. I certainly welcome any suggestions for improvements. Thank you all in advance.
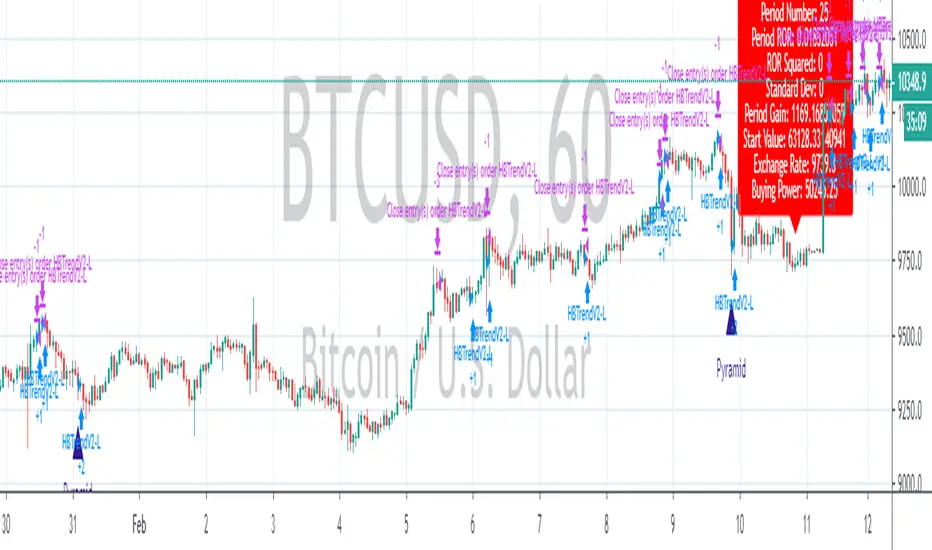
Breakout Notifier LONGLong trades based on our breakout logic, params you can configure are Stop Loss and breakout % to track
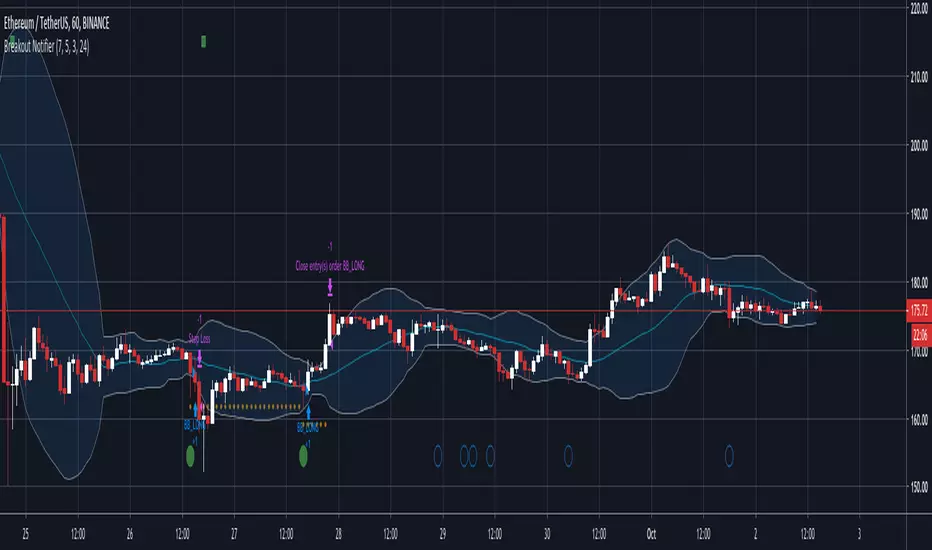
PD Crypto Performer PRO (Backtest)Description:
This is the backtesting version of the PD Crypto Performer Pro (Alert) . You can choose to backtest either one of the two strategies included, a trend-identifying swing strategy and a low risk scalping strategy. Both strategies assume the same capital amount invested ($10,000) each trade. You can also see how your capital grows over time by enabling the reinvesting proceeds option. For details, please check out this tutorial .
The backtesting results could be easily improved in live trading by utilizing the “Take Profit” signals and following the recommended methods of use below.
To assist the decision-making process, the code currently references BTCUSD. As a result, it is only suitable for crypto traders. However, we are working on the stock and forex versions, and the Performer will have these compatibilities soon.
Most importantly, our signals DO NOT REPAINT !
Recommended Use:
- Time Frame: 1HR
- Asset: Large cap crypto assets.
For lower risk tolerance, we recommend using the indicator on ETHUSD. For maximizing profits, we recommend using the indicator on BCHUSD.
- Always set stop loss according to your own risk tolerance
- Take profits along the way. Check out this video tutorial for when to reenter after our take profit signals.
Recommended Use for Advanced Traders:
- Position sizing:
Larger position if the 1HR signal is in the same direction compared to the 4HR trend.
Smaller position if the 1HR signal is in the opposite direction compared to the 4HR trend.
- Better entry/exit points:
Track the 1HR signal for the asset you are trading on other exchanges along with the BTCUSD 1HR signal. Sometimes, the signals from different exchanges occur with a 1-2 hour difference. You could use these earlier signals along with a lower time frame (eg. 15min) entry confirmation from your own exchange for better entry / exit points.
- Use “Take Profit” signals for counter trend scalps. Recover at the reentering opportunities . This works best with candlestick pattern confirmations.
Never use this if you suspect a flag / inverted flag pattern is forming.
Go to www.phi-deltalytics.com and sign up for a FREE trial today!
Let us know if you have any questions or recommendations. We are here for your success!
Disclaimer:
It should not be assumed that the methods, techniques, or indicators presented will be profitable or that they will not result in losses. Past results are not necessarily indicative of future results. This is not a solicitation of any order to buy or sell.

PD Crypto Performer (Backtest)Description:
This is the backtesting version of the PD Crypto Performer (Alert) . The strategy assumes the same capital amount invested ($10,000) each trade. You can also see how your capital grows over time by enabling the reinvesting proceeds option. For details, please check out this tutorial . The backtesting results could be easily improved in live trading by following the recommended methods of use below.
To assist the decision-making process, the code currently references BTCUSD. As a result, it is only suitable for crypto traders. However, we are working on the stock and forex versions, and the Performer will have these compatibilities soon.
Most importantly, our signals DO NOT REPAINT !
Recommended Use:
- Time Frame: 1HR
- Asset: Large cap crypto assets.
For lower risk tolerance, we recommend using the indicator on ETHUSD. For maximizing profits, we recommend using the indicator on BCHUSD.
- Always set stop loss according to your own risk tolerance
- Take profits along the way.
Recommended Use for Advanced Traders:
- Position sizing:
Larger position if the 1HR signal is in the same direction compared to the 4HR trend.
Smaller position if the 1HR signal is in the opposite direction compared to the 4HR trend.
- Better entry/exit points:
Track the 1HR signal for the asset you are trading on other exchanges along with the BTCUSD 1HR signal. Sometimes, the signals from different exchanges occur with a 1-2 hour difference. You could use these earlier signals along with a lower time frame (eg. 15min) entry confirmation from your own exchange for better entry / exit points.
Go to www.phi-deltalytics.com and sign up for a FREE trial today!
Let us know if you have any questions or recommendations. We are here for your success!
Disclaimer:
It should not be assumed that the methods, techniques, or indicators presented will be profitable or that they will not result in losses. Past results are not necessarily indicative of future results. This is not a solicitation of any order to buy or sell.

Dompeet Pompeet (Breakout bot)Dompeet Pompeet is my first attempt at a viable swingtrading algo.
It uses volatility and some trend analysis to enter trade when the market is about to breakout or break down. Having a trailing stop locks in profits and prevents runaway losses for low drawdown and 2:1 profit factor.
Settings to use:
BTCUSD or XBTUSD
4hr Timeframe or 2hr or 1hr (not shorter)
Bars window: 13, 16 or 20 bars
Moving average settings: 100/10 EMA to confirm trend
Trade the Trend - check on to only take trades long in a confirmed uptrend (vice versa short), otherwise it will attempt to buy and sell counter trend, which increases profits but also increases loss rate.
Trailing stop, values from 2-5% give the best results.
Take with a pinch of salt, there are some bugs in pine script which are difficult to track down but overall I'm pleased with the idea.

JackTrendChaser V3Hi everyone! I am so thrilled to announce this!
>> LIMITED TIME OFFER, read below! <<
My name is Jack and I have been trading trends using TA on Forex for 10 years now and have within the past two years been trading Bitcoin and other cryptocurrencies.
I am a part time trader and developer. On a daily basis I work as a software developer creating various algorythms for big data usage - such as machine learning etc. and I have found a passion in creating scripts to predict major trend moves. Which is why I would like to share this script (strategy) with you all!
Looking at the stats it looks amazing! 100% profitability - who doesn't want that?! But that doesn't mean it cannot be improved - I am daily looking into how I can improve this to become even more profitable.
Currently the script have been tested with BTC and ETH:
BTC = 100% profitability and 9 trades since 2016
ETH = 83% profitability and 6 trades since 2016 with a drawdown of $5.
Now - 9 and 6 trades since 2016 isn't many trades but it suites my way of trading perfectly! I aim for the major trends and try to hit the pullbacks as soon as possible.
You can use this script alone or with other complimenting indicators. I like to draw some support and resistance levels for even further verification.
TRIAL OFFER:
Everyone is offered a 15 days trail.
Let me know in the comments if you would like a trail. Please do not PM me for trails.
>> LIMITED TIME OFFER <<
Since this is my first script to publish on TradingView I am offering the FIRST 10 traders a LIFETIME access to the script for a very small price! After that everyone else will be able to buy acces for 1m, 6m, 1y or lifetime (but at a higher price).
So how do you become one of the first 10?! Simpel - just PM me for the details.
I will update this post when the first 10 has been chosen.
>> OBS: I might be away from TradingView up to 24hours at a time because of my job - but don't panic! I will keep track of every message and get back to everyone as soon as possible!
Best regards
Jack

inwCoin's CDC ActionZone V.2 Strategy + FixedTP% + ATR%This indicator is upgrade version of my first CDC Action Zone v2 strategy.
- I added Take profit target #1 and #2 in setting instead of trailing start/stop ( because that one need bot to track trailing for max performance )
- I also added ATR% so we'll do nothing if market don't have any volatility ( like BTCUSD in 9-10/2018 ), we'll start entry short/long again if the volatility come
The result is incredibly good!
This backtest result is optimized for Bitmex ( XBTUSD ) only. If you need to backtest with another coin, please try it yourself :)
Exchange : Bitmex
Coin : XBTUSD ( perpetual )
Timeframe : 4H
Date range : 2018/1 - 2018/11
For : Trade by hand, just enter when signal show up and then set TP and stop then leave it be.
Config
Trade % = 20 ( You can increase trade size of your total port but it will get you into more risky trade. ( but yes, more profit ) ... u can increase trade size if you have enough profit
TP1&2 = 100 both ( I tried many value and found out both 100 give best result )
Stop % = 50 ( so this trade is RR = 2 nice! )
Leverage = 5 ( so we can withstand the price fluctuation and not get liquidated, if you trade spot, please choose 1 also, please adjust TP and stop accordingly eg. leverage 1 / TP = 20 / SL = 10 )
Trade Direction = Both ( for margin market, if you want to trade spot like Binance you can choose long only )
ATR period = 14 ( how many candle you want to calulate ATR )
ATR Percent = 1.7 ( You can adjust this value for any coin of your choice, this strategy will enter trade if current ATR% > ATR in config to avoid total sideway market )
Above is the critical parameter for trading by hand. You can have fun and working around with it :D
I hope you can make some money from this strategy. Yes, it take time and patience to wait for the right moment before enter any position, and it worth the wait !
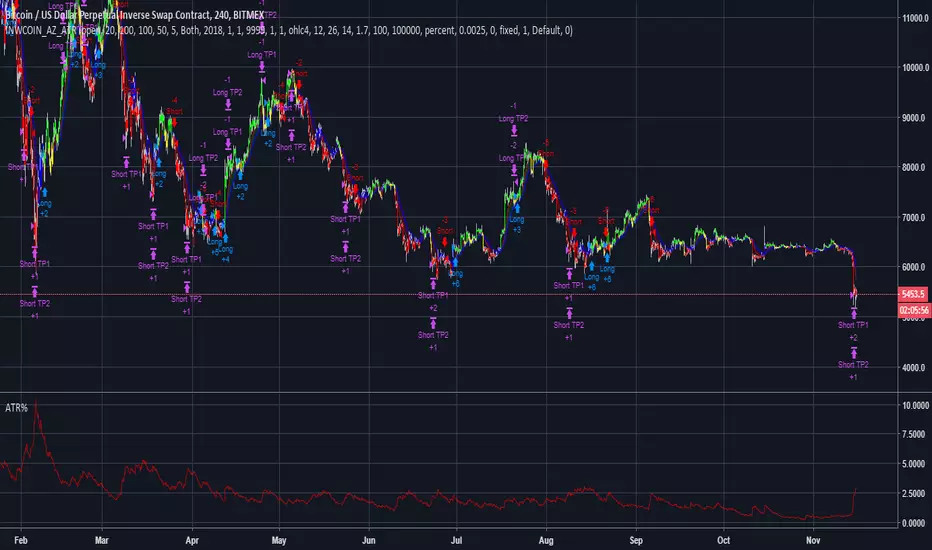
Volatility Elasticity MA - used within itself or for a trendAdjusts to volatility of market movement
attempts to stay flat away from ranging areas
to prevent a creeping cross over (as long as possible)
jumps quickly to track a pump or dump to stay useful
T3 Averages Backtest This indicator plots the moving average described in the January, 1998 issue
of S&C, p.57, "Smoothing Techniques for More Accurate Signals", by Tim Tillson.
This indicator plots T3 moving average presented in Figure 4 in the article.
T3 indicator is a moving average which is calculated according to formula:
T3(n) = GD(GD(GD(n))),
where GD - generalized DEMA (Double EMA) and calculating according to this:
GD(n,v) = EMA(n) * (1+v)-EMA(EMA(n)) * v,
where "v" is volume factor, which determines how hot the moving average’s response
to linear trends will be. The author advises to use v=0.7.
When v = 0, GD = EMA, and when v = 1, GD = DEMA. In between, GD is a less aggressive
version of DEMA. By using a value for v less than1, trader cure the multiple DEMA
overshoot problem but at the cost of accepting some additional phase delay.
In filter theory terminology, T3 is a six-pole nonlinear Kalman filter. Kalman
filters are ones that use the error — in this case, (time series - EMA(n)) —
to correct themselves. In the realm of technical analysis, these are called adaptive
moving averages; they track the time series more aggres-sively when it is making large
moves. Tim Tillson is a software project manager at Hewlett-Packard, with degrees in
mathematics and computer science. He has privately traded options and equities for 15 years.
You can change long to short in the Input Settings
WARNING:
- For purpose educate only
- This script to change bars colors.
PUI - Protege Ultimate IndicatorEach lines is a potential trade. Some trade are already filtered because its a trend script.
I suggest you to use the following :
- Heikin ashi candle
- Daily chart or 4h chart minimum
- When the 2 lines of the macd are over 0 (long) or under 0 (short) and you get a trigger, i see the best trades with it.
- Use in combo with Investors V.S. Traders to track investors and get the best results.
Important :
- When you are in profit with this tool, you need to move your stop.
- The stop must be over the last heikin ashi candle top for a short.
- The stop must be under the last heikin ashi candle bottom for a long.
Extra :
If you use GodMode in tradingview:
- when you see the yellow dots on the top, you need to take the short on the next red line.
- when you see the yellow dots at the bottom, you need to take the long at the next green line.
Good luck friend!