Simple Trend Following StrategySuper simple short/long entry signal strategy based off the one used by the "Turtles" with 4 simple moving averages rolled into one indicator.
Поиск скриптов по запросу "trend"

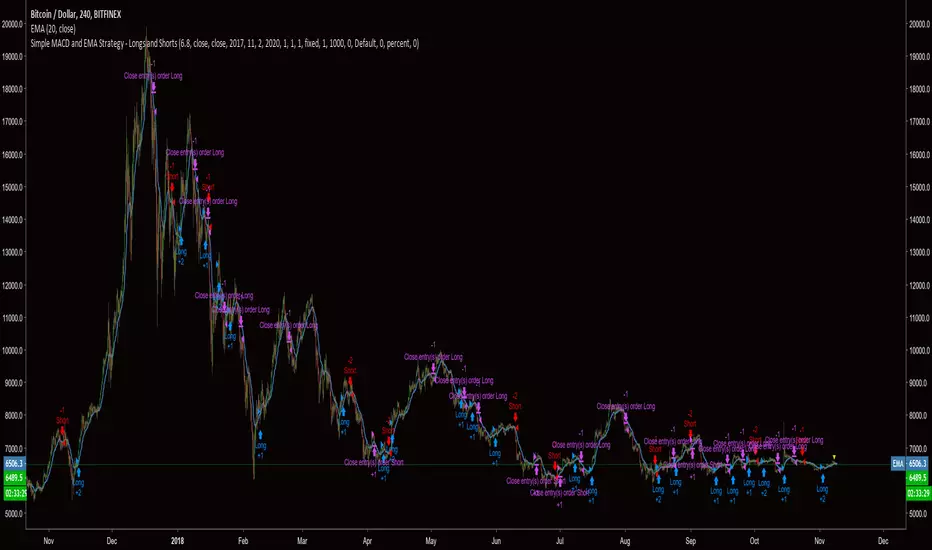
Simple MACD and EMA StrategyThis is a basic Simple MACD and EMA trend following strategy. I will add shorts to the strategy very soon. Best results seem to be on the 4HR charts.
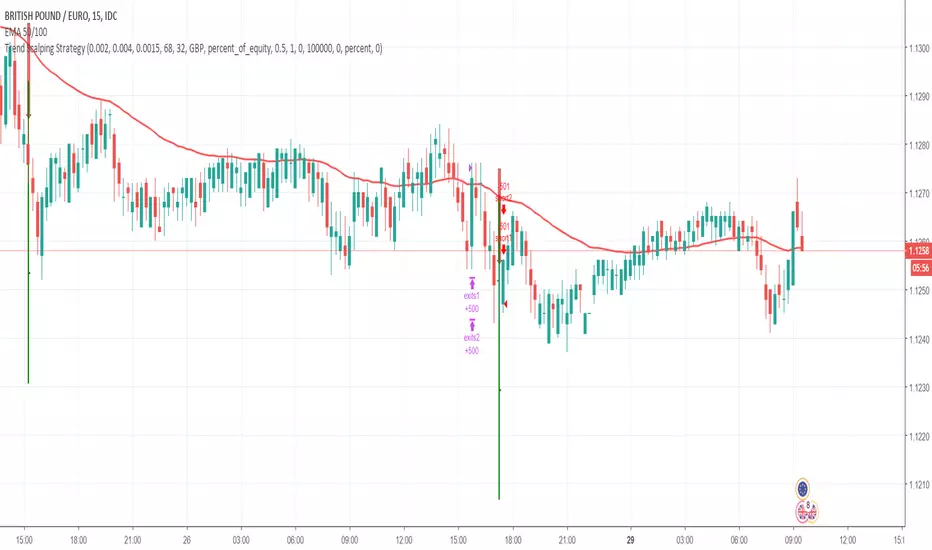
Trend Scalping Strategy - ForexHi all,
I have created the attached strategy for my own use primarily but thought I would share it as my experience to date is that it is profitable in particular circumstances, so thought I would open this out to the community to see if it can be successfully applied on any other pairs and timeframes.
I have protected the source code at this time - mainly because it needs massive tidying up! If I ever get time to do this then I will
The concept of the strategy is based upon the slingshot method - the strategy fundamentally does the following:
- Tests each candle for a new short term trend based upon EMAs
- If there is a new trend, check the RSI and ensure it isnt above the upper RSI threshold (for long positions) and below the lower RSI threshold (for short positions)
- If it passes the RSI check, entry is valid and draws a bar on the chart to show the opening entry position, stop loss position, take profit 1 and take profit 2 positions.
I have backtested this across 28 pairs on the M15 timeframe, comprising of a total of 140,000 candles (35,000 hours of trading). Across this period, 18 of the 28 pairs I looked at were profitable, with overall significant profit if live traded across the 28.
I have live tested 5 pairs on the same timeframe:
- GBPJPY
- GBPUSD
- GBPEUR
- CADJPY
- EURJPY
These pairs have to date given a rough ROR (Return on Risk) position of approx 60% average per trade.
All of the above has been done with the following inputs:
- RSI Upper - 68
- RSI Lower - 32
- Stop Loss - 0.0015
- TP1 - 0.002
- TP2 - 0.004
The SL and TPs are based on a decimal entry of a percentage movement - i.e. the Stop loss above reflects a 0.15% movement, etc etc. Obviously if this were to be tested on longer time frames it is likely that these would need to be larger figures.
I have also tested this live with great success on the S&P 500 and the FTSE, with the following settings:
Indicator Timeframe TP1 TP2 SL Upper Lower
FTSE M5 0.0015 0.004 0.001 70 30
SPX M5 0.0015 0.004 0.001 75 35
Three key notes on trading this below - THESE ARE VERY IMPORTANT!
- This is NOT a high strike rate strategy. Strike rate on profitable pairs is between approx 45 and 55% (although I have seen as low as 35% and still seen significant profit). This has two natural conclusions - risk management is VITAL (I risk 0.5% on each trade, but this may in fact be high for this strategy), and be prepared for potentially significant drawdowns. I have seen certainly drawdowns of 20 consecutive losing trades (counting TP1 and TP2 as 2 trades) and probably longer, which obviously means drawdowns of 10% or greater. The other thing to bear in mind is that with this kind of strike rate, you shouldnt be setting TP1 at a 1:1 risk reward or lower.
- Take Profit 1 is easy - straight Stop and Limit orders. Take Profit 2 is a trailing stop with a start point of the limit for TP1, with then a trailing stop of this distance. This means that should you win on TP1, TP2 is a risk free trade but also trails in for profit if TP2 isnt reached (which it normally isnt). DO NOT set TP2 as a standard stop and limit, this rapidly makes this strategy unprofitable. The point here is that if you reach TP1 you are in some form of trend where you want to capture as much profit as you can.
- Do not enter a trade mid candle. The strategy is based upon the close of the trending candle not the "live" price during this candle, so no need to rush into a trade. If you enter mid candle you will find more often than not that the indicator wasnt for a valid trade by the candle close.
Also, standard disclaimer - past performance is no guarantee of future performance, and if you choose to use this strategy/indicator you do so 100% at your own risk. As a minimum, pick your pairs carefully - I have found particular unprofitability with this strategy with the AUD and NZD pairs so I have ruled these out completely at present, although with different timeframes and inputs these may of course be profitable.
I hope this is helpful for someone...I'd welcome any feedback or other setups where this is profitable.
Moving forward, I want to do some more work on this strategy to rule out some of the more negative trades, and I primarily intend to do this using pivots - however this will be an as and when I get chance.
Adaptive Trend OscilatorAdaptive strategy for strong move starting points. When it capture signal stay in that direction until lost momentum or get a counter signal
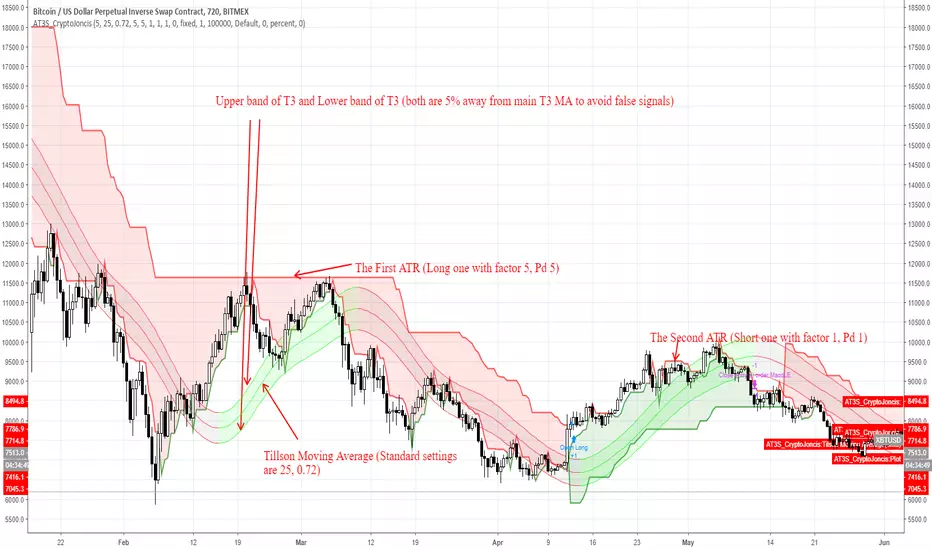
ATR and T3 strategyT3 Moving Average indicator was originally developed by Tim Tillson in 1998/99.
T3 Moving Average is considered as improved and better to traditional moving averages as it is smoother and performs better in trending market conditions.
It offers multiple opportunities when the price is in the state of retracement and therefore allows to minimize your exposed risk and allowing your profits run.
This strategy is for trend followers who are patient enough to have 6-10 trades per year.
What's included in strategy?
Two ATR (Code was taken from J.Dow and modified)
Tillson Moving average
Enter long signal:
When both ATR (Long and Short) are in uptrend and the bar closes above Upper Tillson's moving average band: Enter Long
Exit Long signal:
When hl2 is lower than Lower Tillson Moving Average band
Enter short signal:
When both ATR (Long and Short) are in downtrend and the bar closes below Lower Tillson's moving average band: Enter Short
Exit Shortsignal:
When hl2 is higher than Upper Tillson's Moving Average band
Best to use with Bitcoin on 12H TF
Can be used for different time frames as well but the settings must be adjusted accordingly
Remember, overtrading can be harmful to your trading account.
If this is helpful for you, consider a tip
BTC: 3FiBnveHo3YW6DSiPEmoCFCyCnsrWS3JBR
ETH: 0xac290B4A721f5ef75b0971F1102e01E1942A4578
Created by CryptoJoncis
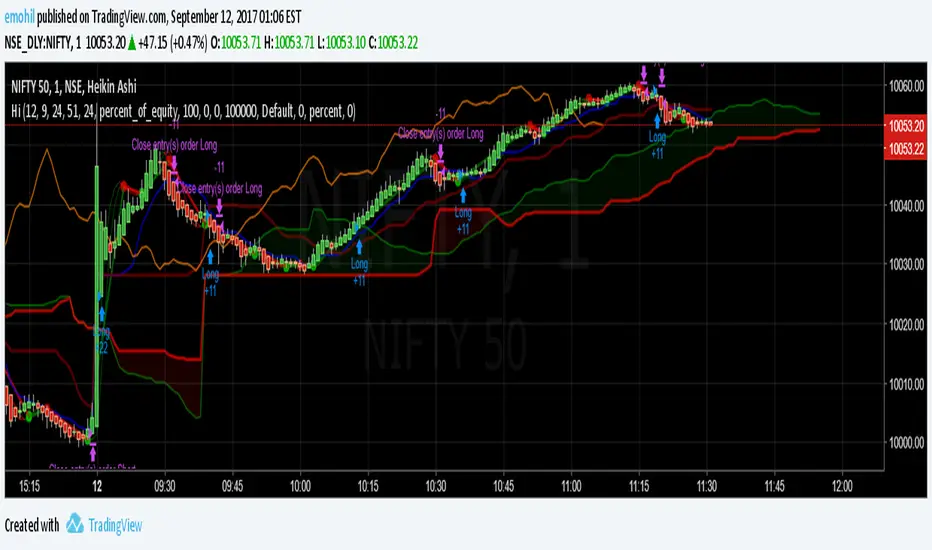
quit your bullshit! Heikin-Ashi Backtest with Real Candle ValuesMade in a few minutes to debunk all the bullshit going around tradingview and everywhere about "heikin-ashi" being a holy grail trend indicator.
Do not be deceived.
Heikin-Ashi is a beautiful way to remove much of the noise in markets, and is light on the eyes. (nice and smooth!)
I personally use heikin-ashi as a way to remove a lot of the clutter in the markets, allowing me to trade with less emotion.
While heikin-ashi is a great way to visualize trends, it is NOT a good trend indicator because its displayed values do not align with actual trading values.
Therefore, entry and exit points for many of the ideas published about heikin-ashi for trade are inaccurate.
::: When Heikin-Ashi changes colour for x candles, a new trade is created on the open of the following real candle.
In practice, Heikin-Ashi is much closer to break even.
As tested, Heikin-Ashi trend trading works better on pairs that have clearer definitions of trends and are less often in consolidation. (ex. USDJPY)
Usage:
Switch to normal candlestick chart.
Features:
Change the period for new trades. (For example: x amount of red candles after a green candle to signify short trade)

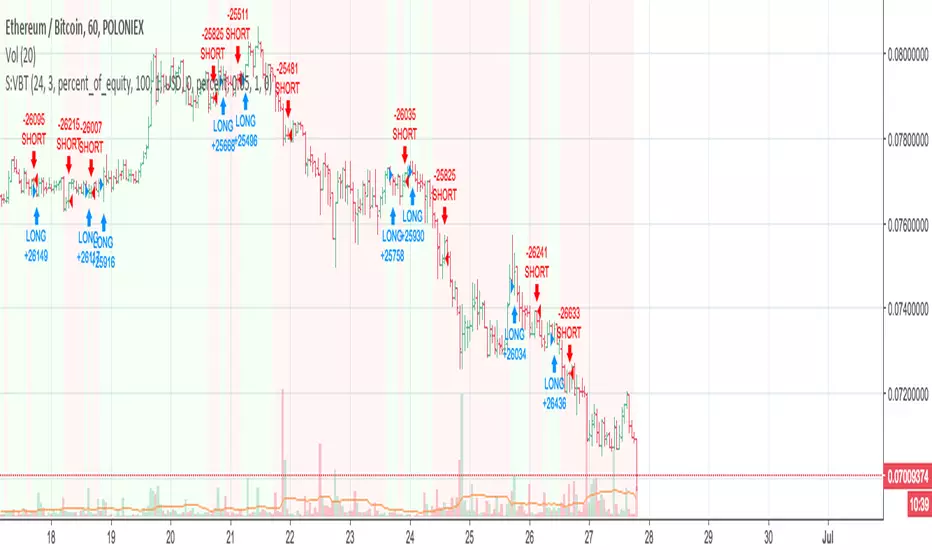
Smart Money Index (SMI) Backtest Attention:
If you would to use this indicator on the ES, you should have intraday data 60min in your account.
Smart money index (SMI) or smart money flow index is a technical analysis indicator demonstrating investors sentiment.
The index was invented and popularized by money manager Don Hays. The indicator is based on intra-day price patterns.
The main idea is that the majority of traders (emotional, news-driven) overreact at the beginning of the trading day
because of the overnight news and economic data. There is also a lot of buying on market orders and short covering at the opening.
Smart, experienced investors start trading closer to the end of the day having the opportunity to evaluate market performance.
Therefore, the basic strategy is to bet against the morning price trend and bet with the evening price trend. The SMI may be calculated
for many markets and market indices (S&P 500, DJIA, etc.)
The SMI sends no clear signal whether the market is bullish or bearish. There are also no fixed absolute or relative readings signaling
about the trend. Traders need to look at the SMI dynamics relative to that of the market. If, for example, SMI rises sharply when the
market falls, this fact would mean that smart money is buying, and the market is to revert to an uptrend soon. The opposite situation
is also true. A rapidly falling SMI during a bullish market means that smart money is selling and that market is to revert to a downtrend
soon. The SMI is, therefore, a trend-based indicator.
Some analysts use the smart money index to claim that precious metals such as gold will continually maintain value in the future.
You can change long to short in the Input Settings
WARNING:
- For purpose educate only
- This script to change bars colors.

Nick's Momentum Trading Strategy - Beats Buy and Hold manifolds!This script works on the principle of short-term mean reversion and long term trend following, and uses minimal parameters to ensure no overfitting.
The scripts beats buy and hold for almost all major pairs that satisfy the following conditions:
- are trading on multiple exchanges as either ALTBTC or ALTUSD pairs
- have good volume available with them
- have an established history - (try not to use this script with really new pairs)
To run the script, follow these rules:
- script should be run on ALTBTC pair
- set first parameter such that when multiplied with resolution of chart, we get a whole day/week/month, etc. e.g. for a '4H' chart, set this to multiples of 6. The reason being that most algorithmic rebalancing in cryptosphere happens at these times, and we want to make effective use of this.
- set second parameter in the range of 1-6 - this is the smoothing factor (ema) we want to apply to our indicator (governed by our first parameter) - more smoothing = lesser trades. See what works for you.
- Last parameter is a filter condition. Just check/uncheck it once to see if market works better with this on or off.
- If script does not beat buy and hold on this pair (rarely), don't use script on this pair at all.
Access available only to friends. I do code trading strategies on request - so, let me know if you have a good set of rules to create a strategy.
PeBAS €$ 5minMy EuroDollar Scalper Script for the 5min Timeframe.
Script analyses the Trend and scalp only in the right direction. In short-trends we scalp short, in long-trends we scalp long. Everything else is stupid, i think.
Take care, there is no Stop Loss.
The script does not repaint!
Try it and think about your positions. Start for example with very small positions and get a ffeling for the script. And enjoy!
Take care in have the sunshine in your heart ... :)

Average Directional Movement Index Rating Backtest The Average Directional Movement Index Rating (ADXR) measures the strength
of the Average Directional Movement Index (ADX). It's calculated by taking
the average of the current ADX and the ADX from one time period before
(time periods can vary, but the most typical period used is 14 days).
Like the ADX, the ADXR ranges from values of 0 to 100 and reflects strengthening
and weakening trends. However, because it represents an average of ADX, values
don't fluctuate as dramatically and some analysts believe the indicator helps
better display trends in volatile markets.
You can change long to short in the Input Settings
WARNING:
- For purpose educate only
- This script to change bars colors.

WhenMewn 5.0Green Overlay = Trending up
Red Overlay = Trending down
Green Highlighted candle = Up Trend Confirmation.
Red Highlighted candle = Down Trend Confirmation.
Tested on 1hr timeframes.

Vertical Horizontal Filter BacktestVertical Horizontal Filter was initiated by Adam White. It was first published
in a magazine called “Issues of Futures” in August, 1991. The Vertical Horizontal
Filter (VHF) is a very common Indicator used by traders to find out the Phase of
a Price Trend. Normally, a price trend can be in a Trending Phase or a Congestion
Phase/Choppy Movement Phase. Adam White created this particular Technical Indicator
to determine whether prices are trending in a particular direction or are they going
through a transitional period. He used it to measure the range of Futures available
in the market.
You can change long to short in the Input Settings
WARNING:
- For purpose educate only
- This script to change bars colors.

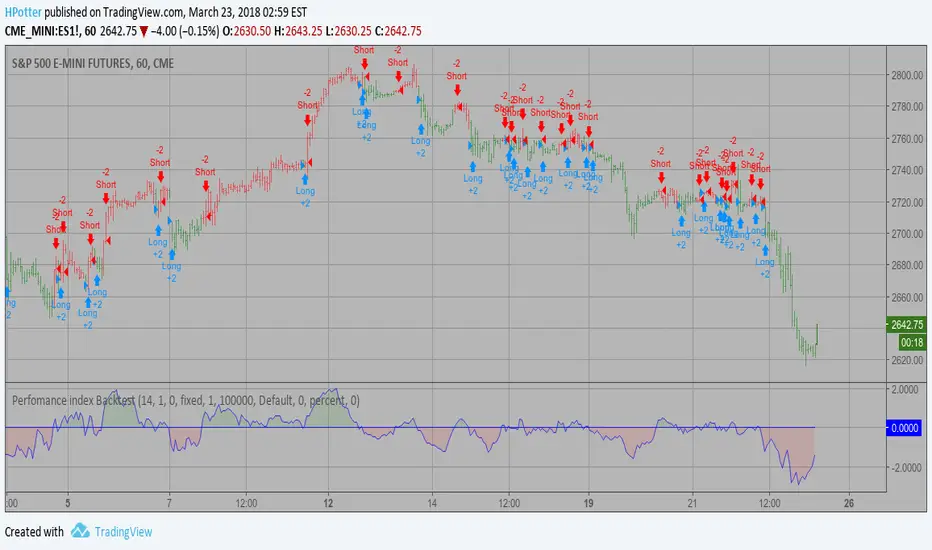
Perfomance index Backtest The Performance indicator or a more familiar term, KPI (key performance indicator),
is an industry term that measures the performance. Generally used by organizations,
they determine whether the company is successful or not, and the degree of success.
It is used on a business’ different levels, to quantify the progress or regress of a
department, of an employee or even of a certain program or activity. For a manager
it’s extremely important to determine which KPIs are relevant for his activity, and
what is important almost always depends on which department he wants to measure the
performance for. So the indicators set for the financial team will be different than
the ones for the marketing department and so on.
Similar to the KPIs companies use to measure their performance on a monthly, quarterly
and yearly basis, the stock market makes use of a performance indicator as well, although
on the market, the performance index is calculated on a daily basis. The stock market
performance indicates the direction of the stock market as a whole, or of a specific stock
and gives traders an overall impression over the future security prices, helping them decide
the best move. A change in the indicator gives information about future trends a stock could
adopt, information about a sector or even on the whole economy. The financial sector is the
most relevant department of the economy and the indicators provide information on its overall
health, so when a stock price moves upwards, the indicators are a signal of good news. On the
other hand, if the price of a particular stock decreases, that is because bad news about its
performance are out and they generate negative signals to the market, causing the price to go
downwards. One could state that the movement of the security prices and consequently, the movement
of the indicators are an overall evaluation of a country’s economic trend.
You can change long to short in the Input Settings
WARNING:
- For purpose educate only
- This script to change bars colors.
Trending 77Current Price > 7 on 343
Current Price > 77 on 343
7 on 343 is Trending up
77 on 343 is trending up

Hull MA-X + Ichimoku Kinko Hyo StrategyHull MA-X:
The Hull MA involves the weighted moving average ( WMA ) in its calculation.
First, calculate the WMA with period (n / 2) and multiply this by 2. Remember ‘n’ is the time period configurable based on the trader’s requirement.
Second, calculate the WMA for period “n” and subtract if from the first step. Thirdly, calculate the weighted moving average with period sqrt (n) using the data from the second step. You can take a look at the below formula:
Hull MA= WMA (2*WMA (n/2) − WMA (n)), sqrt (n))
The default setting is 12 periods in this strategy, fast Hull MA crossing slow Hull MA will generate a circle on charts.
Ichimoku Kinko Hyo:
The Ichimoku Kinko Hyo system includes five kinds of signal, of which this strategy uses four signals i.e. Tenkan Sen / Kijun Sen Cross, price crosses the Kijun Sen, Chikou Span and Kumo. Although the Chikou Span, Senkou Span A and Senkou Span B (Kumo) are shifted into the past/future, these trigger signals enhances the strategy.
The Tenkan Sen, also known as the Turning or Conversion line, is a moving average of the highest high and lowest low over the last 9 periods in this strategy.
The Kijun Sen, also known as the Standard or Base line, is a moving average of the highest high and lowest low over the last 24 periods in this strategy.
The Chikou Span, also known as the Lagging line, is the closing price plotted 24 periods behind in this strategy.
The Senkou Span A, also known as the 1st leading line, is a moving average of the Tenkan Sen and Kijun Sen and is plotted 24 periods ahead in this strategy.
The Senkou Span B, also known as the 2nd leading line, is a moving average of the highest high and lowest low over the last 51 trading days is plotted 24 periods ahead in this strategy.
As with most technical analysis methods, Ichimoku is likely to produce frequent conflicting signals in non-trending markets, So in addition to Ichimoku Kinko Hyo, the Hull MA is used, which is popular amongst some day traders, in combination it attempts to give an accurate signal by eliminating lags and improving the smoothness of the line.
The Hull MA Cross in combination with Ichimoku Kinko Hyo signals tries to give an accurate signal by eliminating lags and improve the smoothness of price activity. Please note that price trends can and do change often, so your readings of the charts and this trading system should be probabilistic, rather than predictive.
Ichimoku Kinko Hyo + HULL-MA_X + MacDThe Ichimoku Kinko Hyo system includes five kinds of signal, of which this strategy uses the most recent of ones i.e. Tenkan Sen / Kijun Sen Cross and price crosses the Kijun Sen. As the Chikou Span, Senkou Span A and Senkou Span B are shifted into the past/future, the trigger signals will be only be used for visual confirmation and not part of the strategy.
The Tenkan Sen, also known as the Turning or Conversion line, is a moving average of the highest high and lowest low over the last 9 periods in this strategy.
The Kijun Sen, also known as the Standard or Base line, is a moving average of the highest high and lowest low over the last 24 periods in this strategy.
The Chikou Span, also known as the Lagging line, is the closing price plotted 24 periods behind in this strategy.
The Senkou Span A, also known as the 1st leading line, is a moving average of the Tenkan Sen and Kijun Sen and is plotted 24 periods ahead in this strategy.
The Senkou Span B, also known as the 2nd leading line, is a moving average of the highest high and lowest low over the last 51 trading days is plotted 24 periods ahead in this strategy.
Moving average convergence divergence (MaCD) is a trend-following momentum indicator that shows the relationship between two moving averages of prices. The MaCD is calculated in this strategy by subtracting the 24-day exponential moving average (EMA) from the 12-day EMA. A nine-day EMA of the MACD, called the "signal line", aMaCD in this case, is then plotted on top of the MaCD. In this strategy, MaCD/ aMaCD Cross is functioning as a trigger for buy and sell signals.
As with most technical analysis methods, Ichimoku is likely to produce frequent conflicting signals in non-trending markets, So in addition to Ichimoku Kinko Hyo, the Hull MA is popular amongst some day traders, as the indicator which in combination with MaCD attempts to give an accurate signal by eliminating lags and improving the smoothness of the line.
Alan Hull, developed this moving average indicator and hence it’s called the Hull MA.
Now, let’s dissect how the Hull moving average is calculated.
The Hull MA involves the weighted moving average (WMA) in its calculation.
First, calculate the WMA with period (n / 2) and multiply this by 2. Remember ‘n’ is the time period configurable based on the trader’s requirement. The default setting is 12 periods in this strategy, fast Hull MA crossing slow Hull MA will generate a circle on charts.
Second, calculate the WMA for period “n” and subtract if from the first step. Thirdly, calculate the weighted moving average with period sqrt (n) using the data from the second step. You can take a look at the below formula:
Hull MA= WMA (2*WMA (n/2) − WMA (n)), sqrt (n))
The Hull MA Cross in combination with Tenkan Sen / Kijun Sen Cross and MaCD tries to give an accurate signal by eliminating lags and improve the smoothness of price activity. Please note that price trends can and do change often, so your readings of the charts and this trading system should be probabilistic, rather than predictive.

Kaufman Moving Average Adaptive (KAMA) Backtest Everyone wants a short-term, fast trading trend that works without large
losses. That combination does not exist. But it is possible to have fast
trading trends in which one must get in or out of the market quickly, but
these have the distinct disadvantage of being whipsawed by market noise
when the market is volatile in a sideways trending market. During these
periods, the trader is jumping in and out of positions with no profit-making
trend in sight. In an attempt to overcome the problem of noise and still be
able to get closer to the actual change of the trend, Kaufman developed an
indicator that adapts to market movement. This indicator, an adaptive moving
average (AMA), moves very slowly when markets are moving sideways but moves
swiftly when the markets also move swiftly, change directions or break out of
a trading range.
You can change long to short in the Input Settings
Please, use it only for learning or paper trading. Do not for real trading.

cooltoyz: The Turtle SurferThis strategy applies the old tested turtle trading strategy, defining a channel and riding the trend, but
It has some twists tough, to make it adapt on the fly to changes in market conditions.
Since all parameters can be adjusted from the inputs, the strat can (and needs) to be fine tuned for the current values of an asset. for example, for gold values, it works good for years. for btc, it breaks for dates with values under 1500$. that's because 1% of 800 is not the same as 1% of 2400$..... Yeah, data fitting, i know all that....
Some of the parameters work well only for low volatility markets, others are designed exactly to capture volatility. So the parameters must be tested, turned on-off to see how well they do. The default values ARE NOT a generic good for all, most surely.
The Turtle Surfer moves slowly, but it's prepared to rabbit jump in/out if some moon/doom event shows up without invitation :)
If you want to play with the strat, start with all checkboxes off, then turn on/off each one and see the results for the asset you want.
I have had good results in xau, btc and eth

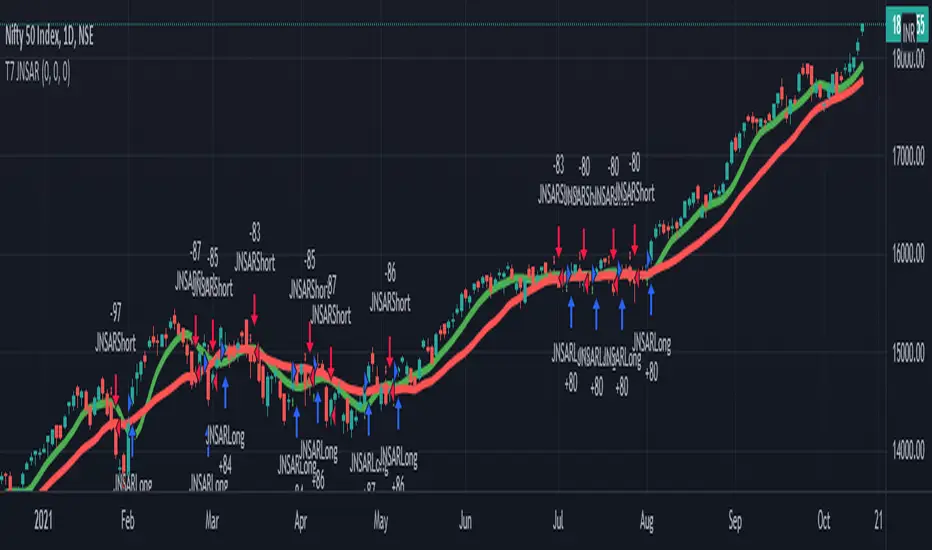
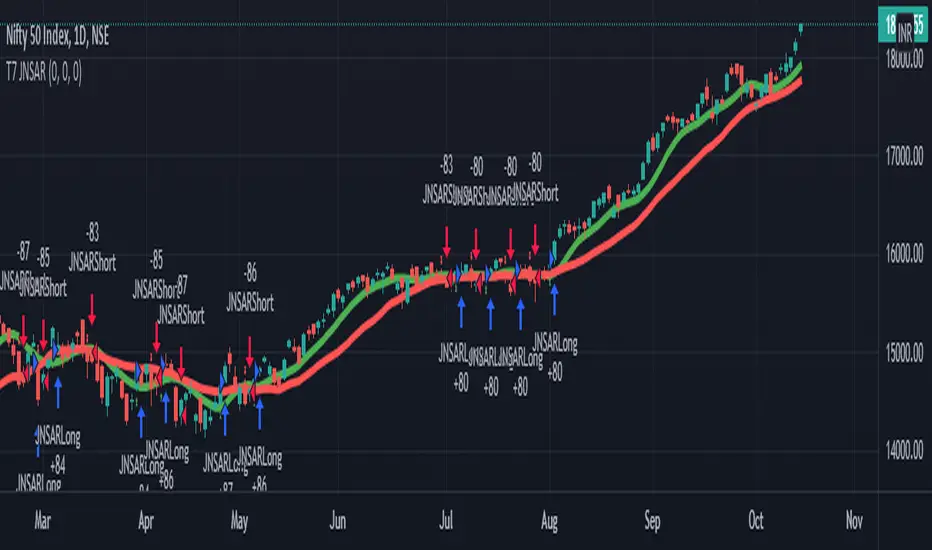
T7 JNSARJNSAR stands for Just Nifty -0.14% Stop & Reverse. This is a Trend Following Daily Bar Trading System for NIFTY -0.14% . Original idea belongs to ILLANGO @ I coded the pine version of this system based on a request from @stocksonfire. Use it at your own risk after validation at your end. Neither me or my company is responsible for any losses you may incur using this system. Hope you like this system and enjoy trading it !!!
Updated V3 code for the T7 JNSAR system earlier published here V2 and here V1
Following updates made to the code
1. Added a 22 Period Simple moving average filter over and above the standard JNSAR value for generating trading signals. This simple filter reduces the whipsaw trades drastically along with similar improvements in the max draw down and overall profitability of the system. The SMA filter is turned ON by default but can be turned OFF by user through the settings window.
2. Backtest option is now turned ON by default.
Also am republishing the trading rules here again with some modification
1. Go Long when the daily close is above the JNSAR line. Go Short when the daily close is below the JNSAR line. JNSAR line is the varying green line overlayed over the price chart. Once a signal comes at market close enter in the direction of the signal @ market price @ next day market open.
2. Trade only Nifty -0.14% Index. This system was developed and backtested only for NIFTY -0.14% Index. So trade in its Futures or Options, as you may deem fit. My recommendation is to choose futures for simplicity. If you want to reduce the trading cost and go with options, trade with deep in the money options, preferably 2 strikes far from the spot price.
3. Trade all signals. Markets trend only 30-35% of the time and hence the system is only accurate to that extend. But system tends to make enough money, in this small trending window, to keep the overall profitability in good health. But one never knows when a big trend may come and when it comes its absolutely imperative that you take it. To ensure that, trade all signals and don't be choosy about what signals you are going to trade. Also I wouldn't recommend using your own analysis to trade this system. Too many drivers will crash the car.
4. Like all trend following systems, this system will have many whipsaws during flat markets along with large trade and account drawdowns. Also some months and even years may not be profitable. But to trade this system profitably, it is necessary to take these in one's stride and keep trading. As the backtester results from 1990 to 2017 proves, this system is profitable overall thus far. Take confidence from that objective fact.
5. Trade with only that amount of money you can afford to loose. Initial capital that you need to have to trade one lot of NIFTY -0.14% should be atleast - (Margin Money required to take and hold 1 lot position + maximum drawdown amount per lot)*1.2. Be prepared to add more if need be, but the above formula will give a rough idea of what you need to have to start trading and be in the game always.
6. Place an After Market Order @ Market Price with your broker after market close so that you get to execute the trade next trading day @ Market open to capture near similar price as the daily open price seen on the chart. This execution mode will give you the best chance to minimize the slippage and mimic the backtester results as closely as practically possible.
7. Follow all the 6 rules above religiously, as if your life depends on it. If you cant, then don't trade this system; You will certainly loose money.
Happy Trading !!! As always am looking out for your valuable feedback.

T7 JNSARUpdated code for the T7 JNSAR system earlier published here -
Following updates made to the code
1. Buy / Sell arrows now appear when the corresponding conditions are met.
2. Support for Heikin-Ashi Candles added
3. Different Backtesting Position Sizing Algorithms added for evaluation
Also am republishing the trading rules here again with some modification
1. Go Long when the daily close is above the JNSAR line. Go Short when the daily close is below the JNSAR line. JNSAR line is the varying green line overlayed over the price chart. Once a signal comes at market close enter in the direction of the signal @ market price @ next day market open.
2. Trade only Nifty Index. This system was developed and backtested only for NIFTY Index. So trade in its Futures or Options, as you may deem fit. My recommendation is to choose futures for simplicity. If you want to reduce the trading cost and go with options, trade with deep in the money options, preferably 2 strikes far from the spot price.
3. Trade all signals. Markets trend only 30-35% of the time and hence the system is only accurate to that extend. But system tends to make enough money, in this small trending window, to keep the overall profitability in good health. But one never knows when a big trend may come and when it comes its absolutely imperative that you take it. To ensure that, trade all signals and don't be choosy about what signals you are going to trade. Also I wouldn't recommend using your own analysis to trade this system. Too many drivers will crash the car.
4. Like all trend following systems, this system will have many whipsaws during flat markets along with large trade and account drawdowns. Also some months and even years may not be profitable. But to trade this system profitably, it is necessary to take these in one's stride and keep trading. As the backtester results from 1990 to 2016 proves, this system is profitable overall thus far. Take confidence from that objective fact.
5. Trade with only that amount of money you can afford to loose. Initial capital that you need to have to trade one lot of NIFTY should be atleast - (Margin Money required to take and hold 1 lot position + maximum drawdown amount per lot)*1.2. Be prepared to add more if need be, but the above formula will give a rough idea of what you need to have to start trading and be in the game always.
6. Place an After Market Order @ Market Price with your broker after market close so that you get to execute the trade next trading day @ Market open to capture near similar price as the daily open price seen on the chart. This execution mode will give you the best chance to minimise the slippage and mimic the backtester results as closely as practically possible.
7. Follow all the 6 rules above religiously, as if your life depends on it. If you cant, then don't trade this system; You will certainly loose money.
Happy Trading !!! As always am looking out for your valuable feedback.
T7 JNSARJNSAR stands for Just Nifty Stop & Reverse. This is a trend following daily bar trading system for NIFTY. Original idea belongs to ILLANGO @ I coded the pine version of this system based on a request from @stocksonfire. Use it at your own risk after validation at your end. Neither me or my company is responsible for any losses you may incur using this system. Hope you like this system and enjoy trading it !!!
While trading this system you must follow these simple rules.
1. Go Long when the daily close is above the JNSAR line. Go Short when the daily close is below the JNSAR line. JNSAR line is the varying green line overlayed over the price chart. Once a signal comes at market close enter in the direction of the signal @ market price @ next day market open.
2. Trade only Nifty Index. This system was developed and backtested only for NIFTY Index. So trade in its Futures or Options, as you may deem fit. My recommendation is to choose futures for simplicity. If you want to reduce the trading cost and go with options, trade with deep in the money options, preferably 2 strikes far from the spot price.
3. Trade all signals. Markets trend only 30-35% of the time and hence the system is only accurate to that extend. But system tends to make enough money, in this small trending window, to keep the overall profitability in good health. But one never knows when a big trend may come and when it comes its absolutely imperative that you take it. To ensure that, trade all signals and don't be choosy about what signals you are going to trade. Also I wouldn't recommend using your own analysis to trade this system. Too many drivers will crash the car.
4. Like all trend following systems, this system will have many whipsaws during flat markets along with large trade and account drawdowns. Also some months and even years may not be profitable. But to trade this system profitably, it is necessary to take these in one's stride and keep trading. As the backtester results from 1990 to 2016 proves, this system is profitable overall thus far. Take confidence from that objective fact.
5. Initial capital that you need to have to trade one lot of NIFTY should be atleast - (Margin Money required to take and hold 1 lot position + maximum drawdown amount per lot)*1.2. Be prepared to add more if need be, but the above formula will give a rough idea of what you need to have to start trading and be in the game always.
6. Follow all the 5 rules above religiously as if your life depends on it. If you cant, then don't trade this system; You will certainly loose money.
GetTrendStrategyA simple strategy is to determine the trend. Do not use it for real-time transactions. Use it as a Reaffirmation trade entry.

Liquidity Sweep pro📌 Liquidity Sweep Pro – Strategy Description
Liquidity Sweep Pro is a price–action based trading strategy designed to identify liquidity grabs and smart money reversals around key swing highs and lows.
This strategy focuses on moments where price takes out resting liquidity above recent highs or below recent lows, then shows clear rejection and directional intent, which often precedes strong reversals or continuations.
🔍 Core Logic
The strategy is built on three main concepts:
1️⃣ Liquidity Sweep Detection
Identifies recent swing highs and swing lows using pivot structure
Detects when price sweeps above a high or below a low, signaling liquidity collection
2️⃣ CISD Confirmation (Change in State of Delivery)
After a liquidity sweep, the strategy waits for:
Bearish confirmation after sweeping highs
Bullish confirmation after sweeping lows
This confirmation is based on candle behavior and price closing back inside the structure, filtering out false breakouts.
3️⃣ Optional Trend Filter (Hull MA)
An optional Hull Moving Average filter can be enabled to trade:
Longs in bullish conditions
Shorts in bearish conditions
This helps reduce counter-trend trades while keeping the strategy flexible.
🎯 Risk Management
Stop Loss and Take Profit are calculated dynamically using ATR
Fully customizable Risk : Reward ratio
Designed to adapt to different market conditions and volatility levels
⚙️ Recommended Usage
Best suited for intraday and scalping trading
Works well on:
XAUUSD (Gold) – M3 / M5
Crypto – M5 / M15
Indices – M5
The strategy does not repaint and only generates signals after candle close.
⚠️ Disclaimer
This strategy is for educational and research purposes only.
Always test and optimize parameters for your specific market and timeframe before using it in live trading.
