Combo Backtest 123 Reversal & Modified Price-Volume Trend This is combo strategies for get a cumulative signal.
First strategy
This System was created from the Book "How I Tripled My Money In The
Futures Market" by Ulf Jensen, Page 183. This is reverse type of strategies.
The strategy buys at market, if close price is higher than the previous close
during 2 days and the meaning of 9-days Stochastic Slow Oscillator is lower than 50.
The strategy sells at market, if close price is lower than the previous close price
during 2 days and the meaning of 9-days Stochastic Fast Oscillator is higher than 50.
Second strategy
The related article is copyrighted material from
Stocks & Commodities.
WARNING:
- For purpose educate only
- This script to change bars colors.
Поиск скриптов по запросу "trend"

Combo Backtest 123 Reversal & MASS Index This is combo strategies for get a cumulative signal.
First strategy
This System was created from the Book "How I Tripled My Money In The
Futures Market" by Ulf Jensen, Page 183. This is reverse type of strategies.
The strategy buys at market, if close price is higher than the previous close
during 2 days and the meaning of 9-days Stochastic Slow Oscillator is lower than 50.
The strategy sells at market, if close price is lower than the previous close price
during 2 days and the meaning of 9-days Stochastic Fast Oscillator is higher than 50.
Second strategy
The Mass Index was designed to identify trend reversals by measuring
the narrowing and widening of the range between the high and low prices.
As this range widens, the Mass Index increases; as the range narrows
the Mass Index decreases.
The Mass Index was developed by Donald Dorsey.
WARNING:
- For purpose educate only
- This script to change bars colors.

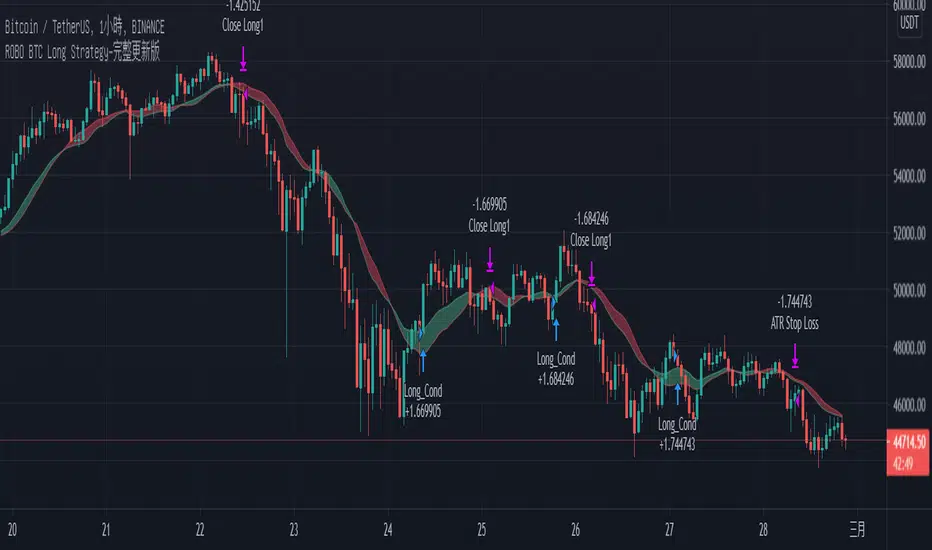
BTC/1H Long Strategy1) At present, six indicators are used for trend combination, including ATR / RSI / ROC / EMA / SMA / MACD .
2) Trend strategy is usually not very good, but any band can be stable profit.
3) BTC / usdt for any exchange, 1 hour time zone.
4) It is expected that the actual measurement will start in February. Please look forward to it.
1)目前使用了六種指標做了趨勢組合,其中包ATR/ RSI / ROC / EMA / SMA /MACD。
2)趨勢策略通常勝率都不太好,但是任何波段都能穩定獲利。
3)適於任何交易所的BTC/USDT,1小時時區。
4)預計3月開始能開始實測,屆時敬請期待。
MACD Price Projected Bands [MPPB] Strategy for NIFTY / BTC 2 minMACD Price Projected Bands is an intraday NON REPAINTING Strategy to be used over BTCUSD and NIFTY on 2mins charts for optimum results!!
How the Strategy works
The strategy uses MACD with standard configuration as its main component.
The adaptive Bands are calculated over the MACD lookback, and MACD crosses of the adaptive bands are projected over the Price for creating a decision logic
A cyclic Trend Filter is used to calculate the Optimum Entry and Exit Points for the Strategy,
Levels are also plotted over the price projected bands for better visualisation of the targets!
What is used !
Macd_config : { fast:12 , slow:26 , signal:9 }
Lookback Length : 55
The Strategy has Provision for Alerts
You get Two signals
1. MPPBS Buy Signal
2. MPPBS Sell Signal
How the Visual Target System Works and How to trade Using this Strategy
An Adaptive Projected Band is constructed using MACD for traders to get Visual inputs regarding targets!!
The Trading Methodologies are in below Charts
For Short Trades
For Long Trades
Strategy Configurations for Backtest
For Englishmen!
The Backtesting Rules in the Strategy calculates only when order gets filled, the basic pyramiding in the strategy is set to 1, i.e The maximum number of entries allowed in the same direction is set to 1,
Also we trade only 1 quantity of the security with initial capital of 100000USD, and The commission type used in the strategy is set to 0.05 USD that means we pay 0.05USD as commissions in every trade!
For Coders!
{
calc_on_order_fills=true,
pyramiding=1,
default_qty_type=strategy.fixed,
default_qty_value=1,
initial_capital=100000,
currency=currency.USD,
commission_type= strategy.commission.cash_per_order,
commission_value = 0.05
}
How can you get access
Only do private message to me, donot use comment box for requesting access!

OBV_RMA_CRYPTO Buy and Hold Destroyer free versionThis is a free version which use part of the logic that I am applying on my destroyer/annihilation series of strategies.
This version its made for 8-12h and works amazingly on the ETH pairs. Can be adapted to others as well
For this example, I used an initial 1$ account, using always full capital on each trade(without using any leverage), together with a 0.1% commission/fees for each deal, on Coinbase broker.
For risk management, we have a hard stop loss on the equity of 25%.
The components for the inside of the strategy are the next one :
1. OBV- SoftKill Version adapted to cryptos
2. ATR - SoftKill Version adapted to cryptos
3. RMA Rolling moving average
The rules here are simple we check for the trend direction with ATR and then we check for cross up or above on OBV and RMA moving average. Based on this we enter long or short.
RISK WARNING
Trading on any financial market involves a risk of loss. Please consider carefully if such trading is appropriate for you. Past performance is not indicative of future results.
If you have any questions or you are interested in trying it, private message me and I will give you as soon as I see the message a trial for it.

KISS Strategy: SMA + EMA//Hello my fellow investors
//I am creating a simple non-cluttered strategy that uses 3(+1) simple means to determine: viability, entry, and exit
//1) Has a consistent trend been maintained for several days/weeks
//2) SH SMA crossover LG SMA = Bullish entry/LG SMA crossover SH SMA = Bearish entry
//3) Use the Slope factor & Weeks in Trend (WiT) to dertermine how strong of an entry signal you are comfortable with
//4) Exit position based on next SMA cross and trend reversal or stop loss%
//3+1) For added confidence in trend detection: Apply MACD check - buy--> MACD line above signal line and corssover below histogram \\ sell --> MACD line below signal line and crossover above histogram.
//*)This code also allows you to determine your desired backtesting date compliments of alanaster
The chart shown has:
Starting Capital: $10,000
Investment percent per trade: 1.5%
Stop Loss: 20%
Take Profit: 100%
Keltner Channel [LINKUSDT] 1HThis is a long-only strategy tested on LINK/USDT, 1 hour bar, from Feb 2019. The entry is determined by the breakout of upper Keltnel Channel and when the +DI is higher than 32. Instead of a fixed stop-loss from the original script , I change the exit to the middle band of the Keltnel Channel. 1st profit target will close 20% of the position. 2nd profit target will close 30% of the position. While the remaining 50% position will be closed when the price closes below the middle band of the Keltnel Channel, to take advantage of big trend. All parameters are adjustable. I added another option to enable or disable the ribbon trend filter.
My thoughts: For the same period, LINK appreciated 3000%. So I guess most in and out strategies couldn’t beat a buy and hold strategy during this period. But this doesn’t mean that this strategy is not feasible as each strategy is designed to only take advantage of a certain pattern or behavior of the market. Also, short term strategies allow you to use leverage and hence enable you to use you capital efficiently. Commission is set to 0.1%, taking account of the slippage.
Suggestion: Please perform walk forward analysis before you use real money for trading. Parameters need to be adjusted from time to time depends on your analysis. Can try using ATR for profit targets as over a longer term, the volatility might drop hence a high fixed % profit targets might not be realistic.
Any suggestions are welcome!

Crypto MultiTrend multi timeframesHello, today I bring you another crypto strategy which can work with multiple timeframes and most of crypto currencies
Its made entirelly of multiple EMA , of different lengths : like super fast, fast, normal, slow and very slow
We also combine a little bit of price action together with the trend direction both for entry and for exits, to have a more precise control.
The rules for long close is above all EMA's, they are in ascending order and the at same time close is bigger than the previous high, and previous high > second previous high, close > 3rd previous high , close > 4th previous high, close > 5th previous high, 5th high > 6th high.
For short we have the same, but instead of high, we use lows, and instead of > we use < .
As exit we have 2 conditions for long and 2 for short
To exit long we have : super fast ema < fast ema and fast ema < normal and normal < slow ema. For short, they would be the opposite, using > sign.
The second exit for long is when our current low crosses below 4 of ours EMA during the same candle. For short, is when the high crosses above 4 of ours EMA during the same candle.
CAUTIOUS : Currently it uses not risk management system, so in this current condition is extremely risky . Be careful
If you have any questions lets me know
RSI of VWAP [SHORT selling]This is SHORT selling version of RSIofVWAP strategy. Settings and Logic are totally different from LONG side version , hence I am publishing it as a new strategy.
Settings
============
VWAP of RSI Length 15
Slow EMA Length 200
Short entry level 25
Cover short level 70
stop loss 5
SHORT Entry
============
condition1 : When RSIofVWAP crossdown below 25 and VWAP is below ema200
condition2: When weekly RSIofVWAP crossdown 70 and VWAP (note : session vwap , not weekly vwap) is below ema200
condition3: Use VIX value , if you want to short when the price is above ema200
vwap RSI crossing down 70 and VIX RSI is cossing up 70
enter short ... This is like falling knife :-)
I need to add the code -- later
if any of above condition is TRUE , SHORT entry will be taken
Take Profit
============
When close less than short entry price and RSIofVWAp is crossing up 25 , take profit ...close 1/3 of the position
Exit
============
When RSIofVWAP crossing up 70 level
Stop Loss
============
Stop Loss is set to 5%
Note:
1. When strategy is in SHORT position , background and bar color changes to gray
2. When strategy is already in short position , possible entries are shown in yellow background
3. RSI Length 15 is working most of the equities on hourly chart. ( RSI length 9 and 14 also works good , but not for all ... You may want to try which setting works for your symbol)
4. weekly VWAP (blue color) is also plotted by default ... you can disable it if you dont want to see it. But there is advantage keeping it on the chart , you can notice whenever weekly VWAP crosses above 70 line , trend is UP ... if you have LONG position you can hold on it ... Hurray :-)
Warning
============
For the educational purposes only

Joseph Nemeth Heiken Ashi Renko MTF StrategyFor Educational Purposes. Results can differ on different markets and can fail at any time. Profit is not guaranteed. This only works in a few markets and in certain situations. Changing the settings can give better or worse results for other markets.
Nemeth is a forex trader that came up with a multi-time frame heiken ashi based strategy that he showed to an older audience crowd on a speaking event video. He seems to boast about his strategy having high success results and makes an astonishing claim that looking at heiken ashi bars instead of regular candlestick bar charts can show the direction of the trend better and simpler than many other slower non-price based indicators. He says pretty much every indicator is about the same and the most important indicator is price itself. He is pessimistic about the markets and seems to think it is rigged and there is a sort of cabal that created rules to favor themselves, such as the inability of traders to hedge in one broker account, and that to win you have to take advantage of the statistics involved in the game. He believes fundamentals, chart patterns such as cup and handle and head and shoulders, and fibonacci numbers don't matter, only price matters. The foundation of his trading strategy is based around heiken ashi bars because they show a statistical pattern that can supposedly be taken advantage of by them repeating around seventy or so percent of the time, and then combines this idea with others based on the lower time frames involved.
The first step he uses is to identify the trend direction in the higher time frame(daily or 4 hourly) using the color of the heiken ashi bar itself. If it is green then take only long position after the bar completes, if it is red then take only short position. Next, on a lower time frame(1 hour or 30 minutes) look for the slope of the 20 exponential moving average to be sloping upward if going long or the slope of the ema to be sloping downward if going short(the price being above the moving average can work too if it's too hard to visualize the slope). Then look for the last heiken ashi bar, similarly to the first step, if it is green take long position, if it is red take short position. Finally the entry indicator itself will decide the entry on the lowest time frame. Nemeth recommends using MACD or CCI or possibly combine the two indicators on a 5 min or 15 min or so time frame if one does not have access to renko or range bars. If renko bars are available, then he recommends a 5 or 10 tick bar for the size(although I'm not sure if it's really possible to remove the time frame from renko bars or if 5 or 10 ticks is universal enough for everything). The idea is that renko bars paint a bar when there is price movement and it's important to have movement in the market, plus it's a simple indicator to use visually. The exit strategy is when the renko or the lowest time frame indicator used gives off an exit signal or if the above conditions of the higher time frames are not being met(he was a bit vague on this). Enter trades with only one-fifth of your capital because the other fifths will be used in case the trades go against you by applying a hedging technique he calls "zero zone recovery". He is somewhat vague about the full workings(perhaps because he uses his own software to automate his strategy) but the idea is that the second fifth will be used to hedge a trade that isn't going well after following the above, and the other fifths will be used to enter on another entry condition or if the other hedges fail also. Supposedly this helps the trader always come out with a profit in a sort of bushido-like trading tactic of never accepting defeat. Some critics argue that this is simply a ploy by software automation to boost their trade wins or to sell their product. The other argument against this strategy is that trading while the heiken ashi bar has not completed yet can jack up the backtest results, but when it comes to trading in real time, the strategy can end up repainting, so who knows if Nemeth isn't involving repainting or not, however he does mention the trades are upon completion of the bar(it came from an audience member's question). Lastly, the 3 time frames in ascending or descending fashion seem to be spaced out by about factors of 4 if you want to trade other time frames other than 5/15min,30min/1hour, or 4hour/daily(he mentioned the higher time frame should be atleast a dozen times higher than the lower time frame).
Personally I have not had luck getting the seventy+ percent accuracy that he talks about, whether in forex or other things. I made the default on renko bars to an ATR size 1 setting because it looks like the most universal option if the traditional mode box size is too hard to guess, and I made it so that you can switch between ATR and Traditional mode just in case. I don't think the strategy repaints because I think TV set a default on the multi-time frame aspects of their code to not re-paint, but I could be wrong so you might want to watch out for that. The zero zone recovery technique is included in the code but I commented it out and/or remove it because TV does not let you apply hedging properly, as far as I know. If you do use a proper hedging strategy with this, you'll find a very interesting bushido type of trading style involved with the Japanese bars that can boost profits and win rates of around possibly atleast seventy percent on every trade but unfortunately I was not able to test this part out properly because of the limitation on hedging here, and who knows if the hedging part isn't just a plot to sell his product. If his strategy does involve the repainting feature of the heiken ashi bars then it's possible he might have been preaching fools-gold but it's hard to say because he did mention it is upon completion of the bars. If you find out if this strategy works or doesn't work or find out a good setting that I somehow didn't catch, please feel free to let me know, will gladly appreciate it. We are all here to make some money!

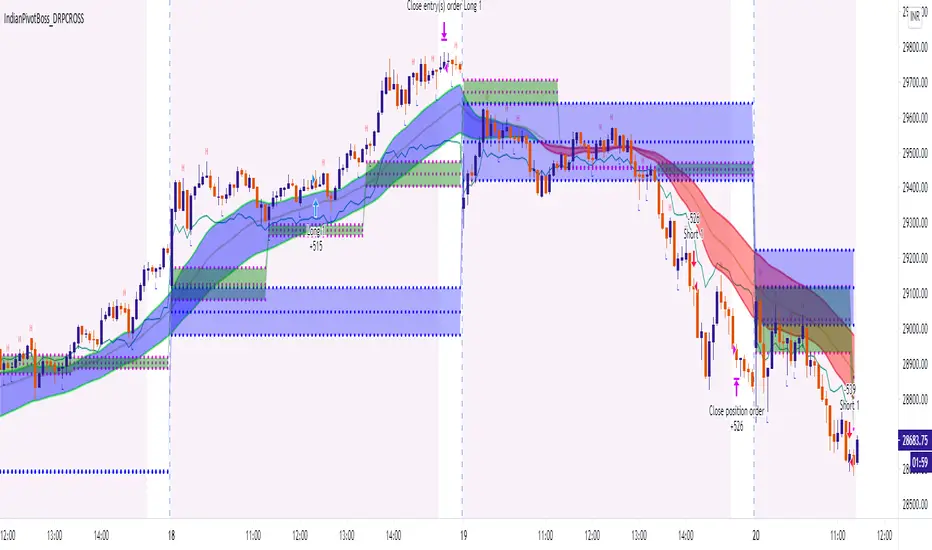
IndianPivotBoss_DRPCROSS_V2This strategy is an intraday strategy based on Developing pivot cross.
Long is generated when price crosses above developing pivot.
Short is generated when price crosses down developing pivot.
It also looks into developing pivot width for an expansion before taking into consideration of the above signals thereby providing signals only when a possibility of a trend emerges.
Pls note that past performance is not indicative of future performance.
Hence use it at your own risk. There is no guarantee for profits and there is always a possibility of losing entire capital in trading.
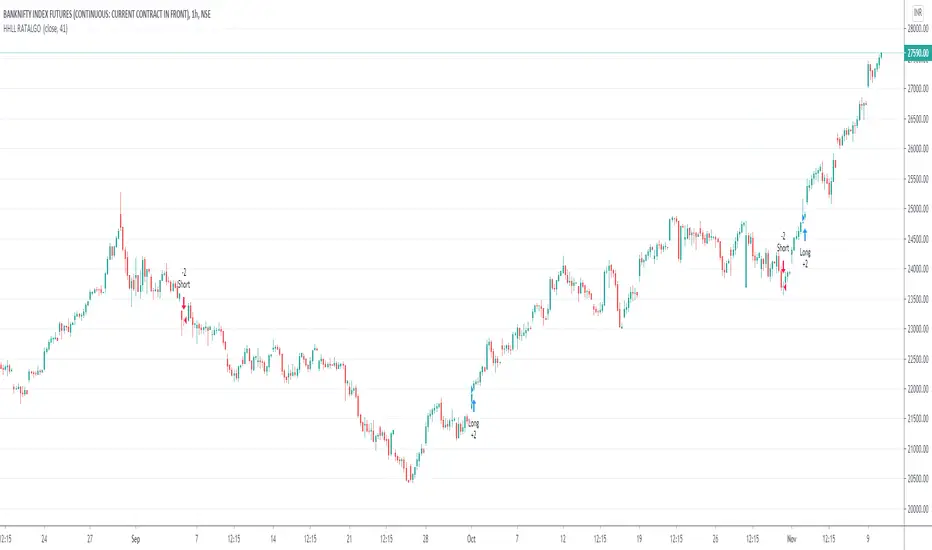
HigherHigh LowerLow RATALGOHi Traders,
This is Trend following strategy.
This strategy calculates the higher high or lower low of a look back period. If the previous high or low is breached, a signal to enter market is given.
This strategy works well with regular candles and line charts if you find the right settings and chart time frame.
Give it a try with your settings & post your feedback and suggestion if any for improvement.
I had automate this strategy with broker using Trading view Alert feature to get some live results on NSE:Banknifty1!
Pivot STRTGY_V1This Strategy operates on a Daily Time Frame and decisions are made based on monthly Pivot Points.
Choosing different time frames and pivot periods influences trading decisions and is not recommended
The script contains the following calculations:
-Pivot Points,
-Short and long term moving averages (sma, ema, getting),
-Bollinger bands,
-Trend following
The strategy aims to keep the asset profitable for as long as possible by predicting the turning points of the price.
Therefore, it is not suitable for day-trade.
Average holding period of assets is 15-20 days.
The script makes decisions to buy or sell when the price is above or below the determined averages and pivot points.
In this way, it follows the trend and aims for maximum profit.
It continuously makes calculations for the distortion conditions of the trend and generates orders to exit the position when the necessary conditions are met to stop the loss.

Backtest Custom HiLo StrategyThis script implements the HiLo trend follower strategy for backtesting the HiLo indicator. It comes with some custom options. Among them is the Type option that allows to choose between the moving averages for the highs and lows (HiLo), or highest and lowest values for those moving averages, respectively (HiLo Activator).
Swing Algo V1.2The next upgrade in the 'Swing Algo V1.x' series, and the go-to algorithm for trading ETH (until further notice). For differences to other versions, see below.
This indicator can be used for e.g. swing algorithmic trading. It will give Buy/Long and Sell/Short signals on the chart. This algorithm uses a combination of several (custom) functions and rules to find good entry points for trend trading. After many iterations and tests I came up with this particular setup, which is highly optimized for the ETH/USD trading pair on the daily (D) timeframe. Attention was also paid to stability, as all parameters are set onto plateaus, so that smaller changes in the characteristic price action should not affect the efficiancy too much. For other assets and/or timeframes it is however possible to change algorithmic parameters within the indicator settings to tune this swing algorithm. You don't need any programming skills or similar abilities to navigate this indicator.
For the here presented backtest data, we omitted the biggest portion of the cryptocurrency bullrun in 2017 (starting only at 1st July 2017) so that the results become more realistic for long-term swing traders (investing at least 2-3 years into trading) if such large runs do not happen again. As cryptocurrencies like Ethereum are still to this date capable of doing comparatively smaller runs of about 2-3x in a few weeks/months (as witnessed in 2020), the order of magnitude of the shown results is still realistic for long-term trend trading efforts. Do not expect these results in a matter of days or weeks, and of course as with any trading strategy past performances are not indicative of future results.
Within this indicator you can choose the backtest time interval to test the perfomance of this algorithm for different time windows and different trading pairs. Here various backtesting parameters (e.g. trading fees) can be customized. Default settings for the shown backtest are a starting balance of $1000, a slippage of 2 ticks (= $0.02) and a trading fee of 0.26 % (which is the worst taker fee on the Kraken exchange) to have realistic settings. However as we do not conduct many trades with this strategy, fees should not impact our performance too much. As long-term swing traders, we devote one initial portion of our portfolio to swing trading and from then on always use 100% of this portion for the next trade to get the compounding starting. This is in difference to other trading styles which use various, often very small, percentage values for their short- or mid-term trades. Keep this in mind when evaluating the backtest data. Also note that due to the small number of trades the statistical significance is low. It is not possible to gather an abundance of long-term trend signals in the order of hundreds or thousands trades, as much more time would have to pass for this in the case of rather new assets like Ethereum.
Additionally to the TradingView Strategy Tester you can also plot your equity directly on the chart to get a sense for the performance. For this you can also scale the equity graph to e.g. match the starting point of your equity with some price point on the chart to get a direct comparison to 'Buy & Hold' strategies over time.
This indicator (and all other content I provide) is no financial advice. If you use this indicator you agree to my Terms and Conditions which can be found on my Twitter profile linked on my TradingView profile or in my signature.
Differences to other versions:
- Changed from a dual (V1, V1.1) to a single smoothing function system (V1.2, V1.3), which can react better to more sudden price movements that got prevalent during the current end-phase of the stock bullmarket due to correlations, while still handling 'normal' price action well
- Changed the oscillator part of the algorithm with a better suited one (at least) for the ETH/USD trading pair, handling chop better.
- Improved net profits by potentially +100% in comparison to V1 for ETH/USD on daily timeframe
- However for other assets (e.g. BTC and smaller coins like XTZ and ALGO) and timeframes V1 might perform better than V1.2 due to somewhat different characteristic price action. I leave you with all options to play so that you can find the best solution for a given trading pair.
- There's also an upgrade called Swing Algo V1.3, which works similar to V1.2, but reduces losses due to chop even further. Because V1.2 is a bit more flexible, it is, however, considered the go-to algo for the time being.
For access please contact me via DM on TradingView or on Twitter (linked on my TradingView profile and my signature). People who purchased access to any 'Swing Algo 1.x' get access to all other 'Swing Algo V1.x' indicators automatically ('Swing Algo V1' counts as 'Swing Algo V1.0').

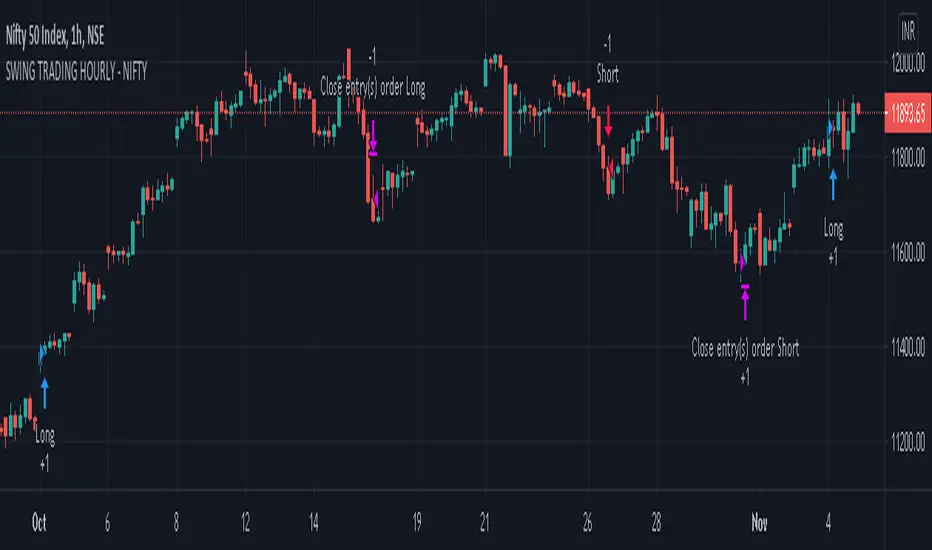
SWING TRADING HOURLY - NIFTYSWING TRADING STARTEGY - NIFTY
TIME FRAME - 1 Hour
INSTRUMENT - NIFTY
STARTEGY LOGIC - Startegy involves 4 components to initiate a trade.
1). Simple moving average cross for trend confirmation.
2). ADX (higher time frame) for trend confirmation.
3). RSI for momentum confirmation.
4). Price Action confirmation in form of range breakout to TRIGGER a trade. Range breaakout is inspired from Donchain Channels
EXIT LOGIC - Close above / below the SMA (simple moving average) in oppoite direction.
TRADE TYPE - Swing Trading
HOLDING PERIOD - As long as Trend remains and till EXIT signal appears.
TRADE METHOD -----
METHOD 1 -
BUY / SHORT NIFTY Futures as per the trend direction.
METHOD 2 -
OPTION SELLING. At The Money (ATM) Weekly Options can be sold to gain premium decay (theta decay). This process can be continued to sell ATM option every week till the trade signal is active.
NOTE 1 - Option Selling can be more profitable in weekly option selling but also carries risk. One must have deep knowledge about risks related to Option Selling.
NOTE 2 - Please analyse the trade signals from this startegy for some period to gain confidence before starting to trade.
NOTE 3 - Trading is a serious business and one must consult a financial advisor before taking a trade. Profits / Loss from this script (strategy) is completely individual user's responsibility.
Aditya Banknifty-2 IndicatorThis indicator is designed for Banknifty which is traded on NSE(India). It works best in 1-M and 5-M time-frame. You can always experiment with any other time-frame with various combinations of settings.
Green Line- Buy Trigger Line
Red Line- Sell Trigger Line
Period: No. bars for look-back period.
Trade Trigger Type:
1. ATR Based – Trade will be initiated based on ATR values.
For 1M time-frame: Trigger ATR Bars=7
ATR Multiplier = 3.1
For 5M time-frame: Trigger ATR Bars=7
ATR Multiplier = 0.5
2. Fixed - – Trade will be initiated based on particular fixed value.
3. % of Close - Trade will be initiated based on % of Close of script.
Take Partial Profit: Whether to book partial or not.
Partial Profit Points: It always better to book partial profit after getting into the trade. We can book 1 quantity after our partial profit target is hit by making Order Size=2 and let the remaining quantity in the trade until the reversal of trend.
Disclaimer: This script/strategy is for educational purpose and individual use only. The author of this script/strategy will not accept any liability for loss or damage as a result of reliance on the information contained in the charts. Please be fully informed regarding the risks and costs associated with trading the financial markets.
This is a premium indicator so send me a private message for access.
Use the link below to obtain access to this indicator.

[NLX-L3] Backtest- Introduction -
This backtest module is part of my new modular trading framework - however it can be used with any indicator that has a signal plot output (1 = long / -1 = short)
I chose to release this one first, I've got all the modules for the framework ready and they going to be released in the coming days. Got to start somewhere... ;)
This trading framework is the result of many years experience building indicators and trading strategies.
I couldn’t find a trading framework in Pine Script that would suit my needs and so I started to design my own from scratch. I’m trading with this framework myself so I’ve made sure that it’s flexible and absolutely reliable in a live-trading environment.
- Architecture -
What makes this framework so flexible is the modular architecture, different layers that all serve a very specific purpose.
You will notice that the module names include either L1 - L2 or L3:
- Layer 1 (L1) is the base layer and the foundation. L1 indicators are used to determine the trend, volume profile and filter noise. You would use L1 to see if it’s a good time to trade, what is the direction - or if it's better to trade at all in unfavourable conditions
- Layer 2 (L2) receives the result of L1 and if the market conditions are good the L2 indicator looks for an optimal entry point to go long or short. It is possible to combine several L2 indicators and trigger a long/short signal only if all L2 indicators agree.
- Layer 3 (L3) receives the final signal from L2 and it’s where we can now backtest the result of our trading strategy and trigger trade alerts with help of the alert module.
- Features -
External Input Source (any indicator with signal plot can be used)
Safe Entries Option: Enter a trade only if the position is profitable ad the momentum allows
Pyramid Entries
Partial Take-Profit: %-Step Interval and Quantity per Step
Stop Methods: Trailing Stop, TP/SL with ATR Option, several type of stop bands...
Profit/Loss Label with Fee, Slippage and Leverage Calculation
- Upcoming Modules -
I'll release a couple of great indicators and filter in the coming days...
Trend Score (includes 10 different Trend and Filter algorithms)
Breakouts & Pullbacks
QQE++
True Range Filter
Support / Resistance
Consolidation Range Breakouts
- Alerts & Trading Automation -
Will be released shortly. Check my signature below.

Turtle Trend Trading System [racer8]This is the Turtle traders' actual system which uses a 55 period channel for entries & a 20 period channel for exits. Enjoy ;)

Intraday StrategyThis script helps you to determine entry for long trades and short trades.
Conditions checked:-
1. VWAP for long/short
2. 20 EMA for confirmation
3. STOCHASTIC RSI for momentum
How to enter:-
After the indicator plots the entry for long/short on chart, wait for the price to break nearest pivot point and close above it. Combine with price action for better results.
when long signal is plotted, wait for the nearest resistance to be broken, while entering make sure that the price has not been in a continues uptrend or downtrend.
Time Frame:-
5 & 15 minutes timeframe
When to exit:-
Exit the position after 1% raise of price. eg:- if stock price is 1000, exit after 10 points. you can trail SL if you see a long trend comming
Where to place SL :-
Place your SL 0.5%-1% from you entry or determine the nearest support.
KDS_mzKaufdrucksystem (buying pressure system) after F.Held, coded by O.P and M.Z.
A combination of 5 adjusted conventional indicators and corresponding treshholds to generate a trend ranking between 0 and 5.
At crossover/under of KDS with buy/sell_border (2.5) a BUY and SELL signal is generated, respectivley.
Tested on indizes, ETFs and stocks for time frames from hours to weeks.
KDS 2.5 outperformed standard MACD and RSI approaches for stocks like TSLA, BOEING,WIRECARD.
KDS 0.5 outperformed standard approaches for SP500 and Nasdaq.
Backtesting was performed with 10% of equity of a 100000 $ depot ( slipage 1 Tick, 0.1% commision) on Lyxor DAX ETF from 2000 to September 2020.

Wavetrend strategy with trading session for any time chartHello there
Today I am glad to provide you a strategy based on the wave trend oscillator. If you want to use it as an indicator, just disable long and short to not make any shops.
It works on all time frames.
The way it works its like an RSI .
We have overbought and oversold levels, and together with a channel and length we calculate the wave trend.
And then like in RSI, when we cross those lines we buy or sell depending on which lines we cross.
For risk management, so far its not implemented, but it can be done in many ways.
The only thing I applied is to always close a trade at the end of friday day. At the same time it can be applied the rule to sell when % of equity is lost, or at the end of a trading session like london,neywork and so on.
For any questions or doubts, let me know.
Hope you enjoy it :)

Scalper v1A trend following strategy which uses regression to estimate buying and selling, the regression is done using oscillators and filters. This strategy can be used to scalp if you can wait till the candle is fully painted and you have a good sense of market.
Trade at your own risk no one can guarantee a 100% strike rate!
