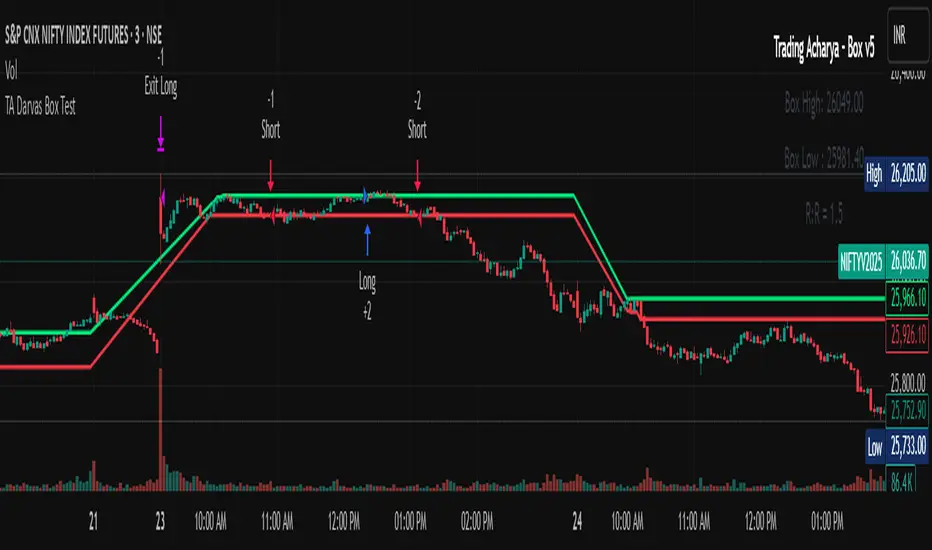
TA Darvas Box Test🎯 Core Logic
1-Darvas Box Breakouts/Breakdowns → Entry when price crosses above the Top Box (long) or below the Bottom Box (short).
2-Trend Filter (MavilimW) → Longs only when price is above MAVW, shorts only when below.
3-Momentum Confirmations → ATR spike and Volume spike must confirm breakout strength.
🛠 Position Sizing (MaTriangle – Martingale by Qty)
1-Starts with Base Qty.
2-On losing trades → step-up size using Qty Multiplier, capped by Max Steps & Max Qty Cap.
3-On winning trades → optional reset back to Base Qty.
⚠️ Martingale sizing can increase drawdowns — use carefully.
⏱ Trade Gating
1-Backtest Window: Only trades between selected From – To dates.
2-Trade Cap: Limit trades Per Day / Per Week / Per Month (auto reset).
3-One Position at a Time (pyramiding = 0).
📉 Exit Rules
1-Protective Stops:
2-Long → Stop at Bottom Box.
3-Short → Stop at Top Box.
Profit Safeguard: If in profit, exit when RVI crosses against trade.
1-No fixed TP → trades ride until Box stop or RVI exit.
🔔 Alerts (Options Workflow)
1-Static Alerts: Fire on confirmed long/short signals (compile-safe).
2-Dynamic Alerts: Send ATM strike info, Qty, and Martingale step.
3-Auto ATM Mapping: BANKNIFTY, NIFTY, FINNIFTY, MIDCPNIFTY detected automatically; fallback to manual step.
⚙️ Suggested Defaults
Darvas Box Length = 5
ATR Len = 14, ATR SMA = 14, Mult = 1.0–1.5
Volume SMA = 20, Mult = 1.5–2.0
Base Qty = 1, Mult = 2.0, Max Steps = 3
Trade Cap = Per Day, 10–30 trades
✅ Works on any symbol/timeframe.
⚠️ High-risk position sizing (Martingale). Backtest thoroughly and use with caution.
Поиск скриптов по запросу "volume"
Structure Strategycreated to spot key area needed to take valid trades in most market conditions. use beside RSI MACD

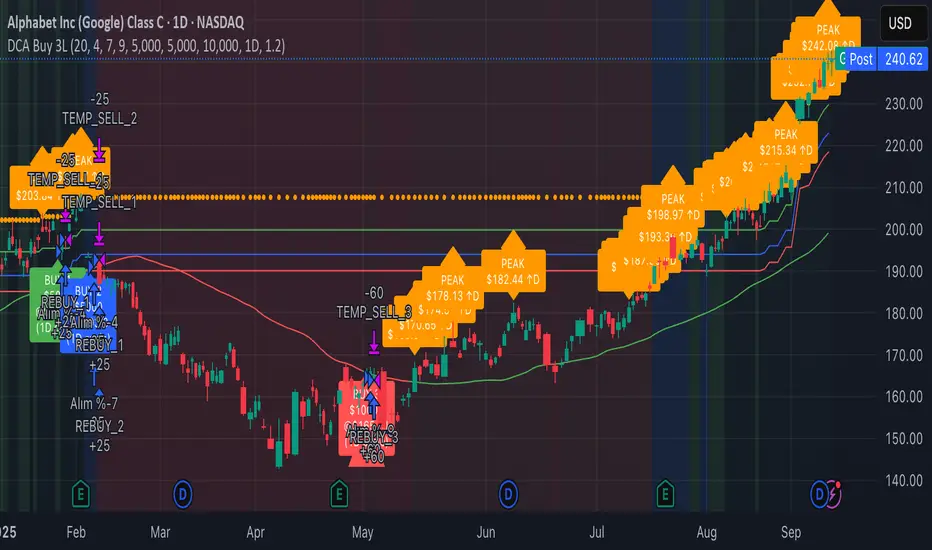
3-Level DCA Buy Strategy🎯 3-Level DCA Buy Strategy - Smart Dollar Cost Averaging
Professional DCA strategy that systematically accumulates positions during market dips. Enhanced with daily trend analysis for intelligent accumulation.
🚀 Key Features
- 3-Level Buying System: Automatic purchases at 5%, 10%, 15% drops from cycle highs
- Daily Trend Analysis: 1-day timeframe trend confirmation
- Smart Peak Detection: 100-period lookback for meaningful peaks
- Volume Filter: Optional volume confirmation system
- USD-Based Positions: Fixed dollar amounts per level
- Never Sells: Pure accumulation philosophy (buy-only)
📊 How It Works
1. Peak Identification: Detects highest price in last 100 periods
2. Daily Trend Check: Confirms price above 50 SMA on 1D timeframe
3. Drop Tracking: Calculates percentage drops from cycle high
4. Systematic Buying: Executes predetermined amounts at each level
5. Cycle Reset: Renews buy permissions when new peaks form
⚙️ Default Settings
- Buy Levels: 5%, 10%, 15% drops
- Position Sizes: $100, $150, $200
- Peak Period: 100 bars
- Higher Timeframe: 1 Day (1D)
- Pyramiding: 500 order capacity
🎨 Visual Elements
- Orange Circles: Mark cycle highs
- Colored Lines: Green/Blue/Red buy levels
- Triangle Signals: Buy point indicators
- Live Panel: Real-time statistics
- Background Colors: Trend and drop level indicators
🔔 Alert System
- Instant notifications for each buy level
- New peak detection alerts
- Major drop warnings (>20%)
- Daily trend change notifications
💡 Ideal Use Cases
- Crypto Accumulation: Bitcoin, Ethereum and major altcoins
- Stock DCA: Long-term portfolio building
- Volatile Markets: Capitalizing on price fluctuations
- Emotional Trading Prevention: Automated and disciplined buying
📈 Strategy Logic
This strategy follows the "buy the dip" philosophy. It waits during market rises and systematically builds positions during declines. Only buys when daily trend is bullish, providing protection during major bear markets.
⚠️ Important Notes
- Buy-only strategy - never sells positions
- Requires sufficient capital for multiple entries
- Most effective in trending and volatile markets
- Always backtest before live trading
- Risk management is your responsibility
🛠️ Customization Options
All parameters are fully customizable: drop percentages, position amounts, timeframes, visual elements and more. Suitable for both beginner and experienced investors.
🎯 Publishing Feature
Note: Strategy includes temporary 1-day sell cycle for TradingView publishing requirements. This feature can be disabled for normal DCA mode operation.
⭐ If you find this strategy helpful, please like and follow! Visit the profile for more trading tools.
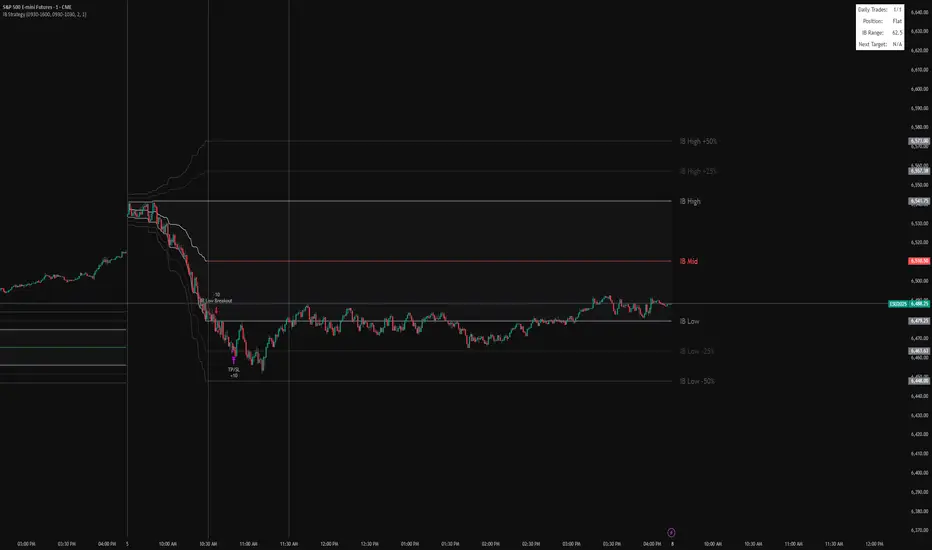
IB BreakoutIt marks the IB range (high, low, midpoint) from a chosen session window (default 9:30–10:30).
It plots the IB lines, midpoint (colored based on close), and extension levels (+/–25% and 50%).
After the IB session ends, it looks for breakouts:
Long if price closes above IB high.
Short if price closes below IB low.
Each trade targets the 25% extension in the breakout direction, with an optional stop at the opposite IB level.
It limits the number of trades per day and displays info (trades, position, IB range, next target) in a table.
MS - Crypto RSI-Based Trading StrategyThis is a comprehensive trend-following and momentum-based strategy designed for the cryptocurrency market. It combines multiple leading indicators to filter out market noise and generate high-quality buy and sell signals.
Key Indicators:
Moving Average (MA): To determine the main trend direction.
Relative Strength Index (RSI): To measure momentum and identify overbought/oversold conditions.
Directional Movement Index (DMI): To confirm the strength of the trend.
Volume & ATR: To validate market interest and filter out excessive volatility.
Buy Conditions (All Must Be True):
Price and Trend Alignment: The current price is above the MA50 (with a 5% buffer).
Momentum Confirmation: The RSI is between 50 and 70.
Trend Strength: The +DI is greater than the -DI.
Market Interest: Volume is 1.5 times its moving average.
Low Volatility: The ATR is below its average.
Sell Conditions (Any One Is True):
Trend Reversal: The price drops below the MA50 (with a 5% buffer).
Momentum Loss: The RSI drops below 45.
Trend Weakness: The -DI crosses above the +DI.
Market Fatigue: Volume drops below 50% of its moving average.
High Volatility: The ATR is above its average.
Disclaimer: This is a backtesting tool and not financial advice. Past performance is not an indicator of future results. Always use proper risk management and conduct your own research before trading.

Hilly's Advanced Crypto Scalping Strategy - 5 Min ChartTo determine the "best" input parameters for the Advanced Crypto Scalping Strategy on a 5-minute chart, we need to consider the goals of optimizing for profitability, minimizing false signals, and adapting to the volatile nature of cryptocurrencies. The default parameters in the script are a starting point, but the optimal values depend on the specific cryptocurrency pair, market conditions, and your risk tolerance. Below, I'll provide recommended input values based on common practices in crypto scalping, along with reasoning for each parameter. I’ll also suggest how to fine-tune them using TradingView’s backtesting and optimization tools.
Recommended Input Parameters
These values are tailored for a 5-minute chart for liquid cryptocurrencies like BTC/USD or ETH/USD on exchanges like Binance or Coinbase. They aim to balance signal frequency and accuracy for day trading.
Fast EMA Length (emaFastLen): 9
Reasoning: A 9-period EMA is commonly used in scalping to capture short-term price movements while remaining sensitive to recent price action. It reacts faster than the default 10, aligning with the 5-minute timeframe.
Slow EMA Length (emaSlowLen): 21
Reasoning: A 21-period EMA provides a good balance for identifying the broader trend on a 5-minute chart. It’s slightly longer than the default 20 to reduce noise while confirming the trend direction.
RSI Length (rsiLen): 14
Reasoning: The default 14-period RSI is a standard choice for momentum analysis. It works well for detecting overbought/oversold conditions without being too sensitive on short timeframes.
RSI Overbought (rsiOverbought): 75
Reasoning: Raising the overbought threshold to 75 (from 70) reduces false sell signals in strong bullish trends, which are common in crypto markets.
RSI Oversold (rsiOversold): 25
Reasoning: Lowering the oversold threshold to 25 (from 30) filters out weaker buy signals, ensuring entries occur during stronger reversals.
MACD Fast Length (macdFast): 12
Reasoning: The default 12-period fast EMA for MACD is effective for capturing short-term momentum shifts in crypto, aligning with scalping goals.
MACD Slow Length (macdSlow): 26
Reasoning: The default 26-period slow EMA is a standard setting that works well for confirming momentum trends without lagging too much.
MACD Signal Smoothing (macdSignal): 9
Reasoning: The default 9-period signal line is widely used and provides a good balance for smoothing MACD crossovers on a 5-minute chart.
Bollinger Bands Length (bbLen): 20
Reasoning: The default 20-period Bollinger Bands are effective for identifying volatility breakouts, which are key for scalping in crypto markets.
Bollinger Bands Multiplier (bbMult): 2.0
Reasoning: A 2.0 multiplier is standard and captures most price action within the bands. Increasing it to 2.5 could reduce signals but improve accuracy in highly volatile markets.
Stop Loss % (slPerc): 0.8%
Reasoning: A tighter stop loss of 0.8% (from 1.0%) suits the high volatility of crypto, helping to limit losses on false breakouts while keeping risk manageable.
Take Profit % (tpPerc): 1.5%
Reasoning: A 1.5% take-profit target (from 2.0%) aligns with scalping’s goal of capturing small, frequent gains. Crypto markets often see quick reversals, so a smaller target increases the likelihood of hitting profits.
Use Candlestick Patterns (useCandlePatterns): True
Reasoning: Enabling candlestick patterns (e.g., engulfing, hammer) adds confirmation to signals, reducing false entries in choppy markets.
Use Volume Filter (useVolumeFilter): True
Reasoning: The volume filter ensures signals occur during high-volume breakouts, which are more likely to sustain in crypto markets.
Signal Arrow Size (signalSize): 2.0
Reasoning: Increasing the arrow size to 2.0 (from 1.5) makes buy/sell signals more visible on the chart, especially on smaller screens or volatile price action.
Background Highlight Transparency (bgTransparency): 85
Reasoning: A slightly higher transparency (85 from 80) keeps the background highlights subtle but visible, avoiding chart clutter.
How to Apply These Parameters
Copy the Script: Use the Pine Script provided in the previous response.
Paste in TradingView: Open TradingView, go to the Pine Editor, paste the code, and click "Add to Chart."
Set Parameters: In the strategy settings, manually input the recommended values above or adjust them via the input fields.
Test on a 5-Minute Chart: Apply the strategy to a liquid crypto pair (e.g., BTC/USDT, ETH/USDT) on a 5-minute chart.
Fine-Tuning for Optimal Performance
To find the absolute best parameters for your specific trading pair and market conditions, use TradingView’s Strategy Tester and optimization features:
Backtesting:
Run the strategy on historical data for your chosen pair (e.g., BTC/USDT on Binance).
Check metrics like Net Profit, Profit Factor, Win Rate, and Max Drawdown in the Strategy Tester.
Focus on a sample period of at least 1–3 months to capture various market conditions (bull, bear, sideways).
Parameter Optimization:
In the Strategy Tester, click the settings gear next to the strategy name.
Enable optimization for key inputs like emaFastLen (test range: 7–12), emaSlowLen (15–25), slPerc (0.5–1.5), and tpPerc (1.0–3.0).
Run the optimization to find the combination with the highest net profit or best Sharpe ratio, but avoid over-optimization (curve-fitting) by testing on out-of-sample data.
Market-Specific Adjustments:
Volatile Pairs (e.g., DOGE/USDT): Use tighter stop losses (e.g., 0.5–0.7%) and smaller take-profit targets (e.g., 1.0–1.2%) to account for rapid price swings.
Stable Pairs (e.g., BTC/USDT): Slightly wider stop losses (e.g., 1.0–1.2%) and take-profit targets (e.g., 1.8–2.5%) may work better.
Trending Markets: Increase emaSlowLen (e.g., to 25–30) to follow stronger trends.
Choppy Markets: Tighten bbMult (e.g., to 1.8) and lower rsiOverbought/rsiOversold (e.g., to 70/30) to filter noise.
Forward Testing:
After backtesting, run the strategy in real-time on a demo account for 1–2 weeks to validate performance under current market conditions.
Important Notes
No Universal "Best" Numbers: Optimal parameters vary by crypto pair, exchange, and market conditions (e.g., bull vs. bear market). The suggested values are a starting point based on common scalping practices.
Risk Management: Never risk more than 1–2% of your account per trade. Adjust position sizing in TradingView’s strategy settings to align with your risk tolerance.
Market Volatility: Crypto markets are highly volatile. Test the strategy on your specific pair and adjust parameters if signals are too frequent or too rare.
Not Financial Advice: This is an educational tool. Backtest thoroughly and use a demo account before trading with real funds.
If you want me to generate a chart showing backtest performance for specific parameters or to tweak the script further (e.g., adding more indicators or adjusting signal logic), let me know!can you add clear buy ans sell signs above the candles in this codeTo add clear buy and sell signals above the candles in the provided Pine Script, I'll modify the existing code to include prominent text labels directly above (for sell signals) and below (for buy signals) the candles. These labels will be larger, color-coded, and positioned to avoid clutter, ensuring they are easily visible on the chart. The core strategy logic (EMA, RSI, MACD, Bollinger Bands, candlestick patterns, and volume filter) will remain unchanged, and I'll reuse the same artifact_id since this is an update to the previous script.AdvancedCryptoScalpingStrategy.pinex-pine

AlphaFlow — Direcional Pro [Strategy] — Risk % & Dynamic EquityAlphaFlow is a directional strategy designed to capture trend shifts using a dual moving average system, enhanced with RSI and ATR regime filters, and a long-term EMA filter for confirmation.
Key Features
Dynamic Position Sizing: Risk per trade is based on a fixed % of account equity, with optional dynamic equity growth.
Stop-Loss Options: Choose between ATR-based stop or swing-point stop.
Trade Management:
TP1 is placed at a user-defined risk multiple (R).
Once TP1 is hit, an optional ATR trailing stop activates until TP2 is reached or the stop is triggered.
Visual Tools: Fast/slow EMAs, long EMA, ATR channels, and optional divergence markers for context (do not affect entries).
Backtest Ready: Includes configurable commission, capital, and position sizing.
Use Case
This strategy is built for traders who want systematic trend-following entries with structured risk management. Its modular inputs allow adaptation across assets and timeframes.
⚠️ Disclaimer: Past performance does not guarantee future results. Always validate parameters before live use.

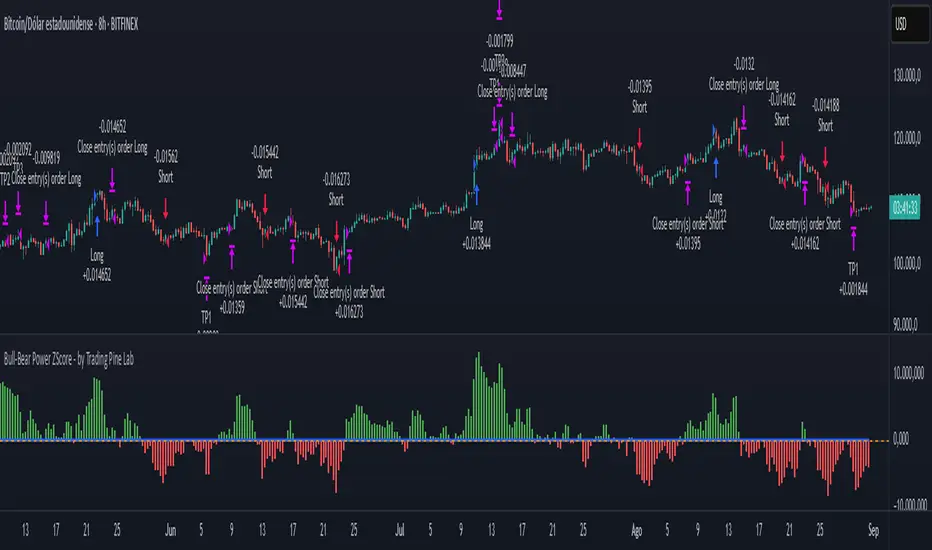
Bull-Bear Power ZScore - by Trading Pine Lab🇬🇧
The Bull-Bear Power ZScore Strategy is an advanced trading framework that integrates Bull-Bear Power (BBP) with a statistical Z-Score model.
BBP measures the relative strength of buyers vs. sellers against an EMA baseline, while the Z-Score standardizes this relationship to detect statistically significant breakouts.
This dual-layer approach provides early trend detection while reducing noise from raw momentum signals.
Entries are triggered when the Z-Score crosses above or below its threshold (long above +T, short below –T). Exits occur when the Z-Score crosses back to zero, ensuring trades close when momentum fades.
A dynamic multi-level take-profit system is integrated, using ATR-based targets (TP1, TP2, TP3) that automatically adapt to **volume context** (high/medium/low) and **percentile analysis** (distribution of price and volume).
This ensures profit targets stretch in strong environments and tighten in weaker conditions, optimizing both risk and reward.
All parameters are fully configurable:
-Bull-Bear Power Settings: EMA length, Z-Score length, Z-Score threshold.
-Take Profit Settings: enable/disable TP system, ATR period, TP1–TP3 multipliers, TP1–TP3 position sizes.
-Volume Analysis: volume MA period, high/medium/low multipliers, adjustment factors.
-Percentile Analysis: percentile lookback period, high/medium/low thresholds, adjustment factors.
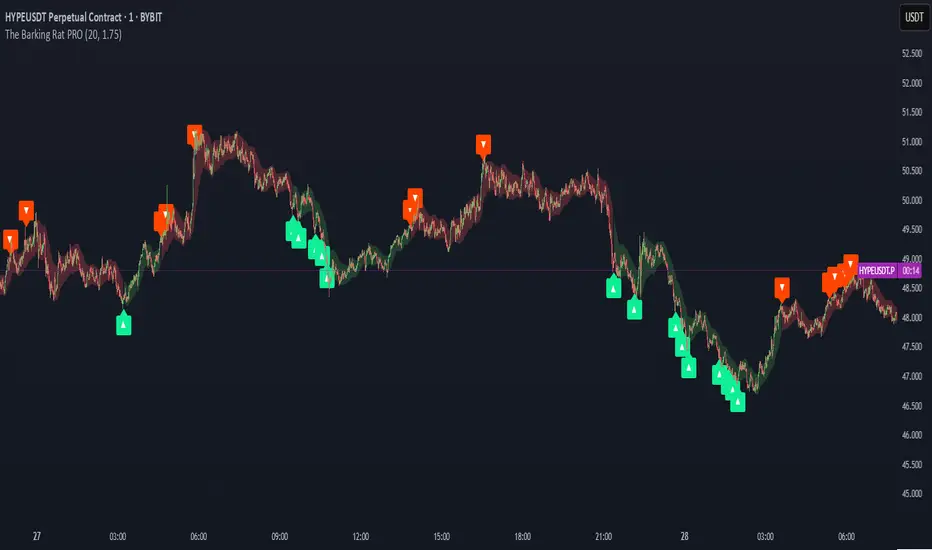
The Barking Rat PROThe Barking Rat PRO is designed around high/low pivot structure to capture meaningful market reversals. It intelligently identifies turning points by combining higher high/lower low (HH/LL) pivot detection, Fair Value Gap (FVG) confirmation, volatility-aware filters, and momentum checks. Unique features, such as a one-bar flip handler and a contextual ribbon overlay, provide traders with both clarity and precision. These tools help isolate high-probability setups while filtering out low-conviction signals, making trade opportunities easier to spot and act upon.
🧠 Core Logic: Structure-First, Filtered Reversals
The strategy takes a methodical, disciplined approach, prioritizing structural pivots over random signals. By layering multiple validation checks—structural pivots, gap confirmation, volatility filters, and momentum alignment—it highlights trades with high conviction while reducing exposure to noisy market conditions. The result is a clear, repeatable framework for reversal trading that can be applied across timeframes.
HH/LL Pivot Framework
Trades are triggered based on simple structural pivots: higher highs (HH) and lower lows (LL). When a structure flip occurs, the strategy either opens a new position or executes a one-bar delayed flip if an opposing position already exists. This ensures smooth transitions and avoids premature entries on minor market swings, keeping trading decisions focused on meaningful trend shifts.
Volatility & Distance Filters
To avoid low-quality trades, entries are validated against relative volatility, ensuring that pivots represent significant market movement. Trades must also be sufficiently spaced from previous entries and separated by a minimum number of bars, which prevents overtrading and clustered signals that can dilute performance.
Momentum Filter (RSI)
The strategy optionally aligns entries with momentum conditions using RSI. Long trades are favored when RSI is relatively low, suggesting potential exhaustion on the downside, while short trades are favored when RSI is relatively high, indicating potential overextension on the upside. This additional layer improves timing, helping traders avoid entering against strong, ongoing momentum.
Background Ribbon (Contextual Visuals)
A translucent ribbon overlays the chart to provide visual context of active trades. The ribbon displays volatility envelopes and position direction: green for long trades, red for short trades. It enhances clarity by giving traders a quick visual reference of the market environment without cluttering the chart.
Why These Parameters Were Chosen
The strategy focuses only on structurally meaningful pivots to ensure high-conviction trades.
Volatility filters confirm that trade signals are significant relative to recent price action, while FVG confirmation captures institutional-style imbalances.
Momentum and spacing rules prevent low-quality entries and overtrading, while the one-bar flip handler ensures seamless transitions when the structure reverses.
Ribbon overlays provide intuitive, real-time visualization of active trades and market context.
📈 Chart Visuals: Clear & Intuitive
- Green “▲” below a candle: Long entry triggered on LL → HH structure flip
- Red “▼” above a candle: Short entry triggered on HH → LL structure flip
- Translucent Ribbon: Green when long, Red when short
🔔 Alerts: Stay Notified Without Watching
The strategy supports real-time alerts on candle close, ensuring that only fully confirmed signals trigger notifications.
You must manually configure alerts within your TradingView account. Once set up, a single alert per instrument covers all relevant entries and exits, making hands-free monitoring simple and efficient.
⚙️ Strategy Report Properties
Position size: 25% of equity per trade
Initial capital: 10,000.00 USDT
Pyramiding: 25 entries per direction
Slippage: 2 ticks
Commission: 0.055% per side
Backtest timeframe: 1-minute
Backtest instrument: HYPEUSDT
Backtesting range: Aug 11, 2025 — Aug 28, 2025
💡Why 25% Equity Per Trade?
While it's always best to size positions based on personal risk tolerance, we defaulted to 25% equity per trade in the backtesting data — and here’s why:
Backtests using this sizing show manageable drawdowns even under volatile periods
The strategy generates a sizeable number of trades, reducing reliance on a single outcome
Combined with conservative filters, the 25% setting offers a balance between aggression and control
Users are strongly encouraged to customize this to suit their risk profile.
🔍 What Makes This Strategy Unique?
HH/LL Pivot Focus: Trades pivot structure flips instead of relying on generic indicators.
Fair Value Gap Confirmation: Only pivots supported by FVGs are acted upon, reducing noise.
One-Bar Flip Handler: Ensures clean transitions when the structure reverses, avoiding same-bar conflicts.
Volatility & Spacing Filters: Trades require sufficient movement from prior entries and minimum bar spacing to maintain quality.
Momentum-Aware Entries: RSI alignment favors entries near potential exhaustion points, improving signal reliability.
Contextual Ribbon Overlay: Visualizes volatility and active positions clearly, without cluttering the chart.
ETH/BTC/XRP Strategy - Powered by BCHETH/BTC/XRP Strategy — Cross-Asset Momentum-Based Strategy
Overview
This strategy aims to identify medium-term long trade opportunities on ETH/BTC/XRP 2 or 4 hour charts by leveraging cross-asset momentum signals from Bitcoin Cash (BCH) relative to Ethereum (ETH). It integrates volatility filters, volume validation, and momentum confirmations to improve trade timing and risk management.
Key Features and Logic
Cross-Asset Momentum Filter: Enters long trades when BCH outperforms ETH in the prior candle, supporting relative strength confirmation.
Volume Confirmation: BCH volume must exceed 135% of its 20-period average, validating market interest before entry signals.
Volatility Filter: ETH price near or below 110% of the lower Bollinger Band (20 periods, 2σ) indicates oversold conditions.
Momentum Indicators: ETH RSI below 70 ensures the asset is not overbought, coupled with BCH MACD line crossing above its signal line for bullish bias.
Risk Controls: Includes trailing stop losses and take profit targets to protect gains and limit drawdowns.
Timing Constraints: Controlled cooldown periods between trades help prevent overtrading and false signals.
Usage Recommendations
Optimized for 2 or 4hour ETH/BTC/XRP USDT candles; 5-minute data optionally used for finer entries and exits.
Suitable for traders seeking dynamic timing based on multi-asset interactions rather than blind holding.
Works as a complement within diversified or rotational strategies focusing on Ethereum exposure.
Performance Summary (Backtest Jan 2023 – Jul 2025) ; ETHUSDT 2hour basis.
Total trades: 65
Win rate: 61.5%
Profit factor: 5.1
Note: The sample size is limited; results should be interpreted with caution. Past performance is not indicative of future results.
Important Notes
This script represents an original combination of cross-asset momentum with volatility and volume filters tailored to ETH and BCH interaction.
Source code is protected to safeguard unique implementation details while allowing free usage without restrictions.
Use appropriate risk management, and consider these signals as part of a broader trading analysis.
No guarantees on profitability; trading involves significant risk.

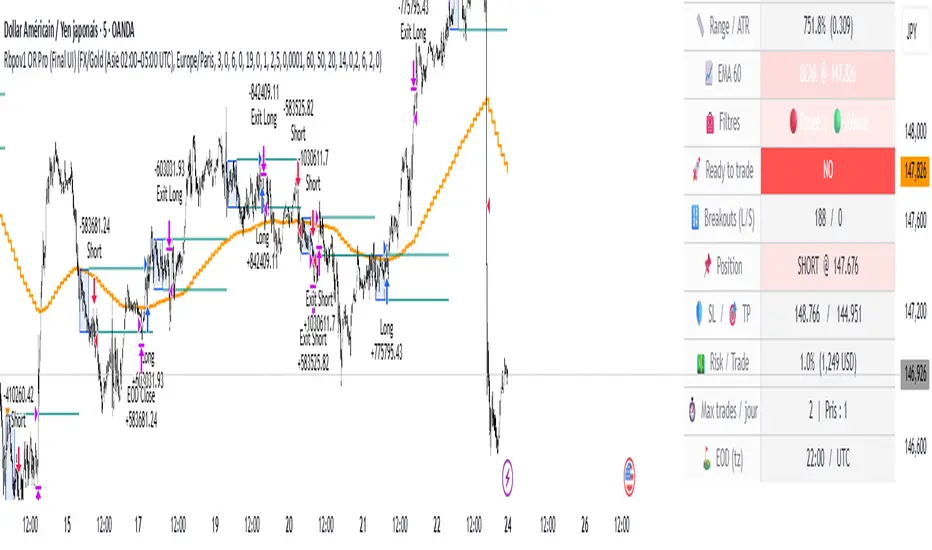
Rbpov1 – Opening Range Multi-Actifs Final📌 Strategy Bio – Rbpov1 Opening Range Pro
🎯 Core Concept
The Rbpov1 Opening Range Pro is an advanced algorithmic trading system built around the opening range breakout concept.
It is based on the observation that, after a period of consolidation (the opening range), markets often generate strong directional moves once the range is broken.
This strategy is designed to be multi-asset (Forex, indices, commodities, crypto) and multi-timeframe, with the following key principles:
A reference range (default: 03:00 → 06:00 UTC+2, customizable).
Trade entries are taken only after the range closes.
Smart filtering (trend, volatility, volume) to reduce false signals.
Strict risk management in USD, with Stop Loss and Take Profit defined in multiples of R.
Automatic end-of-day flat rule: all positions are closed by session end.
⚙️ Filters & Conditions
🔹 1. Trend Filter (EMA HTF)
A 21-period EMA is applied to a higher timeframe (default: H4).
If price is above EMA, only longs are allowed.
If price is below EMA, only shorts are allowed.
👉 This aligns intraday trades with the dominant trend.
🔹 2. Volatility Filter (ATR)
Uses a 14-period ATR to validate range conditions.
Opening range is valid only if:
Range > minATR × ATR
Range < maxATR × ATR
Default: minATR = 0.2, maxATR = 6.0.
👉 Filters out noise (tiny ranges) or overextended volatility.
🔹 3. Volume Filter (Optional)
Breakout candle must show higher volume than the average (default SMA 20).
Prevents low-liquidity breakouts.
🔹 4. Session & Trading Rules
No trades during weekends (Forex).
Maximum X trades per day (default: 2).
Positions are force-closed at EOD (default: 19:00 UTC+2).
💰 Risk Management
Dynamic position sizing in USD (capital × risk%).
Stop Loss automatically set at the opposite side of the range (with optional buffer).
Take Profit in multiples of R (default: 1.5R).
Equity-based recalculation ensures consistency as account grows.
📊 Key Benefits
✅ Professional and modular architecture.
✅ Works across Forex, indices, gold, and crypto.
✅ Smart filtering for cleaner signals.
✅ Robust and consistent risk management.
✅ Automatic end-of-day flattening (no overnight risk).
✅ Modern and visual dashboard interface for readability.
🏆 Use Cases
Forex (USD/JPY, EUR/USD, GBP/USD) → Asian session ranges.
Indices (NAS100, US30, DAX) → NYSE opening ranges.
Gold (XAU/USD) → Tokyo or pre-London ranges.
Crypto (BTC, ETH) → Tailored to volatility peaks.
Imbalance RSI Divergence Strategy# Imbalance RSI Divergence Strategy - User Guide
## What is This Strategy?
This strategy identifies **imbalance** zones in the market and combines them with **RSI divergence** to generate trading signals. It aims to capitalize on price gaps left by institutional investors and large volume movements.
### Main Settings
- **RSI Period (14)**: Period used for RSI calculation. Lower values = more sensitive, higher values = more stable signals.
- **ATR Period (10)**: Period for volatility measurement using Average True Range.
- **ATR Stop Loss Multiplier (2.0)**: How many ATR units to use for stop loss calculation.
- **Risk:Reward Ratio (4.0)**: Risk-reward ratio. 2.0 = 2 units of reward for 1 unit of risk.
- **Use RSI Divergence Filter (true)**: Enables/disables the RSI divergence filter.
### Imbalance Filters
- **Minimum Imbalance Size (ATR) (0.3)**: Minimum imbalance size in ATR units to filter out small imbalances.
- **Enable Lookback Limit (false)**: Activates historical lookback limitations.
- **Maximum Lookback Bars (300)**: Maximum number of bars to look back.
### Visual Settings
- **Show Imbalance Size**: Displays imbalance size in ATR units.
- **Show RSI Divergence Lines**: Shows/hides divergence lines.
- **Divergence Line Colors**: Colors for bullish/bearish divergence lines.
### Volatility-Based Adjustments
- **Low volatility markets**:
- Minimum Imbalance Size: 0.2-0.4 ATR
- ATR Stop Loss Multiplier: 1.5-2.0
- **High volatility markets**:
- Minimum Imbalance Size: 0.5-1.0 ATR
- ATR Stop Loss Multiplier: 2.5-3.5
### Risk Tolerance
- **Conservative approach**:
- Risk:Reward Ratio: 2.0-3.0
- RSI Divergence Filter: Enabled
- Minimum Imbalance Size: Higher (0.5+ ATR)
- **Aggressive approach**:
- Risk:Reward Ratio: 4.0-6.0
- Minimum Imbalance Size: Lower (0.2-0.3 ATR)
###Market Conditions
- **Trending markets**: Higher RSI Period (21-28)
- **Sideways markets**: Lower RSI Period (10-14)
- **Volatile markets**: Higher ATR Multiplier
## Recommended Testing Procedure
1. **Start with default settings** and backtest on 3-6 months of historical data
2. **Adjust RSI Period** to see which value produces better results
3. **Optimize ATR Multiplier** for stop loss levels
4. **Test different Risk:Reward ratios** comparatively
5. **Fine-tune Minimum Imbalance Size** to improve signal quality
## Important Considerations
- **False positive signals**: Imbalances may be less reliable during low volatility periods
- **Market openings**: First hours often produce more imbalances but can be riskier
- **News events**: Consider disabling strategy during major news releases
- **Backtesting**: Test across different market conditions (trending, sideways, volatile)
## Recommended Settings for Beginners
**Safe settings for new users:**
- RSI Period: 14
- ATR Period: 14
- ATR Stop Loss Multiplier: 2.5
- Risk:Reward Ratio: 3.0
- Minimum Imbalance Size: 0.5 ATR
- RSI Divergence Filter: Enabled
## Advanced Tips
### Signal Quality Improvement
- **Combine with market structure**: Look for imbalances near key support/resistance levels
- **Volume confirmation**: Higher volume during imbalance formation increases reliability
- **Multiple timeframe analysis**: Confirm signals on higher timeframes
### Risk Management
- **Position sizing**: Never risk more than 1-2% of account per trade
- **Maximum drawdown**: Set overall stop loss for the strategy
- **Market hours**: Consider avoiding low liquidity periods
### Performance Monitoring
- **Win rate**: Track percentage of profitable trades
- **Average R:R**: Monitor actual risk-reward achieved vs. target
- **Maximum consecutive losses**: Set alerts for strategy review
This strategy works best when combined with proper risk management and market analysis. Always backtest thoroughly before using real money and adjust parameters based on your specific market and trading style.

MomentumThe strategy uses EMA200, ADX/DMI, RSI, and volume. Pivot levels and Heikin-Ashi ensure safe entries, while cooldowns and opposite-locks prevent overtrading. Exits are managed with ATR trailing stops and trend-reversal signals.

Opening Range Breakout🚀 ORB – Optimized for Peak Performance 🚀
Catch the morning breakout moves with zero guesswork!
This plug-and-play Opening Range Breakout strategy is fully optimized ; no settings to tweak, no parameters to adjust.
✅ Pre-tuned for U.S. market open on 5-minute charts.
✅ Built-in risk management with stop loss, take profit, and one trade per day.
✅ Auto exit before market close to lock in gains and avoid late-day whipsaws.
Perfect for day traders who want to focus on execution, not experimentation.
Just load it, trade it, and let the strategy do the heavy lifting.
⚠ Disclaimer : Educational use only. Always backtest and paper trade before using with real capital.
Key Features
• No Guesswork – Pre-set with the best-performing configuration.
• Opening Range Breakout Logic – Identifies the early range of the market and trades strong breakouts.
• Strict Risk Management – Stop loss and take profit levels are automatically calculated from the range size.
• One Trade Per Day – Prevents overtrading and keeps the focus on quality setups.
• End-of-Day Auto Exit – Closes all open trades at 3:30 PM EST to avoid late-session volatility.
How It Works
1. Opening Range Calculation: At market open (9:30 AM EST), the strategy monitors opening range.
2. Breakout Entry: Monitors the breakouts with moment.
3. Risk & Profit Targets: Stop loss and take profit are calculated automatically based on the range size. Risk-to-reward ratio is set for balanced performance.
4. Trade Control: Only one trade per day (either long or short). All trades are force-closed at 3:30 PM EST.

Symmetrical Triangle Strategy (Real and Trap confirmation)Overview
This is an advanced strategy that not only detects symmetrical triangle patterns but also attempts to differentiate between a genuine breakout and a false breakout (a trap) to trade accordingly.
Instead of blindly following every breakout, it analyzes the "quality" of the move using Volume and RSI filters. If the breakout appears weak, it prepares to trade in the opposite direction, capitalizing on the pattern's failure.
How It Works
The strategy employs a dual logic that activates after the price breaks the last pivot (H3 or L3):
1. Scenario A: The Real Breakout
* If the price breaks the triangle AND the breakout is confirmed by a surge in volume and/or a favorable RSI, the strategy considers the move genuine and enters in the direction of the breakout.
2. Scenario B: The False Breakout (Trap)
* If the price breaks the triangle BUT the indicators fail to confirm it (e.g., low volume), the strategy interprets it as a potential trap.
* It waits for the price to return inside the pattern.
* Once the price has re-entered, it opens a trade AGAINST the initial breakout, betting that the first move was a fake-out.
Key Features
* Hybrid Logic: It's not just a simple breakout strategy; it adapts to market conditions.
* Confirmation Filters: Uses Volume and RSI to validate the strength of a breakout (fully configurable).
* Capitalizes on Traps: Its greatest strength is the ability to identify and trade false breakouts, a common market scenario.
* Optional Confirmation: For trap trades, an extra confirmation via an EMA crossover can be enabled for added safety.
* Opportunity Timeout: Potential traps have a time limit to be confirmed, preventing the strategy from getting stuck in an undecided scenario.
Important Disclaimer
This strategy is designed as an entry system and DOES NOT INCLUDE A STOP LOSS OR TAKE PROFIT.
Automation Ready
Want to automate this or ANY strategy on your broker or MetaTrader (MT4/MT5) without keeping your computer on or needing a VPS? You can use WebhookTrade.

ETH/SOL 1D Dynamic Trend Core - STRATEGY v 45Overview
The Dynamic Trend Core is a sophisticated, multi-layer trading engine designed to identify high-probability, trend-following opportunities. Its core philosophy is rooted in confluence, meaning it requires multiple conditions across trend, momentum, and volume to align before generating a signal. This approach aims to filter out market noise and provide a clearer view of the underlying trend.
The script includes a comprehensive backtesting engine for strategy optimization and a rich, intuitive visual interface for real-time analysis.
How It Works: Core Logic
The engine validates signals through several sequential layers:
Primary Trend Analysis (SAMA): The foundation is a Self-Adjusting Moving Average (SAMA) that dynamically determines the primary market direction (Bullish, Bearish, or Consolidation).
Momentum Confirmation: Signals are then qualified using a blend of the Natural Market Slope and a Cyclic RSI to ensure momentum is firmly aligned with the established trend.
Advanced Filtering Suite: A suite of optional filters provides robust confirmation and allows for deep customization:
Volume & ADX: Confirms that trades are supported by sufficient market participation and trend strength.
Market Regime: Gauges broad market health (e.g., using TOTAL market cap) to avoid trading against the entire market.
Multi-Timeframe (MTF) Analysis: Aligns signals with the dominant trend on a higher timeframe (e.g., Weekly).
BTC Cycle Analysis: Positions trades within the context of historical Bitcoin cycles using models like the Halving Cycle or Mayer Multiple.
On-Chart Visuals & Features
The script provides full transparency into its logic with a powerful on-chart interface.
IMPORTANT: For the live visual elements to function correctly, you must enable "Recalculate on every tick" in the script's settings (Settings > Properties).
Power Core Gauge: Located at the bottom-center of the chart, this gauge is the heart of the system. It displays the number of filter conditions currently met (e.g., 5/6) and "powers up" by glowing brighter as more conditions align, indicating a fully confirmed signal is ready.
Live Conditions Panel: This panel in the bottom-right corner acts as a real-time pre-flight checklist. It shows the status (pass/fail) of every individual filter, so you know exactly why a signal is, or is not, being generated.
Energized Trendline: The primary SAMA trendline changes color and intensity based on the strength and direction of the trend, offering immediate visual context.
BTC Halving Cycle Visualizer: Provides a background color guide to the different phases of the Bitcoin halving cycle for macro context.
How to Use & Configure
Select Operation Mode:
Backtest Mode: Use this to test different settings on historical data and find optimal configurations for a specific asset and timeframe.
Alerts-Only Mode: Use this for live trading to generate alert signals without cluttering the chart with backtest data. (Contact publisher for access to this version)
Configure Your Filters:
Start with the default filter settings.
If a potential setup is missed, check the Live Conditions Panel to see which specific filter blocked the signal.
Enable, disable, or adjust filters in the script's settings to match your trading style and the asset's characteristics.
Manage Your Risk:
Go to the "Risk & Exit" settings to configure your Stop Loss and Take Profit parameters to match your personal risk tolerance.
Disclaimer: This script is for educational and informational purposes only. It is not financial advice. All trading involves risk, and past performance is not indicative of future results. Please conduct your own research and backtesting before making any trading decisions.

Strategy Designer
**Strategy Designer**
This script is a highly modular, multi-indicator strategy framework that allows users to enable or disable a wide range of signals for precision trading control. Key components include:
* **AlphaTrend**: A dynamic trailing filter built using ATR volatility combined with directional input from RSI or MFI. It helps define bullish or bearish regimes more responsively than fixed moving averages.
* **Inverse Fisher Transformed Indicators**: The script normalizes and transforms traditional oscillators (CCI, RSI, Stochastic, MFI) using the inverse Fisher transform. This boosts signal clarity by compressing values between -1 and +1, making crossovers and trend thresholds more defined.
* **Composite Indicators**: RSI + MFI and CCI + Stoch are averaged to produce smoother, noise-reduced momentum signals. These are ideal for filtering or confirming entries across multiple timeframes or asset types.
* **Volatility & Trend Filters**:
* **ATR Trend Filter**: Confirms trades only when short-term ATR exceeds its smoothed average, indicating rising volatility or breakout conditions.
* **ADX Filter**: Includes two types of filters—ADX vs its MA and ADX vs threshold—to ensure trade entries only happen during clear trend strength.
* **Moving Averages**: Multiple MA types (SMA, EMA, HMA, WMA, DEMA, TEMA, T3, VWMA) are available for crossover and trend conditions. The structure supports general trend, long-trend, and short-trend configurations independently.
* **Volume Filter**: An optional condition to confirm that volume exceeds a moving average, helping avoid trades in low-liquidity periods.
---
**Exit Logic & Risk Management**
This strategy offers powerful and flexible exit controls to suit various risk profiles:
* **Fixed TP/SL**: You can activate classic percentage-based take profit and stop loss levels.
* **ATR-Based Floating Stop**: Dynamically calculates trailing stops based on recent volatility using a smoothed ATR, offering better adaptability in trending environments.
* **Signal-Based Exits**: Includes the ability to exit trades when the original entry conditions reverse (e.g. AlphaTrend flips, Fisher crosses back, MA cross reverses, etc.).
* **Modular Exit Triggers**: Each indicator (CCI, RSI, MFI, Stoch, AlphaTrend, Composite Indicators) can independently trigger an exit based on reversal signals or loss of trend strength.
* **Multi-Layered Protection**: Combine multiple exits (e.g. ATR + AlphaTrend + RSI reversal) to minimize drawdowns and prevent false breakouts.
---
This tool is designed for advanced traders and strategy developers who want granular control over both entries and exits. Every module is toggleable, allowing for endless backtest scenarios and tailored setups to match different market conditions or asset classes. Whether you're trend-following or counter-trading reversals, this strategy adapts.

AM Range Sniper [jmaxxx]AM Range Sniper
Overview
AM Range Sniper is a sophisticated morning session trading strategy designed for Micro E-mini Nasdaq-100 Index Futures (MNQ). This strategy capitalizes on the critical 8:30-9:30 AM EST range formation period, implementing precise entry and exit mechanics with advanced risk management.
Key Features
🕐 Time-Based Range Analysis
Range Definition: Automatically identifies and tracks the 8:30-9:30 AM EST range
Trading Window: Active trading from 9:30 AM to 11:00 AM EST (extended for second chance trades)
Session Management: Daily reset ensures clean state for each trading session
🎯 Multiple Entry Patterns
Breakthrough/Retest: Captures price breakthroughs above range with retest opportunities
Long/Short Opportunities: Comprehensive coverage of both directional moves
Breakdown: Identifies bearish breakdowns below range support
Break Up: Detects bullish breakups above range resistance
Range Sweeps: Monitors for range high/low sweeps with reversal entries
⚡ Advanced Risk Management
Configurable Stop Losses: Tick-based stop losses for each trade type
Take Profit Targets: Automatic target calculations based on range size
Hard Close Protection: Automatic position closure at 4 PM EST
Second Chance Feature: Optional second trade opportunity if first trade loses
🔧 Professional Features
Visual Stop Loss Lines: Real-time stop loss visualization on chart
Debug Information Panel: Comprehensive status monitoring
Alert Integration: Customizable alert messages for entries/exits
Flexible Time Settings: Adjustable for different timezones
Strategy Logic
Range Formation (8:30-9:30 AM)
The strategy monitors the first hour of trading to establish the day's range. This range serves as the foundation for all subsequent trading decisions.
Entry Conditions
Breakthrough: Price breaks above range high with retest rejection
Breakdown: Price breaks below range low with confirmed bearish momentum
Break Up: Price breaks above range high with strong bullish confirmation
Sweep Entries: Range high/low sweeps followed by reversal signals
Risk Management
Stop Loss: Configurable tick-based stops for each trade type
Take Profit: 1.5x range size targets for breakdown/breakup trades
Position Sizing: Percentage-based position sizing
Session Limits: Maximum 2 trades per session (with second chance feature)
Settings & Customization
Core Parameters
Enable/disable individual entry patterns
Configurable stop loss levels (1-500 ticks)
Second chance feature toggle
Previous day level integration
Visual Customization
Customizable stop loss colors and widths
Debug panel visibility
Range line styling
Alert Configuration
Custom entry/exit alert messages
***** Automate With *****
APEX
NinjaTrader
Crosstrade.io ( promo code JMAXXX )
Performance & Reliability
Precision Focused: Waits for high-probability setups
Risk-Aware: Comprehensive stop loss and position management
Session-Based: Clean daily resets prevent carryover issues
Professional Grade: Designed for serious traders
Ideal For
Day Traders: Morning session specialists
Futures Traders: MNQ and similar instruments
Range Traders: Traders who capitalize on range breakouts
Risk-Conscious Traders: Those who prioritize risk management
Disclaimer
This strategy is for educational and informational purposes. Past performance does not guarantee future results. Always test thoroughly on historical data and paper trading before live implementation. Risk management is crucial - never risk more than you can afford to lose.
Created by jmaxxx - Professional trading strategy developer
For questions, feedback, or customization requests, please leave a comment below.

BTC Dynamic Trend Core Strategy v45// The Dynamic Trend Core is a sophisticated, multi-layer trading strategy that provides both a quantitative //
// backtesting engine and a rich, intuitive visual interface. It is designed to identify high-probability //
// trend-following opportunities by requiring a confluence of conditions to be met before a signal is considered //
// valid. //
// //
// The system's philosophy is rooted in confirmation, seeking to filter out market noise by ensuring that trend, //
// momentum, market sentiment, and volume are all in alignment. //
// //
// --- CORE LOGIC COMPONENTS --- //
// 1. **Primary Trend Analysis (SAMA):** The foundation is a self-adjusting moving average (SAMA) that //
// determines the underlying market trend (Bullish, Bearish, or Consolidation). //
// //
// 2. **Confirmation & Momentum:** Signals are confirmed with a blend of the Natural Market Slope and a Cyclic //
// RSI to ensure momentum aligns with the primary trend. //
// //
// 3. **Advanced Filtering Layers:** A suite of optional filters allows for robust customization: //
// - **Volume & ADX:** Ensure sufficient market participation and trend strength. //
// - **Market Regime:** Uses total crypto market cap to gauge broad market health. //
// - **Multi-Timeframe (MTF):** Aligns signals with the dominant weekly trend. //
// - **BTC Cycle Analysis:** Uses Halving or Mayer Multiple models to position trades within historical //
// macro cycles. //
// //
// --- VISUAL INTERFACE --- //
// The strategy's real power comes from its on-chart visual feedback system, which provides full transparency. //
// ****Note: for this to be enabled recalculate 'on every tick' needs to be enabled in the properties settings. //
// 1. **Power Core Gauge:** Located at the bottom-center, this gauge is the heart of the system. It displays the //
// number of active filter conditions that have been met (e.g., 5/6). It "powers up" as more conditions align,//
// glowing brightly when a signal is fully confirmed and ready. //
// //
// 2. **Live Conditions Panel:** In the bottom-right corner, this panel acts as a detailed pre-flight checklist. //
// It shows the real-time status of every single filter, helping you understand exactly why a trade is (or //
// is not) being triggered. //
// //
// 3. **Energized Trendline:** The main SAMA trendline changes color and brightness based on the strength and //
// direction of the trend, providing immediate visual context. //
// //
// 4. **Halving cycle visualisation:** Visual guide to halving phases //
// //
// --- HOW TO USE --- //
// 1. **Select Operation Mode:** Use "Backtest Mode" to test settings and "Alerts-Only Mode" for live signals. //
// //
// 2. **Configure Strategy:** Start with the default filters. If a potential trade setup is missed, check the //
// **Live Conditions Panel** to see exactly which filter blocked the signal. Adjust the filters to suit your //
// specific asset and timeframe. //
// //
// 3. **Manage Risk:** Adjust the Risk & Exit settings to match your personal risk tolerance. //

Backtest [OptAlgo]This backtest script is designed to convert ideas or indicators into backtest results. The script creates buy/sell signals by comparing price sources against fixed values or other imported plots using many comparison methods. It has many features including multiple exit systems: TP/SL, custom plot-based stops and more. It supports full trading automation through webhook alerts with live signal processing.
🔢 Signal Creation System
→ Values Group : Compare price sources against fixed numerical values
→ Plots Group : Compare two different price sources/indicators against each other
→ Flexible Comparisons : 15+ comparison methods (equal, crossover, rising...)
→ Signal Types : Long, Short, Close All, Block signals, and combination signals
→ Merge Rules : Minimum condition requirements for signal activation
🔀 Advanced Signal Logic
→ Counter Signals : Choose between reversing positions or closing them
→ Signal Inversion : Flip all buy/sell signals with one toggle
→ External Signal Import : Import coded signals (1=Long, -1=Short, 0=Close)
→ Day Blocker : Enable/disable trading on specific weekdays
→ Session Control : Limit trading to specific market sessions
⚙️ Strategy Settings
→ Position Sides : All Ways, Long Only, or Short Only modes
→ Signal Control : Individual enable/disable for long and short signals
→ Counter Signal Mode : Reverse Open Position vs Close Open Position
→ Signal Reversal : Global signal inversion capability
🔰 Risk Management (Limiter Settings)
→ Leverage Control : Leverage with liquidation warnings
→ Drawdown Limit : Auto-halt strategy at specified drawdown percentage
→ Tradable Ratio : Use portion of available balance (0.01-1.0)
→ Contract Limit : Cap maximum contract size regardless of balance
🎯 TP/SL System
→ Fixed TP/SL : Set percentage-based take profit and stop loss
→ Custom Plot Stops : Use any indicator/plot as dynamic stop loss
→ ATR-Based Exits : Volatility-adjusted TP/SL using Average True Range
→ Realistic Protection : Prevents unrealistic TP/SL prices in live trading
→ Stop Modes : Instant (Sudden) vs Candle Close execution
→ ATR Stop Loss : Override fixed SL with volatility-based calculations
→ ATR Take Profit : Dynamic TP based on market volatility
→ Trailing Options : Safe, Normal, or Aggressive trailing methods
→ Calculation Modes : Normal, Volume-weighted, or Limited (with max %) options
→ Volume Integration : ATR levels adjust based on volume influx
🤖 Automation & Alerts
→ Webhook Integration : Send JSON alerts for automated execution
→ Live Signals : Real-time signal processing (every tick vs bar close)
→ Strategy Key : Unique identifier for automated systems
→ Early Entry : Send alerts X seconds before candle close
→ Fast Execution : Prevent signal lag in automated trading
🐞 Development Tools
→ Alert Plotting : Visualize signals directly on chart (disable for live alerts)
→ Professional Mode : Remove UI controls for faster calculation
→ Debug : Metrics are plotted in data window.
📊 Key Advantages
→ Multi-Condition Logic : Combine multiple indicators with flexible rules
→ Risk-First Design : Built-in drawdown and leverage protection
→ Automation Ready : Full webhook and alert system integration
⚠️ Important Warnings
→ High leverage combined with high SL may adjust to liquidation price
→ Use consistent leverage across all strategies on same trading isolated margin pair
→ Live signals require "Calculate on every tick" enabled in settings
→ Disable alert plotting when creating actual alerts to prevent latency


TOT Strategy, The ORB Titan (Configurable)This is a strategy script adapted from Deniscr 's indicator script found here:
All feedback welcome!

Matrix Trading Strategy**Matrix Trading Strategy** is a multi-signal framework designed to identify and exploit intraday trends with controlled precision. It combines three independent entry engines—Opening Range Breakout (ORB), Ultimate Trend via ATR trailing, and a moving average crossover (MA Cross)—which can operate alone or in any combination, offering traders maximum flexibility.
Risk management is fully parameterizable: position sizing by percent of equity, fixed cash amount, or fixed quantity; SL/TP in pips aligned to the instrument’s tick size (`pipSize`); automatic break-even; ATR-based trailing stop (with an option to anchor to the UT line itself); and configurable partial exits (TP1/TP2). Daily trade limits, entry cooldowns, and forced end-of-session liquidation enforce strict discipline.
Visually, the script plots EMAs, a 1-minute VWAP, ORB levels, the UT trailing line, and signal markers, and it colors candles by RSI for rapid momentum assessment. Ready-to-use alerts for ORB, UT, and MA signals support seamless automation via webhooks.
All together, Matrix Trading is a modular framework that adapts effortlessly to cryptocurrencies, metals, or global indices, delivering realistic executions and transparent metrics in both backtests and live trading.