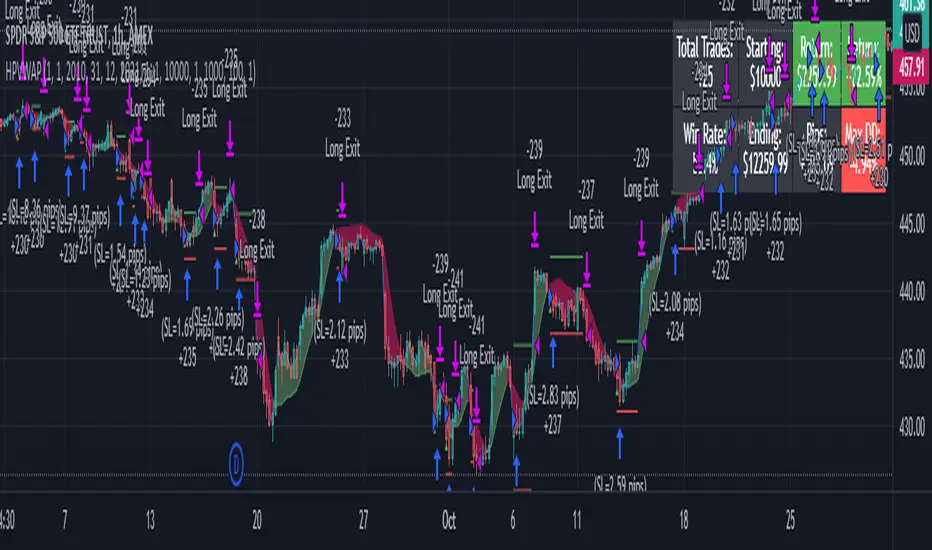
LPB MicroCycles StrategyWhat it is:
We use the Hodrick-Prescott filter applied to the closing price, and then take the outputted trendline and apply a custom vwap, the time frame of which is based on user input, not the default 1 day vwap . Then we go long if the value 2 bars ago is greater then one bar ago. We sell and color the bars and lines when the if the value of 2 bars ago is less than one bar ago.
Also included:
GUI for backtesting
ATR Based Stop Loss
How to use:
Go long when the indicators suggest it, and use the stop losses to reduce risk.
Best if paired with a volatility measurement (inside candles, average true range , bollingerband%B)
Поиск скриптов по запросу "volume"
AleemTalks Crypto MachineOne of best Trend Trading Systems
It Included Moving Averages
Multi Time Frame Analysis
Order blocks
Support and Resistance
To understand it completely
You can Inbox me

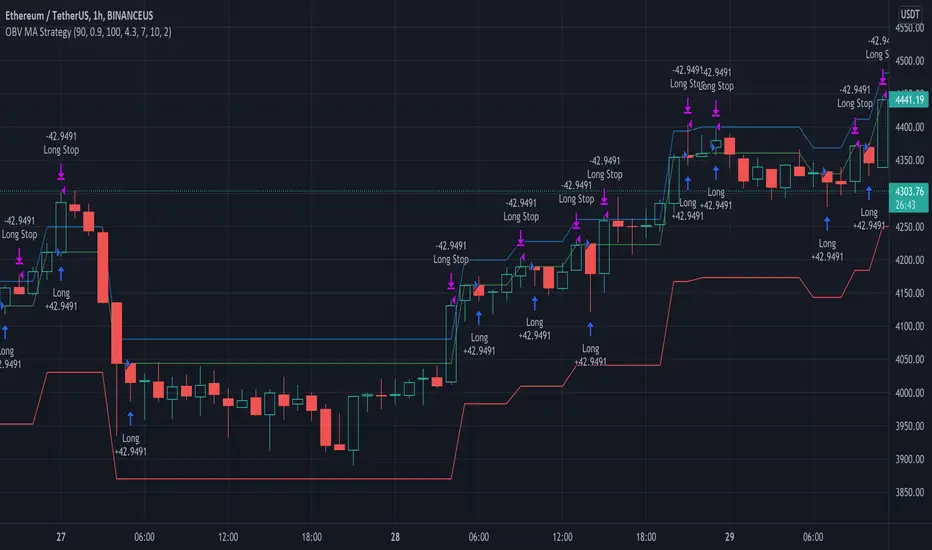
OBV MA StrategyThe On Balance Volume + Moving Average Strategy
Parameters: 1H candles, ETHUSDT on BINANCEUS, commission percent uses Binance's maker/taker fees of 0.075%
Strategy: I create a 30 day moving average of the On Balance Volume "obvSma = ta.sma(ta.obv, 30)." Then I use the following buy conditions:
OBV crosses above the OBV moving average
The obv drops x% below the OBV moving average (buy a dip)
The OBV moving average is rising, the OBV is greater than the OBV moving average and the OBV is rising
The first buy condition is attempting to buy into an uptrend. When the OBV rises above the OBV moving average, people are buying and it's a good time to enter the trade.
The idea behind the second buy condition is to buy a dip so make sure you are careful to not set it too shallow or you'll end up buying the dip before the dip before the dip. :) I recommend 10% or more.
The third buy condition is there in case our trailing stop takes us out of a trade but the trend is still rising, we don't want to miss out on that profit so if the OBV is above the OBV moving average, the average is rising and the OBV is rising, we are likely in the middle of an uptrend and we should buy in.
Supertrend + Stoch Strategy Multi-pair Signal AlarmBITSTAMP:BTCUSD
An entry alarm on Supertrend Stoch Strategy . It can monitor 10 trading pairs in one alarm.
Use this script on any trading pair and deploy the alarm. The alert comment shows the pair name, direction, entry point, sl/tp, and percentage of your position you should cost.
I currently use it as a signal for my grid trading.

Ultimate Bullish Divergence for RSI MFI RVSI OBV w/ Buy SignalsThis strategy is based on the Indicator below and includes all of its features.
This version Includes the Strategy tester and a dynamic SL
The only drawdown of this version is that Alerts are not as customizable
Ultimate Bullish Divergence for RSI OBV RVSI MFI w/ Buy Alerts

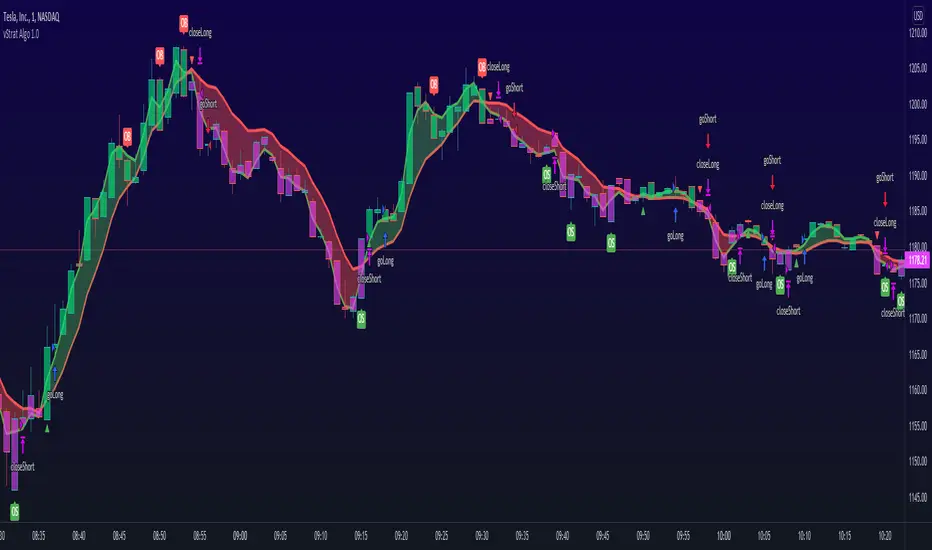
vStrat Algo 1.0 (BETA)vStrat Algo 1.0
The Very First Scalping/Intraday Trading Algo for Options
Note: If you have any favorite indicators that you use regularly and are helpful, feel free to use them in conjunction to this strategy.
Legend:
long = buy call
short = buy put
close entry = sell call/put
BULL = bullish engulfing
BEAR = bearish engulfing
OS = oversold
OB = overbought
Instructions:
1. You can choose to watch the 3 minute or 5 minute chart but be aware of the Pro’s and Con’s. It’s not recommended to use this strategy on the 1 minute chart, but this works on higher timeframes. Keep in mind that the signals will vary on each timeframe.
3 minute 5 minute
i.ibb.co i.ibb.co
2. It’s best to use this strategy right at market open. If a “long” (buy CALLS) or “short” (buy PUTS) signal was given at pre-market, I do not recommend taking it. Only take signals once the market opens. If you really wish to take the signal that was given 1-5 minutes before the market opened, you most definitely can, but its’s just riskier. What I would do is, wait 3-10 minutes after market open and if one Moving Average is respecting the other and holding above or below it, you can enter especially if the blow is bullish, the vStrat Algo 1.0 will also tell you if the candles are bearish or bullish. Use your best judgement.
i.ibb.co [
3. You do not have to wait for the exit signal, everyone's risk management is different so take profits whenever you're green or hold as long as the short-term MA is still trending above or below the long-term MA and is not touching or bouncing off it.
i.ibb.co
4. Avoid taking any signals from 11:30 AM ET - 2:30 PM ET, when stocks are trading sideways since the algo’s stop losses get triggered here due to the low volume.
i.ibb.co
5. Lastly, there is no magic indicator or strategy, this algorithm is designed based on multiple conditions. Each signal gets triggered when ALL the conditions are met. This strategy is based off advanced moving averages, one that reduces lag and responds quicker than the simple and exponential ones, RSI value, S/R, pivot points, and a few others. I’m always looking for ways to improve this scalping algorithm so rest assured any complaints or suggestions will be taken and fixed as timely as possible. For best results, avoid trading with your emotions. If you’re a new user, open a small position, set a stop loss, and let the algorithm decide how you will trade it for that day. Keep doing this until you get more familiar with the script then slowly increase your position sizing, but do not invest money you can’t afford to lose. Play with the settings, change the lengths if you wish, but the script was created to provide the most accurate signals as it is. If you do decide to change these inputs, the signals will also be different. Take profits whenever you see fit, the goal is to have a green day and grow your account slowly but surely. If you make a profit, do not risk giving your money back to the market by overtrading. Always do your own due diligence and use your best judgement. Good luck, Traders!
DISCLAIMER : All information found here, including any ideas, opinions, views, predictions, forecasts, commentaries, suggestions, or stock picks, expressed, or implied herein, are for informational, entertainment or educational purposes only and should not be construed as personal investment advice. While the information provided is believed to be accurate, it may include errors or inaccuracies. Conduct your own due diligence or consult a licensed financial advisor or broker before making any and all investment decisions. Any investments, trades, speculations, or decisions made on the basis of any information found on this site, expressed, or implied herein, are committed at your own risk, financial or otherwise.
Algo Trading Strategy (Nifty & BankNifty)What is Algo Trading Strategy ( Nifty & Bank Nifty )?
There are many 9 to 5 working professionals who have some spare money to invest each month but they can not do active trading because they are busy with their full time job.
So they wish to have an automated system which could take and close trades for them with a proven back-tested strategy, proper money management, ability to trade within particular timings, pre-defined maximum loss they can bear and so on.
To cater needs of such type of traders, we created from scratch; and published an 'AutoTrading Algo (Nifty & Bank Nifty) in Sep 2021. (The link is given below, please read on).
Many people who want to try this AutoTrading Algo want us to share stats of this algo with them.
In order to fulfil this demand, we have converted that "Algo Trading" Study into a Strategy whose description you are reading right now.
For all other queries related to how our "Algo Trading (Nifty & Bank Nifty)" works, what are its limitations, benefits and other features, please read the description of our main 'Algo Trading (Bank Nifty & Nifty )' study which is available at following link:
Note:
1. in order to test this strategy on longer time period, you must have a Premium TradingView account.
2. If you have premium TradingView account, the stats you generate will exactly match with our stats which we keep sharing in our channel.
3. To Enable Auto-Trading, You will need to connect this Algo with your broker's trading platform through 3rd party platforms. We will guide you on how to do this, when you contact us.

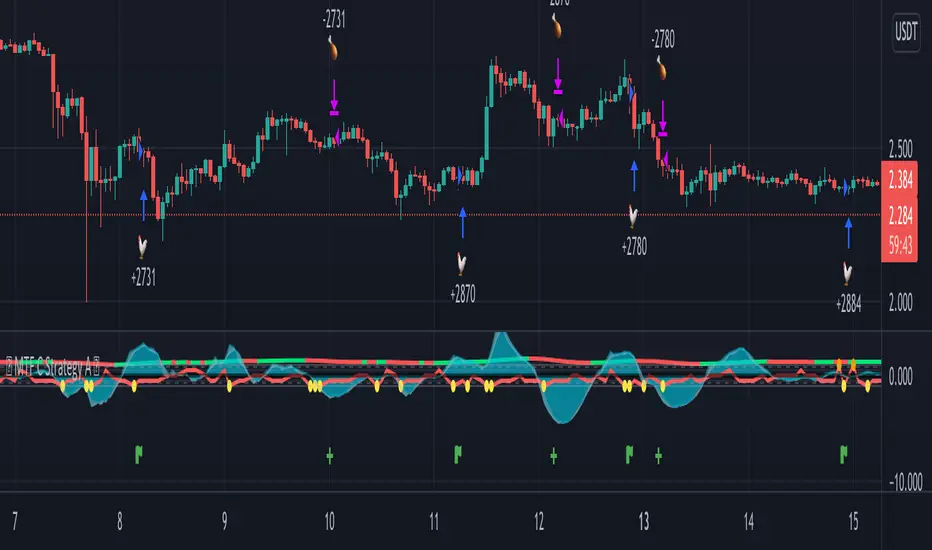
MTF C Strategy A
The Pearson coefficient is a type of correlation coefficient that represents the relationship between two variables that are measured on the same interval or ratio scale. It's a measure of the strength of the association between two continuous variables.
This script allows you to choose one or more sources as a curve, if several sources are chosen, their average is taken into account in an EMA or SMA of your choice. It is possible to have the average of all the curves and to add one or more other curves for an influence on the calculated average.
Then, on the basis of this curve a correlation is calculated from 8 time ranges which give 4 curves, it is on this basis that the conditions of entries in the trade and / or exits are based with the possibility of adding an RSI condition.
For some entries, it is possible to try the symmetrically opposite condition, ie the one that is used in shorts.
To make entry short work, you must activate an exit short option.
However, exit conditions are more flexible than entry conditions because they allow the inverse entry condition used and / or to use statistical indices such as CCI / RSI / ROC / BB as exit condition independently or combined way.
It should be noted that if a condition among those chosen is executed substantially first, it will predominate over the others (same for long / short entries).
In addition, it is possible to choose a stop loss as an exit condition, however, it is not possible to combine the other exit conditions with the stoploss at the same time. Credits to adolgov for the base of the stoploss script part.
You can combine several curves, just as it is possible to combine several types of trade entries / exits.
The strategy uses 100% of equity, it has not been configured in such a way that there is an order pyramid and the closings are done on a total equity basis.
You can configure a daily session interval, a limit of the number of daily trades, a limit of drawdown.
You can add comments for each execution of an opening / closing order respectively to the direction (long or short).
Each step of the configuration has a tip, a button that must be hovered over in order to have the information relating to the configuration.
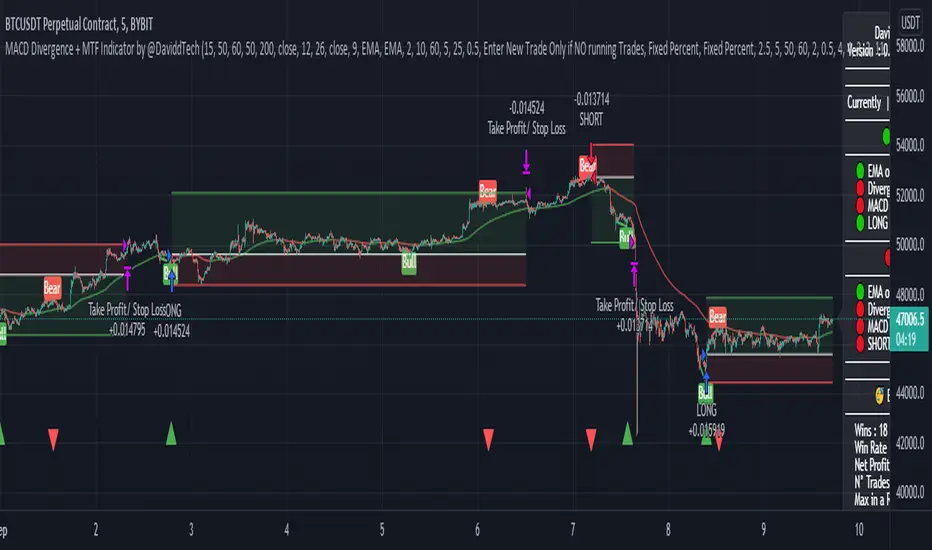
MACD Divergence + MTF EMA Reversal by @DaviddTechMACD Divergence + MTF Indicator / EMA by @DaviddTech
Long :
* Find Divergence in the MACD line
* Multi Time Frame EMA 50 15 minutes above Multi Time Frame EMA 50 60 minutes
* MACD and Signal line are below the 0 line
* MACD crosses above the Signal line
Short :
* Find Divergence in the MACD line
* Multi Time Frame EMA 50 15 minutes below Multi Time Frame EMA 50 60 minutes
* MACD and Signal line are above the 0 line
* MACD crosses below the Signal line
EMA usages instead.
* I found that as a strategy this could work better with the 200 EMA line.
* Trends reversals also gave good results.
Trend Reversals :
* Price is below EMA 200 - Take LONG on divergence.
* Price is above EMA 200 - Take SHORT on divergence.
** You may need to turn off MTF ema when using the Simple EMA 200
WARNING:
- For purpose educate only - My mission is to debunk fake strategies with code to find THE ONE.
- Plots EMAs and other values on chart.
- This script to change bars colors.
SQZ Multiframe StrategyThis is a first attempt to automate what my current strategy when trading is.
It uses 2 timeframes: the one you are currently using to see the chart and an "anchor trend" which is a higher order frame.
Supported timeframes are: 1m, 5m, 15m, 30m, 1H, 4H, 1D, 1W
The Strategy relies on two indicators:
Squeeze Momentum Indicator
CMF
How does it works?
It looks for a moment when the following conditions are met.
For Long:
Positive directionality in SQZM monitor in anchor timeframe
Positive directionality in SQZM monitor in current timeframe
Recent minimum in CMF
For Short:
Negative directionality in SQZM monitor in anchor timeframe
Negative directionality in SQZM monitor in current timeframe
Recent maximum in CMF
After a BUY or SELL order is executed the plot will start showing two lines: A TP line, and a SL line.
The TP and SL move dynamically based on a greedy algorithm based on 3 input parameters.
Min Profit to Start Moving SL (%): Sets an initial target for the trade.
Maximum Possible of SL (%): This is the maximum amount possible for SL. If volatility is not too high, a shorter SL will be chosen based on Kaufman's Stops method
Take profit factor: Is how much portion of the target I am taking as profit once the target is reached
Example for 5% Min profit:
When the first target is reached (+5%), the SL will be updated to 2.5% over the enter price.
When the second target is reached (+10%), the SL will be updated to 5% over the enter price.
Note: The strategy might abandon the position prematurely if a contrary signal is received while the trade is opened, and will change direction.
The Strategy has been backtested mostly for crypto. It might be good for stocks too, but the parameters mentioned might need some adjustments since price moves at a different rate.
Recommended timeframe is 4H for BTC , and 30min/1H for alts.
Comments and ideas are more than welcome!

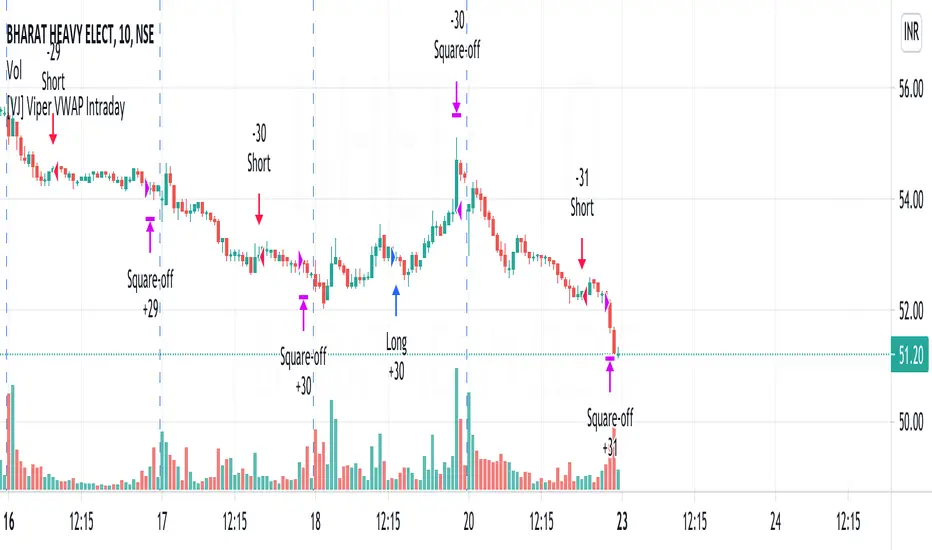
[VJ] Viper VWAP IntradayHello Traders, this is a simple intraday strategy involving the ever reliable VWAP and a chop index to add twist to the traditional style . You can modify the values on the stock and see what are your best picks. Comment below if you found something with good returns
Strategy: VWAP based strategy but uses an additional powerful indicator Chop index to help us stay out of false trades.
Indicators used :
VWAP identifies the true average price of a stock by factoring the volume of transactions at a specific price point and not based on the closing price. VWAP can add more value than your standard 10, 50, or 200 moving average indicators because VWAP reacts to price movements based on the volume during a given period.
The Choppiness Index is designed to determine whether the market is choppy or trading sideways, or not choppy and trading within a trend in either direction. Using a scale from 1 - 100, the market is considered to be choppy as values near 100 (over 61.80) and trending when values are lower than 38.20)
Buying/Selling typically happens at VWAP Breakouts which is then validated with extreme CI to ascertain the entries
Aggressive trade stop can be employed by using the % for long and shorts in the strategy.
Usage & Best setting :
Choose a good volatile stock and a time frame - 10m.
CI Index : 14
Trend Factor - anything below 38.2 is considered in trend, you can experiment from 50
There is stop loss and take profit that can be used to optimise your trade
The template also includes daily square off based on your time.
[VJ] Mega Supertrend for IntradayThis is a simple intraday strategy for working on Stocks or commodities based out on Super Trend and intraday's best friend - VWAP . You can modify the start time and end time based on your timezones. Session value should be from market start to the time you want to square-off
Important: The end time should be at least 2 minutes before the intraday square-off time set by your broker
Comment below if you get good returns
Strategy: Tweaked Super trend with VWAP
Indicators used :
Super trend is simple and easy to use indicator and gives a precise reading about an on going trend.It is built with two parameters, namely period and multiplier.The Buy and Sell signal modifies once the indicator tosses over the closing price. When the Super trend closes above the Price, a Buy signal is generated, and when the Super trend closes below the Price, a Sell signal is generated. In this case we use it only for direction .
Multiplier is a vital input for Super trend. If the multiplier value is too high, then lesser number of signals is made.
Volume is important as we don’t want to get stuck with a stock which has few takers, even if you think it is priced attractively. Thus, the VWAP was created to take into account both volume as well as Price so that the potential trader would make the trading decision or not.
In simple terms, the Volume Weighted Average price is the cumulative average price with respect to the volume
Buying/Selling
when the closing price starts moving up/down and farther from the VWAP, there is pressure among the traders to sell/buy, a general belief kicks in that it might be that the stock is overvalued/undervalued .This is the time when we couple the Super trend to take our entries
Usage & Best setting :
Choose a good volatile stock and a time frame - 5m.
ST multiplier : 3
There is stop loss and take profit that can be used to optimise your trade
The template also includes daily square off based on your time.

QuickSilver Intraday using RSIThis is a simple intraday strategy using very basic intraday super indicators - RSI & VWAP for working on Stocks . You can modify the values on the stock and see what are your best picks. Comment below if you found something with good returns
Strategy:
Indicators used :
The Relative Strength Index (RSI) is one of the most popular and widely used momentum oscillators.The values of the RSI oscillator, typically measured over a 14-day period, fluctuate between zero and 100. The Relative Strength Index indicates oversold market conditions when below 30 and overbought market conditions when above 70
VWAP identifies the true average price of a stock by factoring the volume of transactions at a specific price point and not based on the closing price. VWAP can add more value than your standard 10, 50, or 200 moving average indicators because VWAP reacts to price movements based on the volume during a given period.
Buying happens at VWAP Breakouts which is then validated with RSI to check for overbought & oversold conditions.
Aggressive trade stop can be employed by using the % for long and shorts in the strategy.
Usage & Best setting :
Choose a good volatile stock and a time frame - 10m.
RSI : 9
Overbought & Oversold - can be varied as per user
There is stop loss and take profit that can be used to optimise your trade
Extending this to,
In general guidelines for RSI :
Short-term intraday traders (day trading) often use lower settings with periods in the range of 9-11.
Medium-term swing traders frequently use the default period setting of 14.
Longer-term position traders often set it at a higher period, in the range of 20-30.
The template also includes daily square off based on your time.

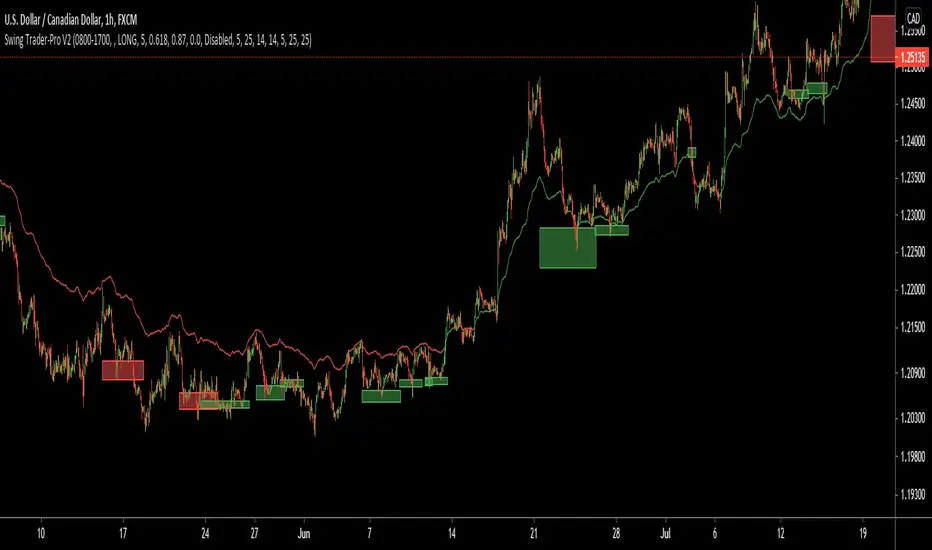
Swing Trader-Pro V2The strategy- what is it?
This indicator is designed from a theory created by myself in order to distinguish a correction from an impulse. This comes down to the ability to compare "x" range of candles to "y" range of candles and highlight key differences to then correctly portray that the most recent move in price will be (or is) a correction.
Following this theory, we all understand that corrections don't go with the trend right? So this means at some point, there is a high probability of a rejection somewhere in this most recent move, that will ultimately push price higher or lower as it continues back with the trend. Therefore, through extensive quantitative research and back-testing, we are able to highlight areas of high-probability rejections within these supposed corrections.
How does it work?
Firstly, we need to establish a high and low point (using pivots ) that help us decide what the state is of the recent move between the high and low (we call this "point A" and "point B"). So we can only consider whether the recent move in price was an impulse or a correction until the move from "point B" to "point C" is made. But before that, once we have identified "Point A" and "point B", we use 2 (supposedly) strong levels which help integrate a box onscreen and thus, indicate this area of high liquidity. This box will continue to adjust according to the change of pivots (if price keeps creating HH's & HL's or LH's & LL's depending on market trend). But if we establish a strong high and low and price stays within this range, then the box will remain in place.
The default color of the box is red; the only time the color of the box will change is when:
- Price retraces from the high/low back to the box (price has to touch the box)
AND
-If any of our confirmations indicate a successful correction based on our theory.
So the box color varies:
- Red = very weak (or) no entry = no confirmations were made
- Yellow = weak entry = some but not all confirmations were made
- Green = strong entry = all confirmations have indicated that the move from "point B" to "point C" (remember that "point C" is where the box is) is a correction when compared with the move from "point A" to "point B"
These confirmations are all validated on the same candle during live candle activity (not when the candle has closed on the box). As this happens, the confirmations will determine the state of entry quality as soon as price touches the box.
In this time, we will see a new orange label highlighting what indicators have confirmed a successful correction and what haven't.
The label shows the different confirmation indicators in which we have provided different names (as this is the secret we intend to keep). So we have:
- "CC"
- "B1/B2"
- "B3"
Usually, we will see either an "OK" or "NOT OK" next to each confirmation indicator. This just tells us whether they have confirmed or not. Please note that this "point C" label does not stay permanently, regardless of the state of entry quality. The label will in fact stay on the screen until the next box has been generated, which is usually a few candles after the entry has been triggered.
Entries, SL's and TP's
This indicator shows the user an area of high-probability rejection. So in terms of specifying a precise entry, you're completely free to enter on the following:
- the moment price touches the box (depending on what color it is of course)
- the other end of the box (if you would like to catch a "sniper entry")
- or if price pierces the entire box and is still green, you can wait to see if price comes back through the box (which indicates a false breakout).
As for Stop-losses, i would recommend:
- Long entries: set your SL at the recent low (this should be "point A")
- Short entries: set your SL to the recent high (this should be "point A" as well, because if you're switching from the "long entry" setting to the "short entry" setting, the indicator labels flip around and are the opposite of what they are for long entries).
For Take profits, this is entirely up to the user. Because some entries will allow you to have great RR ratios depending on how you manage the active trades. Some recommendations below:
- Set TP to "point B" pivot
- Use trailing stop function or something similar if available
- Add other indicators such as the RSI and close when price reaches key levels
- When price shows signs of exhaustion or early stages of reversal then just close
Additional information and recommendations
- This works on any time frame and on any financial market, whether you prefer Forex, stocks, crypto, commodities , etc.
- In regards to trade direction, you can change in the settings to look for either long or short positions in the market. I would recommend using it in favor of the overall trend of the markets because you will find a lot better entries. Although, this does work against the trend at times as well. Additionally, this tool also works in consolidating markets which is beneficial.
- After becoming used to the script, i would say to apply it twice to your screen and have one looking for Long entries and the other looking for Short entries.
- As the user, you have the ability to remove the labels in the parameter settings (because it does look quite messy onscreen, especially if you have both long and short entries on at the same time). I would only personally show the labels when price hits the current box to see what confirmations have been identified.
- I will also provide the best parameters to use. You will only need one set of parameters for each long and short setting, as these parameters are universal for any time frame and any financial market.
FIRST UPDATE
After extensive back testing using our first version, we found that in fact, there are some great opportunities being wasted as the entry box stays red. This is due to some series of market structure that don't always fit our theory of continuations within the market. We found that although our theory is accurate, the amount of times the market fits this is more rare than times when price follows sequences. When we look for sequences in the market instead of specifying differences between impulses and corrections, we actually see areas of serious repetitiveness, thanks to how our indicator initially generates. Not how it confirms. So, understanding this new theory through one component of our previous indicator, we are still able to keep boxes at the same area yet accurately confirm more profitable entries external to our full previous strategy.
Moving towards the practical side of things:
-Make sure "add extra confirmation" parameter is selected, as this will allow the indicator to search for more valid entries rather than just our normal confirmations. (this is a tick box).
- Default parameters are already set for both C1 and C2
In a simple sense, this update is added to find more confirmations to turn more red boxes into green boxes based on other theories outside of our original one. How we do this exactly is part of the mystery.
SECOND UPDATE
- Fibonacci based moving average: using elements of the Fibonacci sequence and its relevance to being a hot-spot in price activity, we have integrated this into a moving average which is stronger than your usual MA. Here, you will notice it showing stronger signs of rejecting price, especially when trending. Hence, this is extremely useful to implement into your strategy as part of the trend identification. When price is consolidating, depending on how volatile or close-in the waves are during these periods, the FMA is similar to your typical MA, so therefore not so good. But the overall intention of this is to enhance your conclusion to whether price is trending and whether price is bullish or bearish.
- This is now a strategy, not just an indicator: So now we can choose from a huge variety of parameters in accordance to what ones work best with what pair, or time frame. The typical parameters to change would be the entry points, stop losses and take profits. We have also added in a "SL to entry" option. ALL PARAMETERS ARE FIBONACCI LEVELS AS THIS MAKES IT UNIVERSAL TO ANY PAIR/ TIME FRAME.
- Move the entry boxes : So this is very useful for certain pairs and mainly to help the user understand key sequences on a quantitative level. Sometimes we can notice that pairs spike higher than the typical entry (0.618) so we have allowed flexibility to the point where you can alter the box appearance to either the 0.618 level (default), 0.786 and the 0.9 level.
- Back-testing: Now the user can back-test the strategy and see the performance within any financial market you add this to! Please note that according to the strategy, once a trade is placed, it wont enter any more trades when the current one is still active. I have requested to change this, but it is out of our development team's reach. However, this doesn't discredit what the system can help you achieve, as you will still be able to find profitable parameters within the financial markets.
Strategy default properties
Backtest start: this date is when you would like to start the backtest, however, the indicator will go as far as the data can be read
Backtest end: choose your date to end the back test.
Trade session: choose the trading session you want this strategy to work on.
Filter by session: you can filter the backtested results depending on whether you want the strategy to take trades within the chosen trading session.
Filter by Fibonacci moving average: select this if you would like for the back tested results to consider whether the valid trade setups are in accordance to what the FMA displays (Bullish or Bearish). This is deselected.
Fibonacci Moving Average Timeframe: here you can select what timeframe you would like the FMA to work on, default is the “same as chart” button/ option.
TraderDirection: choose whether you would like LONG or SHORT entries for the indicator to find.
Max risk per trade: choose the risk setting per trade, i would suggest lowering this to 1% ((MODERATOR) This is the default setting!)
EntryFib: choose between the options as to where you would like the strategy to enter positions, the default is the 0.618 zone which is the closest side of the box to price. You will also see that when you choose to change this, the boxes on your screen will move accordingly. A very helpful function!
StopFib: choose your Stop Loss based on the same Fibonacci level as what you choose for your entry, remember that the higher the fib level, the higher (or safer) your Stop Loss is from price spiking. It all comes down to preference.
TakeProfitFib: choose your Take Profit based on the same Fibonacci level as what you choose for your entry, remember that the lower the fib level, the higher your Take Profit is again, It all comes down to preference.
BreakevenFib: the default setting is on “disabled” however when you select a certain Fibonacci level, once price reaches there during the active trade, your Stop Loss will be set to entry, this function is designed to stop volatile price fluctuations rendering your in-profit trade result to hitting your Stop Loss and losing when it closes out.
Crypto RSI with RVI StrategyThis is a long only strategy adapted for crypto market.
Its idea is to take the most juice out of a long trend and cut the losses as soon as possible.
For this , its components are RSI with a very big length - 100 or 200 preferably and RVI.
Rules for entry
If RVI is in the buy zone and we have a crossover from RSI with the overbought level.
Rules for exit
With change condition : If RVI is in the sell zone and we have a cross under from RSI with the oversold level.
With stop loss : we have a SL based on movement in % of the price, recommendable between 5-10%.
If you have any questions let me know !

Sola Fide [Strategy]Sola Fide High Accuracy with ATR R:R
Indicators used:
- Stochastic RSI
- Chopiness Index
- RSI
- Ichimoku Cloud
- ATR
Script has been set up in strategy format to give backtesting data.
The strategy has been made for BTC and ETH pairs against USDT on the hourly timerframe
Currently outperforming the Buy and Hold Return on both assets.
This script has been made to make it easier to automate strategies on 3commas
In the settings you will see options for BTC strategy or ETH strategy
Choose the asset you are on, copy your 3commas Bot ID and Email token and paste them into the settings box for eachever asset you are on.
To receive the alerts set up within the strategy, in your alert message box use " {{strategy.order.alert_message}}"
This will then be able to send any orders taken on the tradingview script directly to your long or short bot on 3commas
This strategy is set up with a strict set of rules on the ATR for the Take profits and Losses.
There is a repaint warning because the code uses heikin ashi candles through the security function, the given entry and exit signals do not repaint,
I have been automating this for myself with no errors.
You don't need to use more than 3x leverage...
Past results do not guarentee future results.

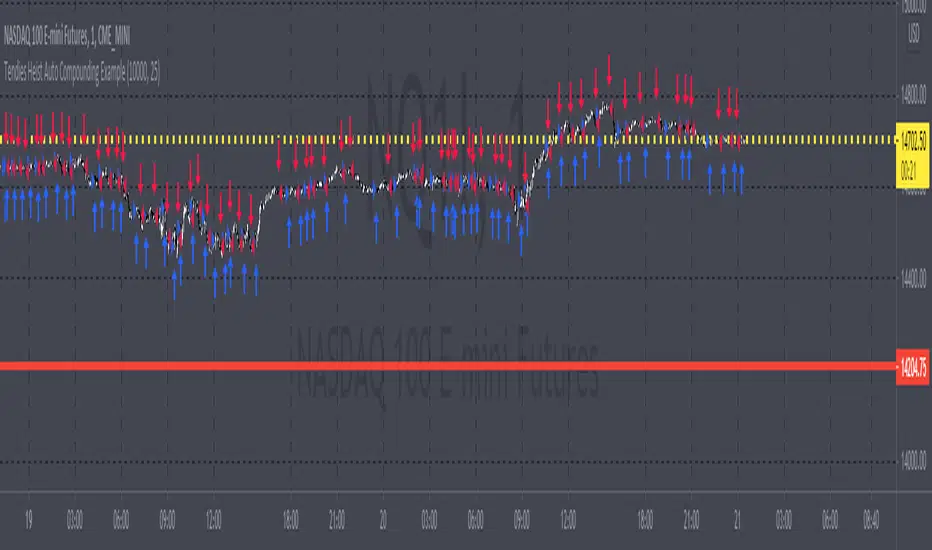
Tendies Heist Auto Compounding ExampleThis is an example of how we can use compounding to control our position size. This example shows how we can automatically add and reduce position size based on account equity. The "initial capital" in properties is the starting account equity. At default its set to 100,000. If our max position size is set to 25 then the very first position that's taken has a position size of 10, IF our leverage is set to 10,000. Account equity divided by leverage equals position size. So in that example 100,000 divided by 10,000 in leverage gives us a max position size of 10. However the max position size was set to 25 meaning we would need 250k in equity for it to open a position size of 25 with the leverage set at 10k. Now if the initial capital was set to 100,000 and the max position size was set to 5 and leverage remained at 10,000, all though 100,000 divided by 10,000 equals 10 it will ONLY open a position size of 5, because the max position size in this example was set at 5. Since this works for strategies you may look through the trade log on the posted back test and check out the position size, you can see in this back test the default 100k is used for the initial capital and the default 10k was used for the leverage. You will be able to see as this logic loses money it takes contracts away and as it gains money it adds contracts. I'm using trading view's basic strategy logic example to provide an example of how the compounding logic works.
Note, don't forget to add the syntax below to your strategy.entry call for this logic to work.
qty = size
Tendies Heist LLC 2021
Kifier's MFI/STOCH Hidden Divergence/Trend BeaterMFI/STOCH Hidden Divergence/Trend Beater
General Idea:
My premise around this strategy was to make a general strategy for crypto that would help out with finding entry positions for when you’re bullish on a crypto and want to hold on for a while, and at the same time avoiding massive drops. Essentially a way to mix long term/ swing trading; I somewhat achieved my goal however it still requires a lot of logic tuning of the trend averages.
I’m a huge proponent of volume indicators and coupled with average closing price, I think this gives a really good idea of what is happening with the market. It gives an idea on the market and retail investor sentiment. This generally gives you logical entry positions (Although I don’t know how amazing that will work with all cryptos, there’s a fine line between a good strategy and one that just rides bubble market conditions, some would argue that’s still a success and others not)
How it works:
There are many components to the strategy that try to do different things:
First of all there are two types of entries, a MFI hidden divergence with a STOCH check, essentially it will only fire when a divergence is detected while STOCH is above 50%, however this might be changed in the future as due to the volatile nature of cryptos, the STOCH is not too effective. The second entry is a simple MFI/STOCH trend, if STOCH is above 50% and the trend is detected to be in a trending long, once a MFI crossover over the 50% line is detected an entry is placed, this is designed to get out profit where the divergence would otherwise be less accurate during strongly trending conditions.
-MFI is a great indicator, as a volume weighted momentum indicator I find it the most accurate of all, the STOCH however is a great indicator to get a general picture of simple market conditions and can filter out the emotional noise of retail investors.
-VWMA and an SMA (The bottom oscillator) gives an idea of the trend tacking into account of the volume, this serves as a more short term filter of the trend for filters.
-OBV checks are done between the OBV and an EMA of the OBV, to get the idea of a volume weighted long trend, which is important for crypto as there are massive rallies to go up due to retail greed, it’s great to jump onto it at the beginning, and get off before the stack of cards fall apart.
-ATR is used to detect when the market is relatively just ranging or moving sideways, which is where the hidden divergence entries are done, during predictable and profitable market conditions.
- Stop loss is based on the closest support of the entry, this is a nice medium of room to breath but also an actual stop loss.
Future plans and improvements:
Currently there’s a lot I want to improve, mostly the divergence detection and the overall sharpe ratio could be much better, but the current value of 0.5 gives me hope that the strategy is onto something. I also want to change TP from a percentage stop to something more dynamic but that might be too optimistic. The current plan is to paper trade test this either by manual or by a python bot, to see how it performs with some user input as well.

MACD ReLoaded STRATEGYSTRATEGY version of MACD ReLOADED Indicator:
A different approach to Gerald Appel's classical Moving Average Convergence Divergence.
Appel originaly set MACD with exponential moving averages.
In this version users can apply 11 different types of moving averages which they can benefit from their smoothness and vice versa sharpnesses...
Built in Moving Average type defaultly set as VAR but users can choose from 11 different Moving Average types like:
SMA : Simple Moving Average
EMA : Exponential Moving Average
WMA : Weighted Moving Average
DEMA : Double Exponential Moving Average
TMA : Triangular Moving Average
VAR : Variable Index Dynamic Moving Average a.k.a. VIDYA
WWMA : Welles Wilder's Moving Average
ZLEMA : Zero Lag Exponential Moving Average
TSF : True Strength Force
HULL : Hull Moving Average
TILL : Tillson T3 Moving Average
In shorter time frames backtest results shows us TILL, WWMA, VIDYA (VAR) could be used to overcome whipsaws because they have less numbers of signals.
In longer time frames like daily charts WMA, Volume Weighted MACD V2, and MACDAS and SMA are more accurate according to backtest results.
My interpretation of Buff Dormeier's Volume Weighted MACD V2:
Thomas Aspray's MACD: (MACDAS)

[astropark] Rolling VWAP V2 [strategy]Dear Followers,
today I'm glad to present you yet another awesome Analysis Tool and Strategy, that you may like to use in your trading journey: Rolling VWAP V2 !
This is an upgraded version of my "Progressive VWAP" analysis tool (progressive and rolling are synonymous for me), its description describes quite well what a progressive/rolling vwap is and why they are important to watch:
This indicator can print automatically for you many important Rolling VWAPs:
Daily (D)
2 days (2D)
3 days (3D)
4 days (5D)
Weekly (W)
2 weeks (2W)
Monthly (M)
Quarterly (Q)
Yearly (Y)
As an indicator it will let you:
enable/disable each rolling vwap, change its color and line style and thickness
enable/disable labels and/or price on labels, as well as change their size
As a strategy it will let you:
enable/disable buy/sell signals
choose which strategy to use (all based on rolling vwaps of course)
choose a starting date & time from which to start backtesting
enable/disable individually long and short setups in the backtesting
You should choose low timeframe rolling vwap strategy if you are on a low timeframe, while higher timeframe rolling vwaps are good on medium-high timeframes.
For example D-2D-3D rolling vwap strategies are good at 1h or below, the others on higher timeframes. Backtesting results will help you in understanting this point quite easily.
This indicator works on every timeframe, market and pair. By the way it must be said that, as a bot strategy it has been tested and designed mostly for Bitcoin trading and it works best on 1h or above.
As I always say, all tools are great if you use them correctly: this is not the "Holy Grail", so always use proper money and risk management strategies.
This is a premium indicator , so send me a private message in order to get access to this script.

SuperTrend - Custom Screener and Dynamic AlertsTrading View today published a desktop Bad Internet connection indicator ?! which set me thinking…
Despite recently introduced Dynamic Alerts many scripts do not leverage the information available for active traders and traders on the GO!
So decided to share this script totally ALERT focused on one of the most popular DAY trading indicators.
Of course no more BAD internet problem as long your TV APP is configured , you will have enough data for a mental picture of the chart..
The Alerts give you the BAR Close , %percent gain or loss over previous day CLOSE ++ Previous Day High and Low to effectively plan your trade without a chart!(just in case)
2 additions in the way Alerts are delivered over the last script :
1. You get SUMMARY alerts or concatenated alerts by default , however if you uncomment or activate code lines 48 and 55 you will get individual Stock alerts Too!
2. Summary Alerts will come only if there is some Buy or Sell signal NO more empty Alerts!
Few useful EXTRAS in the code :
1. Flexible code can convert any indicator to screener or Alert function.
2. You will NOT get Mutable Variable error while converting any indicator to screener as long as the function is in "GLOBAL" scope..
3. Many Custom Screeners are available but few give OHLC data in output so easily…and very difficult for traders to MODIFY hundreds of lines of code..
4. For UP or DOWN on SCREEN Stock monitoring copy /paste functions in line 41 and 42 in lieu of CROSS functions in 44 and 51 respectively..
5. You can also uncomment/activate lines 66 and 67 for labels in monitoring.
6. The default mode of the scripts is set to Alerts!
Max Stocks only 20!
Finally idea is to help traders to use the great features that TV works so hard to create and constantly improvise.
Enjoy Profitable Trading on the Fly !!

VWMA with kNN Machine Learning: MFI/ADXThis is an experimental strategy that uses a Volume-weighted MA (VWMA) crossing together with Machine Learning kNN filter that uses ADX and MFI to predict, whether the signal is useful. k-nearest neighbours (kNN) is one of the simplest Machine Learning classification algorithms: it puts input parameters in a multidimensional space, and then when a new set of parameters are given, it makes a prediction based on plurality vote of its k neighbours.
Money Flow Index (MFI) is an oscillator similar to RSI, but with volume taken into account. Average Directional Index (ADX) is an indicator of trend strength. By putting them together on two-dimensional space and checking, whether nearby values have indicated a strong uptrend or downtrend, we hope to filter out bad signals from the MA crossing strategy.
This is an experiment, so any feedback would be appreciated. It was tested on BTC/USDT pair on 5 minute timeframe. I am planning to expand this strategy in the future to include more moving averages and filters.

mark strategy2 divergence bot v0.5 for xbtusdHi first of all thanks for read this.
This is my second strategy for make trading, I optimized it for xbtusd with 30 min charts.
You can personalize some setting for reach a better result then me, these are the setting:
this script is only for long trade, so bearish divergence don't work
1)ema1
U can change this value for use another ema and use a faster or slower trend
2)ema2
U can change this value for use another ema and use a faster or slower trend
3)pivot right
U can change this value for watch a number of bar on your right
4)pivot left
U can change this value for watch a number of bar on your left
5)high range
U can change this value for watch a max number of bar
6)low range
U can change this value for watch a min number of bar
7)bullish
U can change this value for enable signal with bullish divergence
8)hidden bullish
U can change this value for enable signal with hidden bullish divergence
9)bearish
U can change this value for enable signal with bearish divergence
10)hidden bearish
U can change this value for enable signal with hidden bearish divergence
11)profit 1 %
U can change this value for the first take profit target
12)profit 2 %
U can change this value for the second take profit target
13)qty target 1 %
U can change this value for close a % of your trade at target 1
14)loss %
U can change this value for close the trade at a % of loss
Have nice day and send me a message if u will earn with my strategy.
If u want my code send me a message
for info send me a message
