SMA, VWAP with Buy/Sell Signals - First Signal OnlyIndicator: SMA, VWAP with First Buy/Sell Signals
Overview:
This indicator plots two Simple Moving Averages (SMA 20 and SMA 200) and the Volume-Weighted Average Price (VWAP) on the chart, with fully customizable colors and line thickness. Additionally, it provides buy and sell signals based on the price action relative to these indicators.
Buy Signal:
A buy signal is generated when a green candle (bullish candle) closes above the SMA 20, SMA 200, and VWAP without touching them (i.e., the low of the candle is above all three). This signal will only be plotted for the first such candle of the day to avoid signal clutter.
Sell Signal:
A sell signal is generated when a candle closes below the SMA 20, SMA 200, and VWAP without touching them (i.e., the high of the candle is below all three). Similar to the buy signal, it will only be plotted for the first qualifying candle of the day.
Customization:
SMAs and VWAP: Users can adjust the lengths, colors, and line thickness of the SMAs and VWAP to suit their preferences.
Signal Shape: You can choose from different shapes (arrow, circle, or cross) to represent the buy and sell signals on the chart.
Key Features:
First Candle Only: Both buy and sell signals are generated only for the first candle that satisfies the conditions, ensuring clean and actionable signals.
Visual Customization: Full control over the appearance of the indicator, including signal shapes and line properties.
Works Across Assets: This indicator is applicable to any asset (stocks, forex, crypto) where price action relative to moving averages and VWAP is important.
Поиск скриптов по запросу "vwap"

VWAP Divergence | Flux ChartsThe VWAP Divergence indicator aims to find divergences between price action and the VWAP indicator. It uses filters to filter out many of the false divergences and alert high quality, accurate signals.
Red dots above the candle represent bearish divergences, while green dots below the candle represent bullish divergences.
The main filter for divergences focuses on ATR and the price movement in the past candles up to the lookback period. Divergences are determined when a price movement over the lookback period is sharp enough to be greater/less than the ATR multiplier multiplied by the ATR.
Settings
Under "Divergence Settings", both the lookback period and ATR multiplier can be adjusted.
Due to the nature of the calculations, the ATR multiplier and the lookback period should be set lower on higher time frames. As price movements become more averaged, for example on the 15 minute chart, sharp price movements happen less frequently and are often contained in fewer candles as they happen on lower time frames. Less volatile stocks such as KO, CL, or BAC should also use lower ATR multipliers and lower lookback periods.
Under "Visual Settings", you can change the color of the VWAP line, show alternating VWAP colors, adjust divergence signal size, and show the VWAP line.

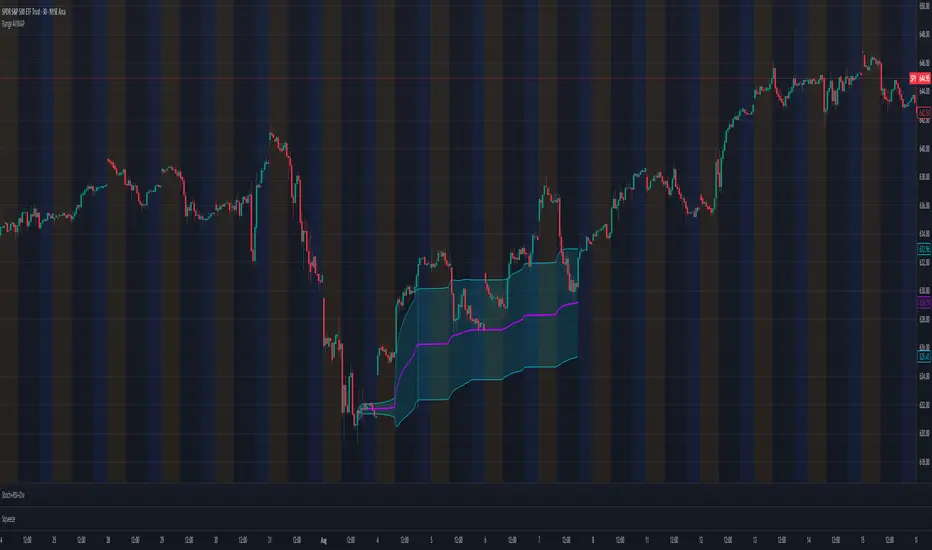
VWAP BANDS [qrsq]Description
This indicator is used to find support and resistance utilizing both buying and selling volume. It can be used on lower and higher time frames to understand where price is likely to reject or bounce.
How it works
Instead of calculating the VWAP using the total volume, this script estimates the buying/selling volume and respectively calculates their individual VWAP's. The standard deviations of these are then calculated to create the set of two bands. The top bands being the VWAP from buying volume and bottom bands are from selling volume, with the option to use a double band on either pair.
How to use it
I like to use the bands for LTF scalping as well as HTF swings, I also like to use it alongside my SMA VWAP BANDS.
For scalping:
I tend to use either the 5m or 15m TF
I then set the indicator's TF to 1m
I will take a scalp based on the bands confluence with other PA methods, if price is being either supported or rejected.
For swings:
I tend to use a variety of TFs, including: 30m, 1H, 4H, D
I then set the indicator's TF to "Chart"
I will take a swing based on the bands confluence with other PA methods, if price is being either supported or rejected.
I also tend to use them on perpetual contracts as the volume seems to be more consistent and hence results in more accurate support and resistance.

Whale VWAP HeatmapWhat it does
This indicator paints a heatmap around an anchored VWAP to make market context obvious at a glance.
Above VWAP → cyan background
Below VWAP → amber background
The farther price is from VWAP (in %), the stronger the color intensity.
How it works
Uses an anchored VWAP that resets on the period you choose (Session / Week / Month / Quarter / Year / Decade / Century / Earnings / Dividends / Splits).
Computes the percentage distance between price and VWAP, then maps that distance to background opacity.
Optional VWAP line can be shown/hidden.
Inputs (Settings)
Anchor Period — choose when VWAP resets (Session→Year, plus E/D/S options).
Source — price source (default hlc3).
Hide on D/W/M (Session only) — hides the script on Daily/Weekly/Monthly when anchor=Session (avoids NA behavior).
Enable Heatmap — turn background coloring on/off.
Max distance for full color (%) — at/above this % from VWAP, color hits full intensity (typical 0.5–2% depending on volatility).
Show VWAP Line / Line Color/Width — visual preference.
How to read it (quick playbook)
Context first: color tells you if price is trading above/below “fair value” (VWAP).
Intensity = how stretched price is from VWAP.
Use it to frame bias (above/below VWAP) and to avoid chasing extended moves.
Notes & limitations
Requires volume (VWAP is volume-weighted). If the data vendor doesn’t provide volume for the symbol, the script will stop.
For intraday, Session anchor is common. For swing/context, try Week or Month.

4 Anchored VWAPs This indicator shows 4 periods of Anchored VWAPs according to specific dates the user chose.

Stock_Cloud-EMA,VWAP,ST Indicator_V1Stock_Cloud V1 - EMA, VWAP, SuperTrend Strategy Indicator
This indicator combines three powerful technical indicators (EMA, VWAP, and SuperTrend) to create a comprehensive trading system that helps identify high-probability trading setups when all components align.
Strategy Components & Logic:
• EMA (Exponential Moving Average): Acts as a dynamic support/resistance and trend direction indicator
• VWAP (Volume Weighted Average Price): Provides important institutional price levels and volume-based trend strength
• SuperTrend: Offers trend direction and potential reversal points
Why These Components Work Together:
1. EMA filters out market noise while maintaining responsiveness to price changes
2. VWAP adds volume-based price validation, especially useful for intraday trading
3. SuperTrend confirms trend direction and potential reversal points
4. When all three indicators align, it creates a high-probability setup
Signal Generation:
• Bullish Signal: Generated when price crosses above all three indicators (EMA, VWAP, and SuperTrend turns bullish)
• Bearish Signal: Generated when price crosses below all three indicators (EMA, VWAP, and SuperTrend turns bearish)
• Background color changes help visualize the current market condition
Settings:
- EMA Length: 20 (default, adjustable)
- SuperTrend Period: 10 (default, adjustable)
- SuperTrend Multiplier: 3.0 (default, adjustable)
How to Use:
1. Look for potential entries when all three indicators align
2. Small triangles mark key entry points when alignment occurs
3. Use background color as additional confirmation
4. Monitor price action relative to all three indicators for exit signals
Best Timeframes:
Works well on all timeframes, but particularly effective on 5-minute to daily charts for stocks and indices.
Note: This indicator combines traditional technical analysis tools in a unique way to provide clear, actionable signals. Always use proper risk management and consider other factors like market conditions and support/resistance levels.
Created by Stock_Cloud
Version 2.0

VWAP (Any Anchor)Hello Traders,
Introduction:
The Volume Weighted Average Price (VWAP) is a powerful trading indicator used to gauge the average price at which an asset has traded, weighted by volume, over a specific period.
One of the key factors that can significantly impact the effectiveness of VWAP is the concept of "anchoring." In this TradingView indicator script description, we'll explore the concept of anchoring and how it's integrated into a customizable VWAP indicator.
Understanding Anchoring:
Anchoring in VWAP refers to selecting a specific point in time from which the VWAP calculation begins.
This "anchor point" serves as the starting reference for VWAP, and it can substantially impact the indicator's behavior and interpretation.
Anchoring allows traders to adapt VWAP to different trading strategies and scenarios.
Here are some common anchor points used in the script and their significance:
1. Time-Based Anchors: Traders often anchor VWAP to specific times of the trading day, such as the market open (e.g., 9:30 am EST) or close (e.g., 4:00 pm EST).
You could add in the script any time-based anchor you think is relevant for your trading.
2. Event-Based Anchors: Anchoring can also be based on specific market events.
For example, some traders anchor VWAP to events like "3 Consecutive Green Candles" or "Supertrend" direction changes.
Feel free to adapt the script here and add the relevant events-based anchor for your trading.
3. Multi-Timeframe Anchoring: Traders can anchor VWAP on different timeframes, allowing them to analyze price and volume interactions across various horizons.
This flexibility is especially valuable for swing traders adapting to longer-term trends.
Anchor Selection
Traders can choose from various anchor points, including time-based, event-based, and even an "External Connector" for flexibility in adapting VWAP to specific scenarios.
The External connector is the output from another script used in this VWAP script.
Your script may have a condition being “true” whenever a signal is printed - you can use this signal as the anchor for the VWAP.
Conclusion:
Understanding anchoring in VWAP is essential for traders using this indicator effectively.
Choosing and customizing anchor points empowers traders to adapt VWAP to their specific trading styles and strategies.
Whether focused on intraday precision or analyzing longer-term trends, a customizable VWAP indicator with flexible anchoring options can be valuable to your trading toolkit.
Tailor your VWAP to your unique needs and gain deeper insights into market trends and price action.
Made with love
Dave

VWAP + 2 Moving Averages + RSI + Buy and SellIndicator: VWAP + 2 Moving Averages + RSI + Buy and Sell
Buy and Sell Arrows (Great for use alone or in conjunction with other scripts on the chart)
This indicator displays BUY (BUY) and SELL (SELL) arrows on the chart based on a combination of moving averages, VWAP and RSI. Arrows are a visual way to identify trading opportunities and can be useful for traders who want to follow a strategy based on these conditions.
The indicator uses two moving averages (20 and 50 periods) to identify upward crosses (buy) and downward crosses (sell). In addition, it takes into account VWAP (Volume Weighted Average Price) and RSI (Relative Strength Index) as additional filters to confirm buy and sell signals.
This script is great for use both independently and in conjunction with other indicators and strategies. You can combine it with other indicators and customize it to your preferences to create a more comprehensive trading strategy.
Please remember that this indicator is provided for educational purposes only and does not constitute financial advice. It is always recommended to carry out a thorough analysis before making any trading decisions.
Give this indicator a try and enjoy clear visualization of buy and sell arrows on your chart. Happy trading!

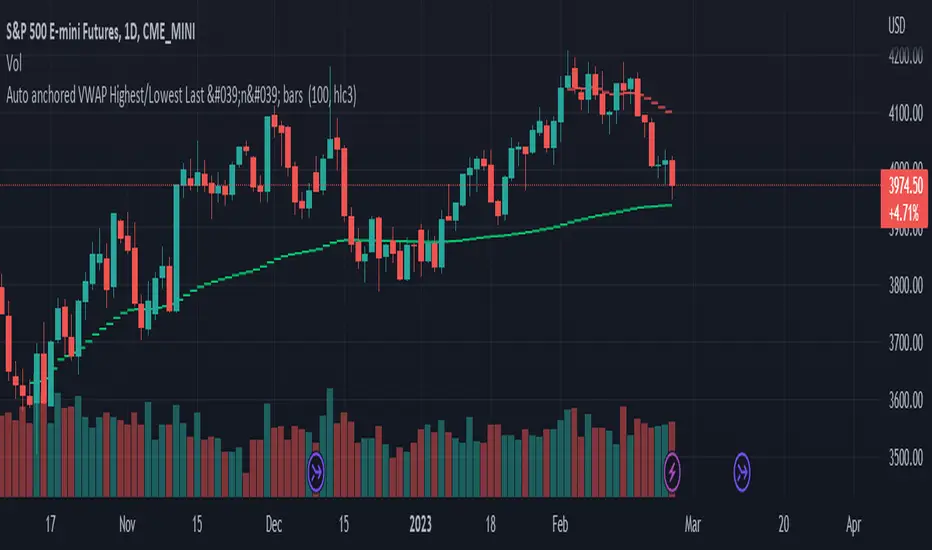
Auto anchored VWAP Highest/Lowest Last 'n' bars The VWAP (Volume Weighted Average Price) indicator is used to calculate the average price weighted by volume. This indicator is designed to automatically draw VWAPs from the highest and lowest points of the last 'n' bars.
It utilizes arrays to calculate the values of VWAP and plot it on the chart on the last historical bar. This version was coded to get a similar version to the official "VWAP Auto anchored" with the highest/lowest selected settings.
To use VWAP, traders can look for price movements relative to the VWAP line to identify potential support or resistance levels. It can also be used in conjunction with other technical indicators to develop trading strategies.
VWAP 3x Session Reset- This VWAP aims to be used with futures and forex.
- The VWAP is reset at the beginning of each session.
- 3 different sessions can be specified.
- The lines are not drawn when there is no active session.
- The upper and lower bands with standard deviation 2 are also drawn.
Info: The time zone of the picture is Europe/Berlin

VWAP Boulevard [vnhilton](OVERVIEW)
The idea of this indicator comes from traders identifying supply to mainly look for shorts. Scenarios would be gap ups or pump & dumps where huge volume is transacted, & bag-holders are present. Some traders would draw resistance lines, I myself used to draw supply zones using the volume profile on that day, & others used the day VWAP on those days. VWAP Boulevard (I believe the name comes from the trader named team3dstocks) draws day VWAP lines from the highest volume days for a given period (excluding the current day).
(FEATURES)
- Draws horizontal & vertical lines from up to 250 highest volume days out of up to 3568 days, with the ability to hide either of these lines, their thicknesses, styles
- Extend/cut horizontal lines, or extend them all the way to the right
- Show the day VWAP, volume & age for these days in labels, with the ability to show what information you want to see only
- Separate customizable color forms for the lines & labels - ordinary (1 color); volume (2 color gradient from lowest to highest volume of the highest volume days); age (2 color gradient from youngest to oldest volume of the highest volume days)
- Edit offset & size of labels, & hide them
- Hide vertical lines
From left to right: Age color; ordinary color; volume color
250 highest volume days in the past year. Very messy so it's very likely you won't be using this but the ability to draw lines from 250 highest volume days is there if needed
(DRAWDOWNS)
- This indicator will only on the daily timeframe (error message will show up if unaware of this, & can be toggled off). Unfortunately, this would mean you would have to draw the lines manually yourself if you wish to use them on intraday timeframes.
- You may also encounter the 'Pine cannot determine the referencing length of a series. Try using max_bars_back' error. This occurs when the lookback period is very high & the indicator attempts to recalculate I believe. If this happens then reload the indicator.
The logic I used to obtain the highest volume days were to put all of the volume days in a given period in 1 array, then to sort them from highest to lowest, & also store their sorted indices in an separate array as well, so that drawings for each volume day could be done from the 2 arrays.
//Volume for last N periods
var int pastVol = array.new_int(lookbackPeriodFixed)
for i = 0 to lookbackPeriodFixed - 1
array.set(pastVol, i, int(volume ))
sortedIndices = array.sort_indices(pastVol, order.descending) //All Indices of sorted volume from highest to lowest
sortedIndices2 = array.slice(sortedIndices, 0, highestVolDays) //Indices of sorted volume from highest to lowest
array.sort(pastVol, order.descending) //All Volume sorted from highest to lowest
pastVol2 = array.slice(pastVol, 0, highestVolDays) //Volume sorted from highest to lowest
//Drawings
for i = 0 to highestVolDays - 1
index := array.get(sortedIndices, i)
vol := array.get(pastVol, i)
Since these array sizes were determined from the lookback period, it would mean that the request.security() function used to obtain daily values on intraday timeframes wouldn't work for a lookback period >20 (20 * 2 values I believe, which are the day VWAP & the day volume) as TradingView has put a maximum amount of calls of 40 in 1 script. Therefore, for intraday plots to work I would have to change the logic for getting the day VWAP & day volume for the highest days, as the request.security() function doesn't work on for loops, & this would also mean that the user would only be able to draw lines from up to 20 highest volume days instead of 250. I couldn't go forward with this as I wasn't able to find the logic to pick the highest volume days & their day VWAPs & times (indexes) without using a for loop. If anyone has any solutions (including for the 'Pine cannot determine the referencing length of a series. Try using max_bars_back' error) then please let me know. I've also left commented-out code for dealing with intraday drawings for future use.

VWAP From Pivots Lows and Highs
This script starts automatically VWAP from pivot lows and highs.
Parameter allows you to enable up to 3 VWAP (default).
If you use 3, the VWAP from the last three pivots point will be drawn.
If you use 1, just the last pivot point will be used.
You can also just enable VWAPs starting from pivot lows or highs.
Let me know if there are any problems.

Futures Playbook: VWAP + OR + Cross-Asset TellsFutures Playbook: VWAP + OR + Cross-Asset Tells (with Trade Messages + Coach Panel)
This all-in-one futures trading toolkit combines Opening Range (OR) levels, VWAP, and cross-asset signals to help traders quickly read intraday structure, manage execution, and filter noise.
Core Features
• Opening Range (OR):
• Customizable OR window with High/Low and Midpoint.
• Automatic shading of the OR zone.
• VWAP & Bands:
• Built-in or session-anchored VWAP.
• Optional standard deviation bands for context.
• Cross-Asset Tells:
• Live reads on US 10Y yield, DXY, Crude, and Gold.
• Regime detection: rates risk, USD strength, energy softness, and real-rate easing.
• Confirmations:
• Volume vs. moving average filter.
• Cumulative delta with smoothing.
• ATR-based chop filter to avoid low-quality trends.
Trade Messages + Coach Panel
• Trade Messages (labels): Automatic on-chart prompts for OR completion, VWAP reclaim/loss, long/short setups, and EU close flows.
• Coach Panel (table): Real-time dashboard with regime context, directional bias, execution notes, risk reminders, and key levels (ORH, ORL, VWAP).
Alerts
• OR breakout (long/short with confirmations).
• VWAP reclaim or loss.
• 10Y yield crossing risk threshold.
Use Case
Designed for futures traders and scalpers who rely on VWAP + OR dynamics and need cross-asset confirmation before committing to trades. Great for structuring entries, managing risk, and filtering market noise throughout the session.

(Fixed-Range) Anchored VWAPThis "Fixed-Range Anchored VWAP" indicator allows traders full control over where the VWAP calculation begins and ends. VWAP combines both price and volume to reflect the true average price paid, often serving as a benchmark for gauging value, sentiment, and trend strength.
With this tool, traders can anchor VWAP to any candle, optionally define an end point, or keep it running forward with a single toggle. Up to three bands can be added around VWAP, either as standard deviations or percentage offsets.
How to Use
The indicator is particularly useful for analyzing VWAP around significant events, like earnings announcements or sharp price swings, to identify support, resistance, and mean-reversion opportunities.
Add the indicator and select a candle to set the Anchor.
Choose an End point or enable Cancel End for an open-ended VWAP.
Pick Std Dev or Percent for band mode.
Turn on up to three bands, adjust multipliers, and set fill colors.
Use VWAP and its bands to evaluate extensions, trend context, and fair value zones.
Rolling Multiday VWAPCouldn't find a VWAP script that worked the way I needed so I created this one. Basically, it provides a multiday rolling VWAP. I made the rolling period configurable, but I primarily use it to add a 2 day VWAP to my chart alongside the standard VWAP indicator. This unique thing that this indicator does is dynamically anchor to the configured period, but starting from today backwards.
Basically, this indicator ensures VWAP never anchors to the current day, but instead always shows a 2 day VWAP on today's charts. The problem I had with other indicators is that every other day my 2 day VWAP indicator would anchor to the current day and essentially become a redundant standard VWAP indicator.
Hope to update in the future to dynamically update based the chart day you have in focus, but will need some time to figure out if that's even possible.

VWAP + Range Breakout (Pre-Signal for Manual Entry)WHAT IT DOES
This tool highlights potential breakout opportunities when price sweeps the previous day’s high or low and aligns with VWAP and short-term range levels. It provides both pre-signals (early warnings) and confirmed signals (breakout closed) so traders can prepare before momentum accelerates.
Works on all timeframes and across markets (indices, forex, crypto). Especially useful during active London and New York sessions.
---
KEY FEATURES
Daily sweep logic: previous day high/low as liquidity reference
VWAP with cumulative calculation
Adjustable range breakout levels
Optional SMA trend filter
Session filter (London / NY trading hours)
Pre-Signal markers (early alert before breakout)
Confirmed LONG/SHORT signals after breakout close
Alerts for Pre-Long, Pre-Short, and Confirmed entries
---
HOW TO USE
1. Wait for price to sweep the previous day high/low.
2. Look for alignment with VWAP and the defined range breakout levels.
3. Use trend/session filters for higher accuracy.
4. Combine with your own risk management rules.
---
SETTINGS TIPS
Adjust range lookback for different timeframes (shorter for fast intraday, longer for higher timeframes).
Enable/disable session filters depending on your market.
Use SMA trend filter to stay aligned with higher-timeframe bias.
---
WHO IT’S FOR
Scalpers, intraday, and swing traders who want early signals when liquidity is taken and price is preparing for a breakout.
---
NOTES
For educational purposes only. No financial advice.
This script is open-source; redistribution follows TradingView rules.

Aggregated Rolling VWAP +Edit of TradingView's original Rolling VWAP
Edit log:
Added Volume Aggregation Capabilities to the Script
- Price Action is impacted by volume executed in all exchanges. Even though a single exchange RVWAP can be useful, using aggregated data makes it more accurate and saves time in symbol switching.
- Aggregation is preset to be done for Bitcoin Spot Pairs. However this can be changed to Aggregate Volume from any other symbol at the bottom of the setup menu.
Added Symmetrical Deviations to the Script
- Symmetrical deviations create range of "tolerance" around the RVWAP at a fixed % distance. This helps in situations when price does not respect the exact RVWAP level and goes slightly above/under.
- Adding multiple Symmetrical Deviations at different percentage values can give relevant levels for scalping, entries and range trading.
Switched default option to manual TF instead of automatic TF
Added TF Presets for quick switching between different settings. (Feature intended for mobile charting)
Added ON/OFF Switch to all individual deviations to make it easier, faster and cleaner to display different data. (Feature intended for mobile charting)
Multiple Non-Anchored VWAPA lot of VWAP scripts are anchored and only allow single VWAP additions. This script allows up to 5 simultaneous VWAPs, for example monthly, quarterly, yearly, 3 years, etc. Can also be used on smaller timeframes. The non-anchored part of the script allows it to be constantly rolling, with no resets.
I do not endorse this script, it was created at my request :)
Donchian Anchored Vwap + HandoffsIn this script I try to incorporate Brian Shannon's Anchored VWAP hand off system into an automated initial anchoring system using Donchian Highs and Lows.
I have also added an average of all the hand-off vwaps.
Higher values in "Donchain Lookback" will display longer term sentiment and vice versa.
*Credit to trader dysrupt for their 'Anchored VWAP Hand-off' script
VWAP + Multi-Timeframe RSI StrategyThis strategy combines VWAP trend direction with confirmation from RSI on a higher timeframe. The idea is to only take trades when both intraday momentum and higher-timeframe trend are aligned, increasing accuracy.
LONG Entry:
Price above VWAP (bullish environment).
RSI on the current timeframe is below overbought (room to rise).
RSI on the higher timeframe (default H1) is above 50 (bullish confirmation).
SHORT Entry:
Price below VWAP (bearish environment).
RSI on the current timeframe is above oversold (room to fall).
RSI on the higher timeframe is below 50 (bearish confirmation).
Exit Rule:
Stop-loss near VWAP.
Take-profit at ~2x risk or when major levels are reached.
Best Timeframes:
Use 15m or 30m chart with H1 RSI for intraday trading.
Use 1H chart with Daily RSI for swing trading.
⚡ The higher-timeframe RSI filter reduces false signals and aligns trades with institutional flow.

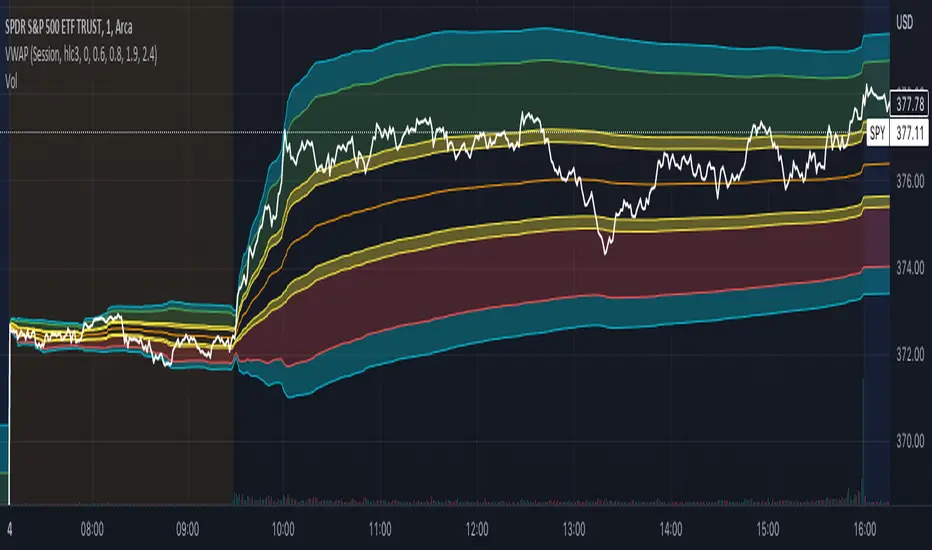
VWAP with Prev. Session BandsVWAP with Prev. Session Bands is an advanced indicator based on TradingView’s original VWAP. It adds configurable standard deviation or percentage-based bands, both for the current and previous session. You can anchor the VWAP to various timeframes or events (like Sessions, Weeks, Months, Earnings, etc.) and selectively show up to three bands.
The unique feature of this script is the ability to display the VWAP and bands from the previous session, helping traders visualize mean reversion levels or historical volatility ranges.
Built on top of the official TradingView VWAP implementation, this version provides enhanced flexibility and visual clarity for intraday and swing traders alike.

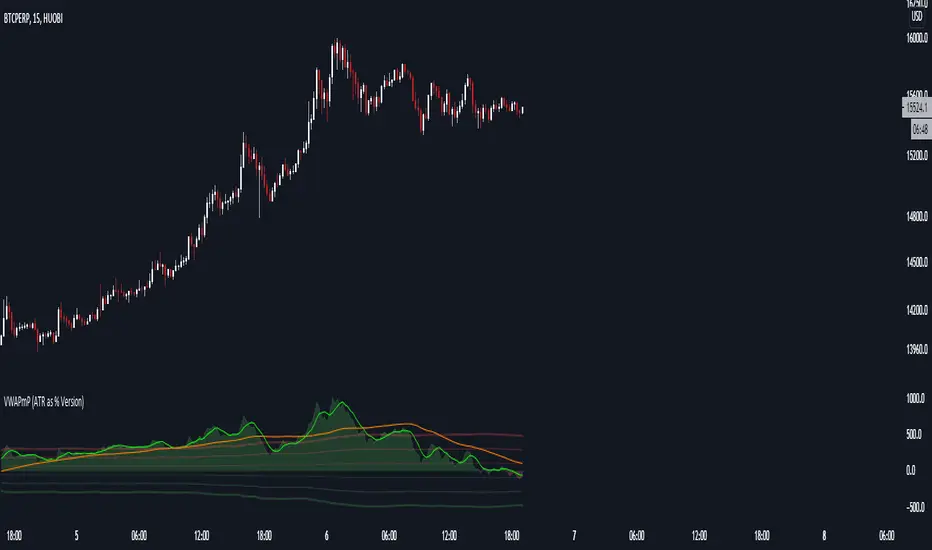
VWAPmP (ATR as % Version)This indicator displays a histogram for the distance of closing price from a VWAP value. The VWAP length is rolling and its value is user defined. Additionally, there are 3 bands which are based on the %-value of the underlying ATR. The ATR's length can be chosen by the user, and the distance multipliers may also be chosen. Lastly, there are two simple moving averages which have user-defined lengths and are based on the histograms value.