Sweep + Cement Candle Coloring with EMA hopdcCertainly! Here's an introduction for the indicator:
---
## Introduction to the Sweep + Cement Candle Coloring with EMA Indicator
The **Sweep + Cement Candle Coloring with EMA Indicator** is a powerful tool designed to enhance your technical analysis and trading strategies. This indicator combines the unique characteristics of Sweep and Cement candle patterns with the dynamic capabilities of Exponential Moving Averages (EMAs), providing traders with insightful signals for potential market movements.
### Key Features:
1. **Candle Coloring**:
- **Sweep + Cement Bullish Candles**: Highlighted in teal when the low of the current candle is lower than the previous candle, and the close is above the previous high. This indicates potential bullish momentum.
- **Sweep + Cement Bearish Candles**: Marked in red when the high of the current candle is higher than the previous candle, and the close is below the previous low, signaling possible bearish pressure.
2. **Exponential Moving Averages (EMAs)**:
- **EMA 0 (Default Length: 9)**: Provides short-term trend direction.
- **EMA 1 (Default Length: 21)** and **EMA 2 (Default Length: 50)**: Offer insights into medium and long-term trends.
- Customizable settings allow traders to adjust EMA lengths and colors based on their preferences.
3. **Trading Signals**:
- **Buy Signal**: Triggered when a bullish Sweep + Cement candle forms, EMA 1 is above EMA 2, and the price closes above all EMAs.
- **Sell Signal**: Activated with a bearish Sweep + Cement candle, EMA 1 below EMA 2, and the price closes below all EMAs.
- Visual arrows on the chart indicate buy and sell opportunities.
4. **Alerts**:
- Configurable alerts notify traders when the price touches any of the EMAs, ensuring you never miss critical levels.
- Alerts for buy and sell signals keep you informed of potential entries and exits.
### How It Benefits Traders:
This indicator is ideal for traders looking to identify and capitalize on market reversals and trend continuations. By integrating candle patterns with EMA analysis, it provides a comprehensive view of market dynamics, making it easier to spot high-probability trading opportunities.
Whether you are a beginner or an experienced trader, the Sweep + Cement Candle Coloring with EMA Indicator can be a valuable addition to your trading toolkit, helping you make informed decisions with confidence.
---
Feel free to adjust the content to better fit your audience or specific use case!
Поиск скриптов по запросу "wave"

High and Retracement Finder
This Pine Script indicator, titled "High and Retracement Finder," is designed to identify significant highs and lows on a price chart based on a user-defined starting point and retracement threshold. It begins analysis from a manually set bar index and tracks the highest high until the price retraces by a specified percentage (retracement threshold). Once this retracement occurs, it switches focus to finding the lowest low. If the price surpasses the previous high during this phase, the cycle resets, and the script resumes tracking a new highest high. The script visually marks these significant highs and lows with arrows on the chart, helping traders identify potential turning points or retracements in the market.

Boost Candle Indicator by JulianThe Boost Candle Trading Indicator is designed to identify significant price movements by calculating the average candle size for the same direction candles (green for bullish and red for bearish) over a specified number of periods. It then highlights candles that exceed a predefined multiple of this average size, indicating potential strong buying or selling pressure.
Key Features:
Directional Average Calculation: Calculates the average size of the previous candles in the same direction (green for buy signals and red for sell signals), ensuring the boost signal is contextually relevant.
Boost Multiplier: Allows customization of the multiplier to define what constitutes a boost candle, providing flexibility in detecting varying levels of price movement intensity.
Proximity to Moving Average: Integrates a proximity check to the moving average (MA), ensuring that boost candles are identified in context with the overall market trend.
Buy and Sell Signals:
Buy Signal: Triggered when a significant green boost candle appears below the moving average and closes above it, indicating a strong bullish movement.
Sell Signal: Triggered when a significant red boost candle appears above the moving average and closes below it, indicating a strong bearish movement.
Customizable Inputs:
Moving Average Length: Adjust the length of the moving average to suit different trading strategies.
Number of Periods for Average Candle Size: Define the lookback period for calculating the average candle size.
Boost Multiplier and Proximity Tolerance: Fine-tune the sensitivity of the indicator to suit different market conditions.
How to Use:
Buy Signals: Look for green labels ("B") below significant bullish candles, indicating a potential upward price movement.
Sell Signals: Look for red labels ("S") above significant bearish candles, indicating a potential downward price movement.
Proximity to Moving Average: Use the proximity tolerance setting to filter out signals that are not closely aligned with the moving average trend.
This indicator is ideal for traders looking to identify strong market movements and align their trades with significant price actions. Customize the settings to fit your trading style and enhance your market analysis.


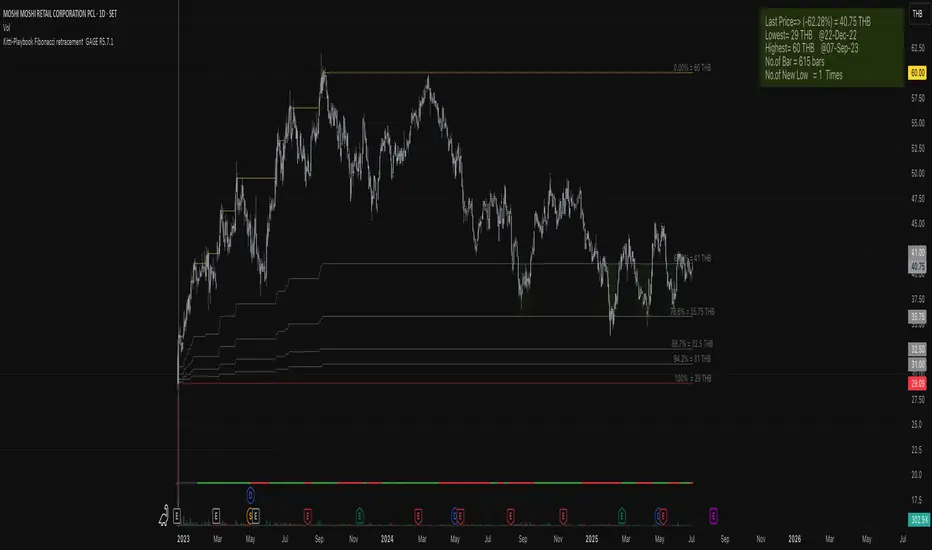
Kitti-Playbook Fibonacci retracement GAGE R0.00
Release Notes: Oct 25 2021
OVERVIEW :Kitti-Playbook Fibonacci retracement GAGE R0.00
Easy for visualize Fibonacci retracement level
CONCEPTS
1)Minimum Line = Lowest level of Source form start
2)Maximum Line = Highest level of Source form New Low
3)Calculation
a) Fibonacci Retracement of 61.8% form Maximum level
b) Fibonacci Retracement of 78.6% form Maximum level
c) Fibonacci Retracement of 88.7% form Maximum level
d) Fibonacci Retracement of 94.2% form Maximum level
4)Information Display
a) Information Bar show Number of New Low , Max level , Min Level , Last Bar No, Current Pricel
b) GAGE Scale Number
c) New Low
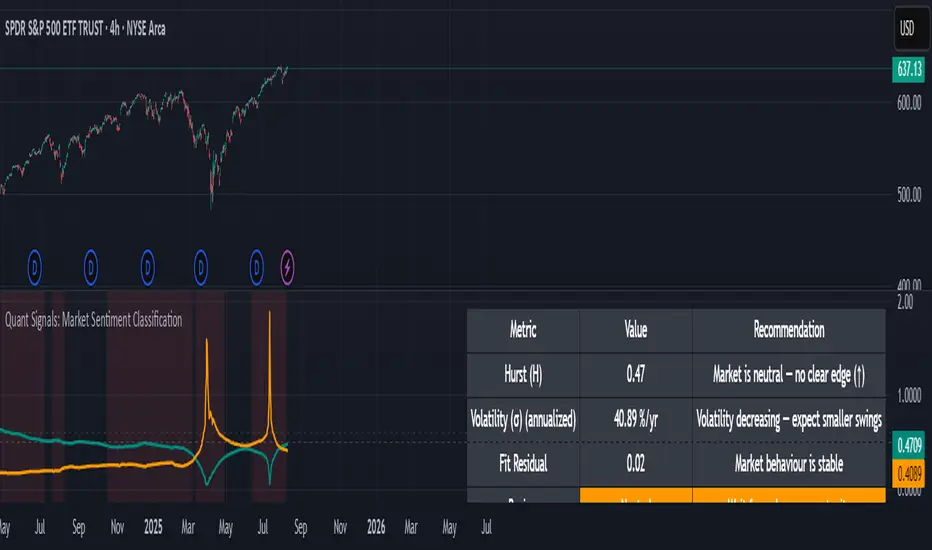
Quant Signals: Market Sentiment Monitor HUDWavelets & Scale Spectrum
This indicator is ideal for traders who adapt their strategy to market conditions — such as swing traders, intraday traders, and system developers.
Trend-followers can use it to confirm trending conditions before entering.
Mean-reversion traders can spot choppy markets where reversals are more likely.
Risk managers can monitor volatility shifts and regime changes to adjust position size or pause trading.
It works best as a market context filter — telling you the “weather” before you decide on the trade.
Wavelets are like tiny “measuring rulers” for price changes. Instead of looking at the whole chart at once, a wavelet looks at differences in price over a specific time scale — for example, 2 bars, 4 bars, 8 bars, and so on.
The scale spectrum is what you get when you measure volatility at several of these scales and then plot them against scale size.
If the spectrum forms a straight line on a log–log chart, it means price changes follow a consistent pattern across time scales (a power-law relationship).
The slope of that line gives the Hurst exponent (H) — telling you whether moves tend to persist (trend) or reverse (mean-revert).
The height of the line gives you the volatility (σ) — the average size of moves.
This approach works like a microscope, revealing whether the market’s behaviour is consistent across short-term and long-term horizons, and when that behaviour changes.
This tool applies a wavelet-based scale-spectrum analysis to price data to estimate three key market state measures inside a rolling window:
Hurst exponent (H) — measures persistence in price moves:
H > ~0.55 → market is trending (moves tend to continue).
H < ~0.45 → market is choppy/mean-reverting (moves tend to reverse).
Values near 0.5 indicate a neutral, random-walk-like regime.
Volatility (σ) — the average size of price swings at your chart’s timeframe, optionally annualized. Rising volatility means larger price moves, falling volatility means smaller moves.
Fit residual — how well the observed multi-scale volatility fits a clean power-law line. Low residual = stable behaviour; high residual = structural change (possible regime shift).
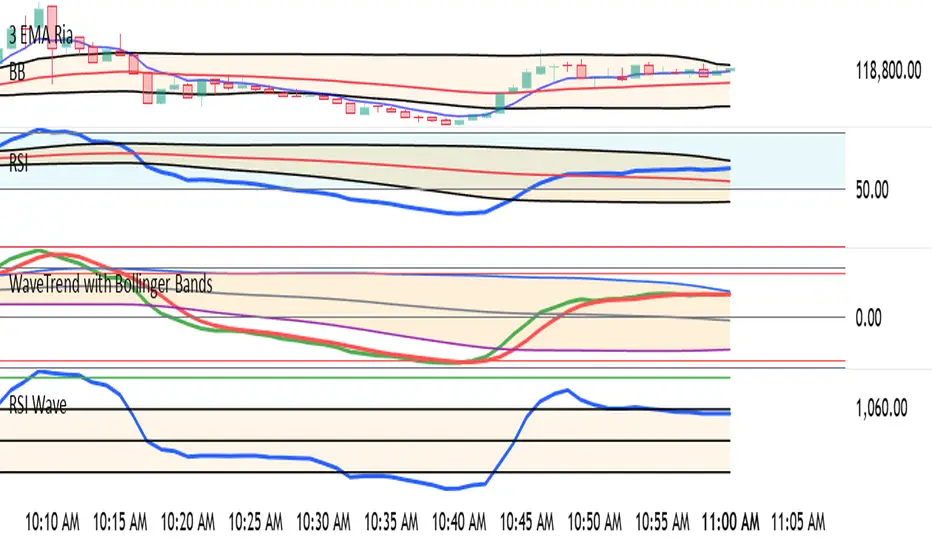
WaveTrend with Bollinger BandsPlots TTM Squeeze momentum histogram (green/red).
Plots RSI (blue) in the same pane.
Shows squeeze dots and RSI overbought/oversold lines.
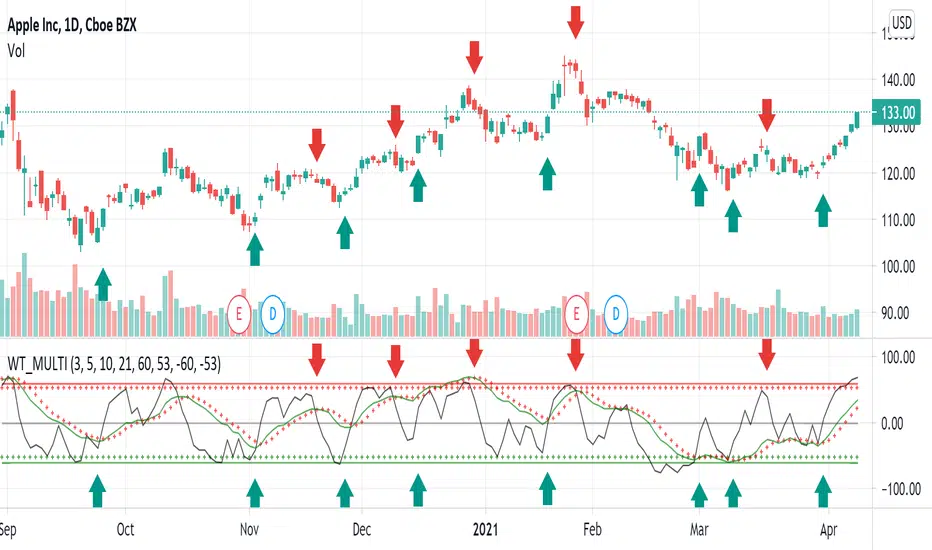
WaveTrend MultiEMAThis is a modification of LazyBear's WaveTrend. The SMA trend has been removed and a shorter time frame EMA has been added in black. The idea is to buy when the shorter time frame starts to curl up and the longer time frame, green, has started to either flatten out or curl up too. Sell when the shorter time frame has started down and green has either flattened or bottomed out as well. The black line will generate some noise so the key is to use the two in combination. My final goal would be to have the green line looking at daily candles and the black line looking at a 2 or 4 hour candle, but I haven't figured out how to do that.
WaveTrend with Crosses and Alerts - Jab ZootaLazy bear created this script. I added alertconditions to send alerts on crossovers.

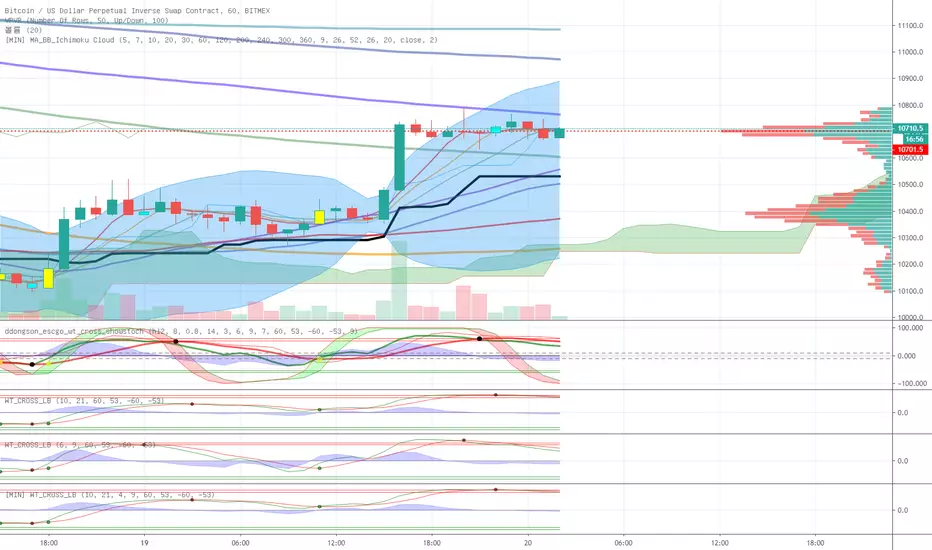
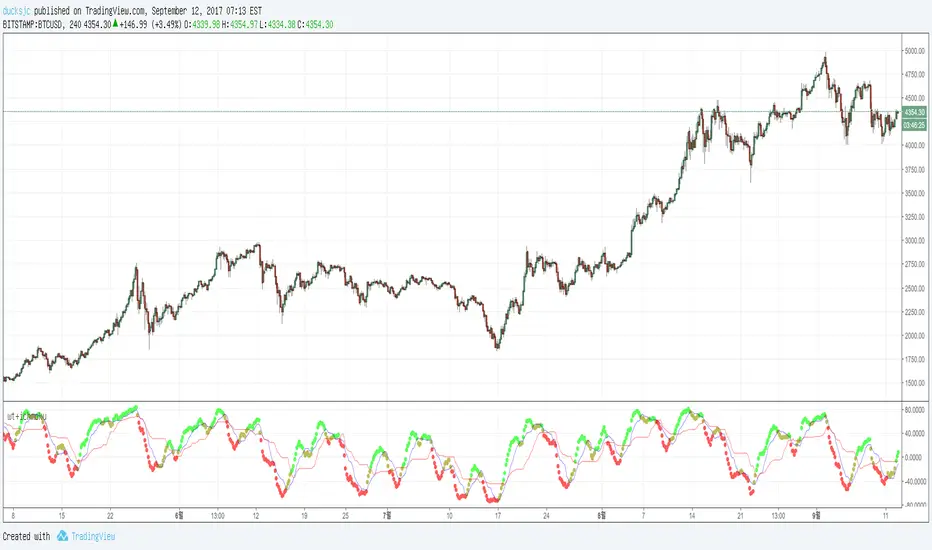
wt+ichmokuwaveTrend is very very very nice script.
and i also like ichmoku
yesterday 'nssoholik' gave me some idea that is rsi+ichmoku
and this is wt+ichmoku
easily
red to green = buy
green to red = sell
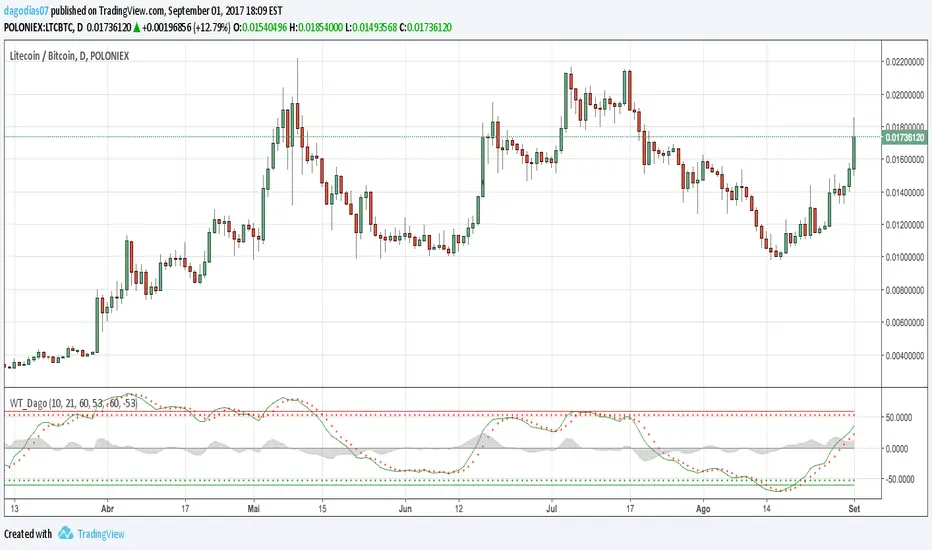
WaveTrend [DagoDias]@author LazyBear -- Modificado por Dagodias adicionado títulos às variáveis e traduzido para o Português.
Através dos títulos fica melhor para customizar o indicador e criar alertas a partir do indicador.
Para utilização em Criptomoedas acredito ser interessante suavemente levantar as linhas base; tornando a área de sobre venda antecipada.
Este indicador não é recomendado para fortes tendências.
WaveTrend [MastroFran]Great indicator to show short term price movements. 5 day moving average oscillator. When green crosses red and under the 60 mark, buy with caution. when over the 60 mark and red crosses green sell immediately for highest profits.

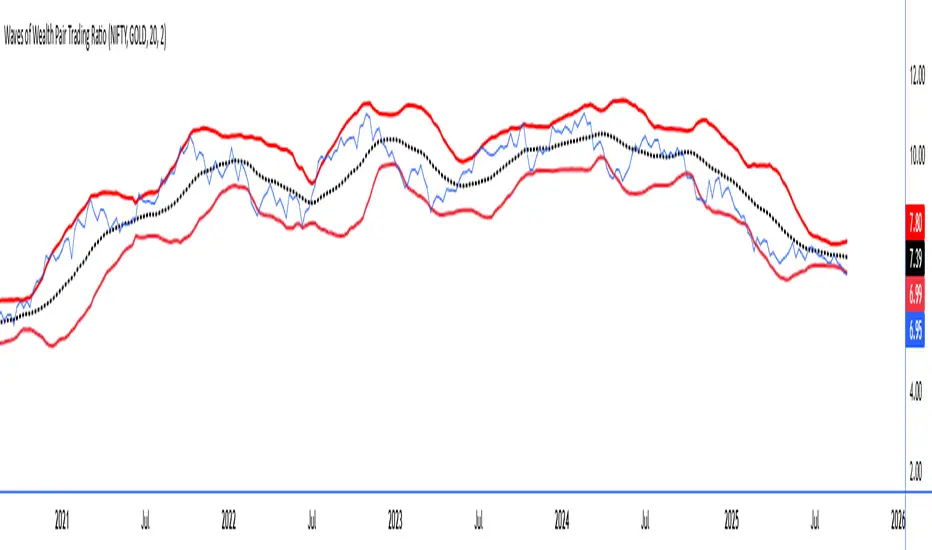
Waves of Wealth Pair Trading RatioThis versatile indicator dynamically plots the ratio between two user-selected instruments, helping traders visualize relative performance and detect potential mean-reversion or trend continuation opportunities.
Features include:
User inputs for selecting any two instrument symbols for comparison.
Adjustable moving average period to track the average ratio over time.
Customizable standard deviation multiplier to define statistical bands for overbought and oversold conditions.
Visual display of the ratio line alongside upper and lower bands for clear trading signals.
Ideal for pair traders and market analysts seeking a flexible tool to monitor inter-asset relationships and exploit deviations from historical norms.
Simply set your preferred symbols and parameters to tailor the indicator to your trading style and assets of interest.
How to Use the Custom Pair Trading Ratio Indicator
Select symbols: Use the indicator inputs to set any two instruments you want to compare—stocks, commodities, ETFs, or indices. No coding needed, just type or select from the dropdown.
Adjust parameters: Customize the moving average length to suit your trading timeframe and style. The standard deviation multiplier lets you control sensitivity—higher values mean wider bands, capturing only larger deviations.
Interpret the chart:
The ratio line shows relative strength between the two instruments.
The middle line represents the average ratio (mean).
The upper and lower bands indicate statistical extremes where price action is usually overextended.
Trading signals:
Look to enter pair trades when the ratio moves outside the bands—expecting a return to the mean.
Use the bands and mean to set stop-loss and profit targets.
Combine with other analysis or fundamental insight for best results.

Wave Trend Arrows [Salty]This is just like WT_LB, but with arrows that increase in size to show cross over points. The larger down arrows indicate resistance for overbought levels, and the larger up arrows indicate support for oversold levels.


Smart Signals [Vdubus]Smart Signals
Concept & Philosophy
Smart Signals is a "Regime-Filtered" oscillator designed to solve the biggest problem with standard indicators: Counter-trend noise.
Most oscillators (like Stochastic or RSI) are "dumb" to market context—they will signal "Sell" continuously during a strong uptrend simply because the price is high. Smart Signals fixes this by first determining the Market Regime (Bullish or Bearish) and then strictly filtering out any signal that contradicts that trend.
It creates a "Tiered" trading system that separates standard trend-following entries from high-probability "Sniper" entries (Hidden Divergence), all presented in a clean, color-blind-friendly visual interface.
Core Functions
1. The "Sheriff" (Trend Filter)
At the heart of the indicator is a heavy, modified Hull Moving Average (HMA 200) that acts as the trend baseline.
Bullish Regime: When the baseline is sloping UP, the indicator enters "Buy Only" mode. All Sell signals are mathematically deleted.
Bearish Regime: When the baseline is sloping DOWN, the indicator enters "Sell Only" mode. All Buy signals are mathematically deleted.
The Math: It uses a custom difference-weighted formula (wmaHalf = Length / 1) to create a stable, chop-resistant trend anchor.
2. Dual-Signal Engine
The indicator scans for two distinct types of entries simultaneously:
♦ Standard Signals (Blue/Red Diamonds):
Logic: A classic Stochastic pullback (Cross 20/80) aligned with the trend.
Use Case: These are frequent "Bread and Butter" trend entries. They are excellent for scaling into a position or adding to a winner as the trend continues.
Location: Plotted at the top (Sell) and bottom (Buy) edges of the panel.
+ Sniper Signals (Gold Crosses):
Logic: Hidden Divergence. The script detects when Price holds structure (Higher Low) while Momentum resets (Lower Low). This is a "Slingshot" setup.
Use Case: These are rare, high-conviction entries. They often mark the end of a complex correction and the resumption of the main trend.
Location: Plotted on the Zero Line to indicate structural strength.
3. Smart Momentum Histogram
The histogram visualizes the "Energy" of the move (MACD 21, 34, 7), but with a twist. It is color-coded to the signal priority:
Gold Bars: A Sniper (Divergence) setup is active.
Solid Blue/Red Bars: A Standard Signal is active.
Faded Blue/Red Bars: The trend is active, but momentum is resetting (waiting mode).
Gray Bars: Counter-trend noise (Ignore).
How to Trade It
Check the "Road": Look at the general color of the histogram columns.
Blue Columns: Look for Longs.
Red Columns: Look for Shorts.
The "Sniper" Entry: Wait for a Gold Cross (+) on the zero line. This is your primary signal to enter a trade with normal risk.
The "Pyramid" Entry: If the trend continues and you see Blue/Red Diamonds (♦) appear at the edges, these are safe places to add to your position.
The Exit: Since this is a trend-following tool, exit when the histogram color flips (e.g., from Blue to Red/Gray), or use your own support/resistance targets.
Alerts Configuration
The indicator comes with a full suite of alerts for automation:
Gold Buy / Gold Sell: Notifies you only for the high-probability Hidden Divergence setups.
Standard Buy / Standard Sell: Notifies you for every trend pullback.
ANY BUY / ANY SELL: A combo alert that triggers on either signal type (useful for simplifying your alert limits).
Accessibility
Color Blind Friendly: The default palette uses High-Contrast Blue (#2962FF) and Soft Red (#FF5252) instead of standard Green/Red, ensuring visibility for all users.
Zero Clutter: No text labels or confusing lines. Just clear, distinct shapes (Diamonds and Crosses) at fixed locations.

JK Scalp - Nishith RajwarJK Scalp Nishith Rajwar
Multi-Stochastic Rotation & Momentum Scalping Framework
JK Scalp is a rule-based momentum and rotation oscillator designed for short-term scalping and intraday execution.
It focuses on how momentum rotates across multiple stochastic speeds, instead of relying on a single oscillator or lagging averages.
This is an execution aid, not a predictive indicator.
🧠 Concept & Originality
Unlike standard stochastic tools, JK Scalp uses four synchronized stochastic layers:
• Fast (9,3) → execution timing
• Medium (14,3) → structure confirmation
• Slow (44,3) → swing context
• Trend (60,10,10) → dominant momentum regime
The core idea is quad-rotation:
High-probability trades occur when all momentum layers rotate together after reaching an extreme.
This script combines:
• Momentum rotation
• Divergence logic
• Flag continuation logic
• Trend-state filtering
into a single cohesive framework, not a simple indicator mashup.
📊 How to Use (Step-by-Step)
1️⃣ Best Timeframes
• Scalping: 1m – 3m
• Intraday: 5m – 15m
• Avoid higher timeframes (not designed for swing holding)
Works best on:
• Index options
• Index futures
• Highly liquid stocks
• Crypto majors
2️⃣ Understanding the Signals
🔁 Quad Rotation (Core Signal)
A valid rotation requires:
• Fast, Medium, Slow, and Trend stochastic moving in the same direction
• Momentum exiting Overbought / Oversold zones
• Trend stochastic supporting the move
This filters out random oscillator noise.
3️⃣ Entry Conditions
🟢 LONG Setup
• Bullish quad rotation
• Either:
– Bullish divergence OR
– Bullish flag pullback
• Fast stochastic turning up
🔴 SHORT Setup
• Bearish quad rotation
• Either:
– Bearish divergence OR
– Bearish flag pullback
• Fast stochastic turning down
⚠️ Signals are confirmation-based, not anticipatory.
4️⃣ SUPER LONG / SUPER SHORT
These appear only when:
• Quad rotation
• Divergence confirmation
They represent high-confidence momentum inflection zones, not guaranteed reversals.
5️⃣ Stop-Loss Visualization
Optional SL zones are plotted using:
• Recent swing high / low
• ATR-based buffer (configurable)
This helps traders visualize risk, not automate exits.
🎨 Visual System (Why It Looks Different)
• Multi-layer glow effects → momentum strength
• Dynamic cloud → fast vs trend dominance
• Color-shifting fast line → acceleration vs decay
• Chart overlays → execution clarity without clutter
Everything is designed for speed and readability during live trading.
⭐ Unique Selling Points (USP)
✅ Multi-speed stochastic rotation (not single-line signals)
✅ Context-first, not signal spam
✅ Built-in divergence + continuation logic
✅ Non-repainting logic
✅ Designed for scalpers, not hindsight analysis
✅ Works across indices, options, crypto, and futures
⚠️ Important Notes
• Not a standalone trading system
• Best combined with:
– Market structure
– Key levels
– Session timing
• Avoid low-liquidity or news-spike candles
This indicator guides execution, it does not replace discretion.
👤 Who This Is For
• Scalpers & intraday traders
• Options traders needing precise timing
• Traders who understand momentum & structure
• Users who want fewer but higher-quality signals
🏁 Summary
JK Scalp helps you trade momentum rotation, not overbought/oversold myths.
Wait for alignment. Execute with discipline.
