Turtle Trade Channels by KıvanÇ fr3762his trend following system was designed by Dennis Gartman and Bill Eckhart, and relies on breakouts of historical highs and lows to take and close trades: it is the complete opposite to the "buy low and sell high" approach. This trend following system was taught to a group of average and normal individuals, and almost everyone turned into a profitable trader.
The main rule is "Trade an N-day breakout and take profits when an M-day high or low is breached (N must me above M)". Examples:
Buy a 10-day breakout and close the trade when price action reaches a 5-day low.
Go short a 20-day breakout and close the trade when price action reaches a 10-day high.
In this indicator, the red line is the trading line, and the dotted blue line is the exit line. Original system is:
Go long when the trading line crosses below close price
Go short when the trading line rosses above close price
Exit long positions when the price touches the exit line
Exit short positions when the price touches the exit line
Recommended initial stop-loss is ATR * 2 from the opening price. Default system parameters were 20,10 and 55,20.
Original Turtle Rules:
To trade exactly like the turtles did, you need to set up two indicators representing the main and the failsafe system.
Set up the main indicator with TradePeriod = 20 and StopPeriod = 10 (A.k.a S1)
Set up the failsafe indicator with TradePeriod = 55 and StopPeriod = 20 using a different color. (A.k.a S2)
The entry strategy using S1 is as follows
Buy 20-day breakouts using S1 only if last signaled trade was a loss.
Sell 20-day breakouts using S1 only if last signaled trade was a loss.
If last signaled trade by S1 was a win, you shouldn't trade -Irregardless of the direction or if you traded last signal it or not-
The entry strategy using S2 is as follows:
Buy 55-day breakouts only if you ignored last S1 signal and the market is rallying without you
Sell 55-day breakouts only if you ignored last S1 signal and the market is pluging without you
The turtles had a progressive position sizing approach that boosted their winnings. Once a trading decision has been made you should...
Developers: Dennis Gartman and Bill Eckhart
İndikatörü geliştiren: Dennis Gartman and Bill Eckhart
Поиск скриптов по запросу "大位科技同行业可替代股票的技术面分析数据(如5日均线、10日均线、支撑位、压力位)"

Amazing Crossover System - 100+ pips per day!I got the main concept for this system on another site. While I have made one important change, I must stress that the heart of this system was created by someone else! We must give credit where credit is due!
Y'all know baby pips. @ForexPhantom published about this system and did both back and forward test around 10 years ago.
I found it on the sit and now I put it to code to see how it performs. I assume 10 points spread for every trade. I use Renesource or AxiTrader to get the low spreads.
There are 2 mods, the single trades and constant trading on the direction.
Main concept
Indicators
5 EMA -- YELLOW
10 EMA -- RED
RSI (10 - Apply to Median Price: HL/2) -- One level at 50.
TIME FRAME
1 Hour Only (very important!)
PAIRS
Virtually any pair seems to work as this is strictly technical analysis.
I recommend sticking to the main currencies and avoiding cross currencies (just his preference).
WHEN TO ENTER A TRADE
Enter LONG when the Yellow EMA crosses the Red EMA from underneath.
RSI must be approaching 50 from the BOTTOM and cross 50 to warrant entry.
Enter SHORT when the Yellow EMA crosses the Red EMA from the top.
RSI must be approaching 50 from the TOP and cross 50 to warrant entry.
I've attached a picture which demonstrates all these conditions.
That's it!
f.bpcdn.co

Trend Score by KIVANÇ fr3762Trend Score compares close prices between last close with previous closes by a certain period of time.
It's like momentum but gives a score +1 when close price is equal to or above (defaultly) 10 bars ago and gives a score of -1 when below.
calculation continues from default length to the 2 times of length.
Defaultly (for 10 bars length)
If Trend Score converges to 10; that means there's a strong uptrend
conversely if Trend Score converges to -10; that means a strong downtrend market is on.

JSE Wyckoff Wave Volume Code// The Stock Market Institute (SMI) describes an propriety indicator the "SMI Wyckoff Wave" for US Stocks. This code is an attempt to make a Wyckoff Wave for the Johannesburg Stock Exchange (JSE).
// The JSE Wyckoff Wave is in a separate code. This is the code for the volume of the wave. Please see code for the JSE Wyckoff Wave which goes with this indicator.
//
// The Wave presents a normalized price for the 10 selected stocks (An Index for the 10 stocks).
// The theory is to select stocks that are widely held, market leaders, actively traded and participate in important market moves.
// This is only my attempt to select 10 stocks and a different selection can be made.
// I am not certain how SMI determine their weightings but what I have done it to equalize the Rand value of the stock volumne so that moves are of equal magnitude.
// The then provides a view of the overall condition of the market and volume flow in the market.
//
// I have used the September 2018 price to normalize the stock price for the 10 selected stocks based. The stocks and weightings can be changed periodically depending on the performance and leadership.
//
// Please, let me know if there is a better work around this.
The stocks and their weightings are:
"JSE:BTI"/0.79
"JSE:SHP"/2.87
"JSE:NPN"/0.18
"JSE:AGL"/1.96
"JSE:SOL"/1.0
"JSE:CFR"/4.42
"JSE:MND"/1.40
"JSE:MTN"/7.63
"JSE:SLM"/7.29
"JSE:FSR"/8.25

JSE Wyckoff WaveThe Stock Market Institute (SMI) describes an propriety indicator the "SMI Wyckoff Wave" for US Stocks. This code is an attempt to make a Wyckoff Wave for the Johannesburg Stock Exchange (JSE). Once the wave has been established the volume can also be calculated. Please see code for the JSE Wyckoff Wave Volume which goes with this indicator.
The Wave presents a normalized price for the 10 selected stocks (An Index for the 10 stocks). The theory is to select stocks that are widely held, market leaders, actively traded and participate in important market moves. This is only my attempt to select 10 stocks and a different selection can be made. I am not certain how SMI determine their weightings but what I have done it to equalize the Rand value of the stock so that moves are of equal magnitude. The then provides a view of the overall condition of the market and volume flow in the market.
I have used the September 2018 price to normalize the stock price for the 10 selected stocks based. The stocks and weightings can be changed periodically depending on the performance and leadership.
Most Indecies when constructed assume that all high prices and all low prices happen at the same time and therefor inflate the wicks of the bars. To make the wave more representatives for the SMI Wyckoff Wave the price is determined on the 5 minute timeframe which removes this bias. However, TradingView does not calculate properly when selecting a lower timeframe than in current period. A work around is to call the sma of the highs and add these which provides more realistic tails. Please, let me know if there is a better work around this.
The stocks and their weightings are:
"JSE:BTI"*0.79
"JSE:SHP"*2.87
"JSE:NPN"*0.18
"JSE:AGL"*1.96
"JSE:SOL"*1.0
"JSE:CFR"*4.42
"JSE:MND"*1.40
"JSE:MTN"*7.63
"JSE:SLM"*7.29
"JSE:FSR"*8.25

OHLC Daily Resolution BandsShout out to nPE- for the idea.
Bands made with stdev from 10 day OHLC.
Keeps resolution to daily, so you can use bands as daily pivots for day trading.
Upper band 1=yesterday close + 0.5 std(ohlc,10)
Upper band 1=yesterday close + 1 std(ohlc,10)
Mid=yesterday close
Lower band 1=yesterday close - 0.5 std(ohlc,10)
Lower band 2=yesterday close - 1 std(ohlc,1

XPloRR MA-Buy ATR-Trailing-Stop Long Term Strategy Beating B&HXPloRR MA-Buy ATR-MA-Trailing-Stop Strategy
Long term MA Trailing Stop strategy to beat Buy&Hold strategy
None of the strategies that I tested can beat the long term Buy&Hold strategy. That's the reason why I wrote this strategy.
Purpose: beat Buy&Hold strategy with around 10 trades. 100% capitalize sold trade into new trade.
My buy strategy is triggered by the EMA(blue) crossing over the SMA curve(orange).
My sell strategy is triggered by another EMA(lime) of the close value crossing the trailing stop(green) value.
The trailing stop value(green) is set to a multiple of the ATR(15) value.
ATR(15) is the SMA(15) value of the difference between high and low values.
Every stock has it's own "DNA", so first thing to do is find the right parameters to get the best strategy values voor EMA, SMA and Trailing Stop.
Then keep using these parameter for future buy/sell signals only for that particular stock.
Do the same for other stocks.
Here are the parameters:
Exponential MA: buy trigger when crossing over the SMA value (use values between 11-50)
Simple MA: buy trigger when EMA crosses over the SMA value (use values between 20 and 200)
Stop EMA: sell trigger when Stop EMA of close value crosses under the trailing stop value (use values between 8 and 16)
Trailing Stop #ATR: defines the trailing stop value as a multiple of the ATR(15) value
Example parameters for different stocks (Start capital: 1000, Order=100% of equity, Period 1/1/2005 to now):
BAR(Barco): EMA=11, SMA=82, StopEMA=12, Stop#ATR=9
Buy&HoldProfit: 45.82%, NetProfit: 294.7%, #Trades:8, %Profit:62.5%, ProfitFactor: 12.539
AAPL(Apple): EMA=12, SMA=45, StopEMA=12, Stop#ATR=6
Buy&HoldProfit: 2925.86%, NetProfit: 4035.92%, #Trades:10, %Profit:60%, ProfitFactor: 6.36
BEKB(Bekaert): EMA=12, SMA=42, StopEMA=12, Stop#ATR=7
Buy&HoldProfit: 81.11%, NetProfit: 521.37%, #Trades:10, %Profit:60%, ProfitFactor: 2.617
SOLB(Solvay): EMA=12, SMA=63, StopEMA=11, Stop#ATR=8
Buy&HoldProfit: 43.61%, NetProfit: 151.4%, #Trades:8, %Profit:75%, ProfitFactor: 3.794
PHIA(Philips): EMA=11, SMA=80, StopEMA=8, Stop#ATR=10
Buy&HoldProfit: 56.79%, NetProfit: 198.46%, #Trades:6, %Profit:83.33%, ProfitFactor: 23.07
I am very curious to see the parameters for your stocks and please make suggestions to improve this strategy.

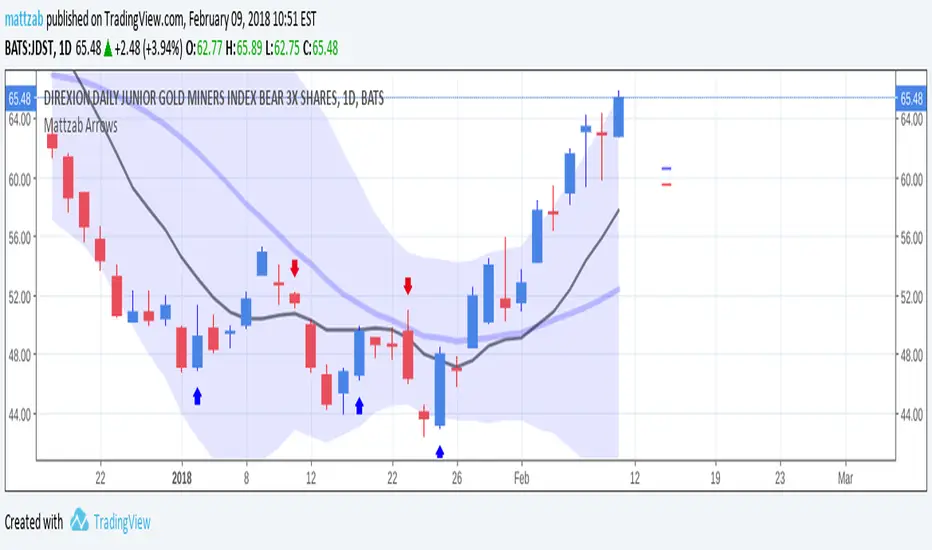
Mattzab ArrowsMattzab Arrows
THE BASICS
Buy and Sell Signal Arrows
Tack Marks to show how close the next opposite arrow might be- showing possible trend reversals
Standard Bollinger Bands
10-Day SMA Line
Configurable
Open Source
THE NITTY GRITTY
For starters, all values listed below can be changed in the settings. Length of time, as well as source, can be changed. For the Hidden EMA, this can be made visible by increasing its transparency.
ARROWS
The buy and sell signal arrows are based on price and MACD histogram.
The MACD settings are as follows: 10 day fast EMA , 20 day slow EMA , 5 day SMA signal smoothing. Instead of close price, we are using the average point of the day's high, low, and close.
For the arrows, current price and yesterday's price are using hl2 for high/low average.
A BUY arrow is created when:
Current Price IS GREATER THAN Previous Price _AND_ Current MACD Histogram IS GREATER THAN Previous MACD Histogram.
Important Note! Because the MACD Histogram repaints, the buy arrows may appear, then disappear later in the day, if the MACD changes. Check on the changelog to see if I've fixed it by the time you're reading this. (TradingView doesn't let you edit the description after it's been posted)
A SELL arrow is created when:
Current Price IS LESS THAN Previous Price _AND_ Current MACD Histogram IS LESS THAN Yesterday's MACD Histogram _AND_ Close Price is below _EITHER_ the Hidden EMA (default set to 4) _OR_ the Visible SMA (Default set to 10, which is the black line).
The hidden EMA can be made visible by increasing it's transparency in the Style tab.
Including the requirement to only sell if the standard conditions are met, PLUS being below one of those moving average lines, helps to prevent false sell arrows and repainting.
TACK MARKS
The Red Tack is the threshold, or barrier, for the next arrow. It will not move. It is based on previous High/Low/Close Price + MACD.
The Blue Tack is the current point in space for our average Price and MACD Delta Values. It will move throughout the day (or hour or minute depending on your resolution). The Blue Tack will give you an indication of how close or how far from the reversal threshold (Red Tack) the ticker is at that point.
While the Blue Tack is ABOVE Red, the most recent signal arrow will be a buy, and we are in a buy/hold period.
While the Blue Tack is BELOW Red, the most recent signal arrow will be a sell, and we are in a sell/wait period.
If the Blue Tack crosses above or below Red, you'll get the next arrow.
MOVING AVERAGE LINES
There are three moving average lines in this indicator.
The first is black, and is by default a 10-Day Simple Moving Average Line.
This black line is a good safeguard against selling too early. This is a good support line and that's how I use it.
The second is invisible, but can be made visible in the Styling, and is by default a 4-Day Exponential Moving Average Line
The third is the blue 20-Day Bollinger Band line.
BOLLINGER BANDS
The Bollinger Bands are unmodified and are just a background indicator for your use. If you prefer not to see the Bollinger Bands , change their transparency to 0% to hide them. I've cleaned up the Bollinger Bands to make the indicator as a whole- easier on the eyes.
Please leave feedback on how the script works for you, if you run into problems, if you have any changes you'd like to see, etc.
MACDouble + RSI (rec. 15min-2hr intrv) Uses two sets of MACD plus an RSI to either long or short. All three indicators trigger buy/sell as one (ie it's not 'IF MACD1 OR MACD2 OR RSI > 1 = buy", its more like "IF 1 AND 2 AND RSI=buy", all 3 match required for trigger)
The MACD inputs should be tweaked depending on timeframe and what you are trading. If you are doing 1, 3, 5 min or real frequent trading then 21/44/20 and 32/66/29 or other high value MACDs should be considered. If you are doing longer intervals like 2, 3, 4hr then consider 9/19/9 and 21/44/20 for MACDs (experiment! I picked these example #s randomly).
Ideal usage for the MACD sets is to have MACD2 inputs at around 1.5x, 2x, or 3x MACD1's inputs.
Other settings to consider: try having fastlength1=macdlength1 and then (fastlength2 = macdlength2 - 2). Like 10/26/10 and 23/48/20. This seems to increase net profit since it is more likely to trigger before major price moves, but may decrease profitable trade %. Conversely, consider FL1=MCDL1 and FL2 = MCDL2 + (FL2 * 0.5). Example: 10/26/10 and 22/48/30 this can increase profitable trade %, though may cost some net profit.
Feel free to message me with suggestions or questions.

Kay_BBandsV3This is the 3rd version of Kay_BBands.
When +DI (Directional Index ) is above -DI , then Upper band will be visible and vice-versa.
This is when the ADX is above the threshold. 28 is the default in this version. I found its more appealing in 5M time frame.
BLUE - ADX under 10
GREEN - Uptrend, ADX over 10
RED - Downtrend, ADX over 10
Use it with another band with setting 20, 0.6 deviation. Prices keeping above or below the 2nd bands upper or lower bounds shows trending conditions.
I didn't know how to update the old script so published it again.
Changes - :
1) Updated default settings for the indicator
2) ADX setting are now DI (28), ADX (10), adx level to check is 10.
3) IMPORTANT one - When DI is up/down, lower/upper band will also have color (more visible that way.)
Play around the settings.. It really eliminates extra indicator checking visually... Please like if you think idea is good.

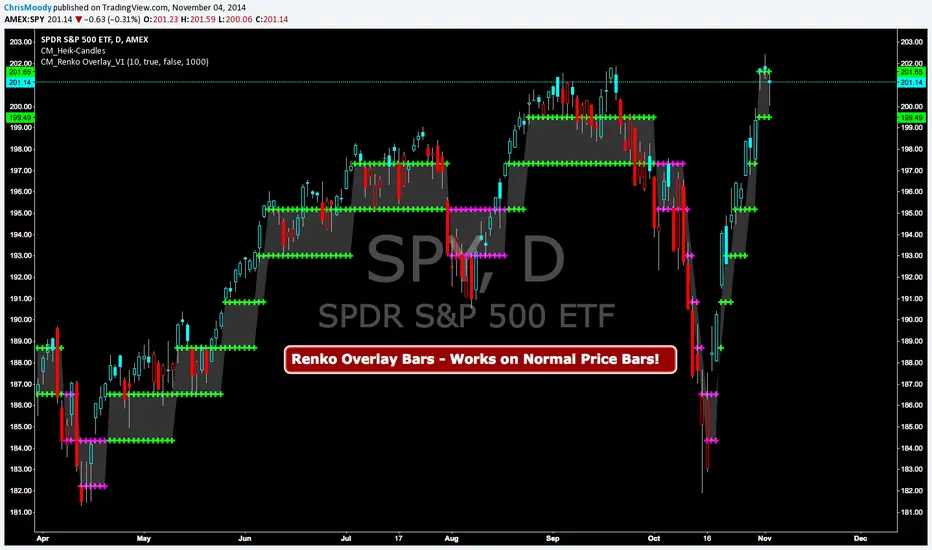
CM Renko Overlay BarsCM_Renko Overlay Bars V1
Overlays Renko Bars on Regular Price Bars.
Default Renko plot is based on Average True Range. Look Back period adjustable in Inputs Tab.
If you Choose to use "Traditional" Renko bars and pick the Size of the Renko Bars the please read below.
Value in Input Tab is multiplied by .001 (To work on Forex)
1 = 10 pips on EURUSD - 1 X .001 = .001 or 10 Pips
10 = .01 or 100 Pips
1000 = 1 point to the left of decimal. 1 Point in Stocks etc.
10000 = 10 Points on Stocks etc.
***V2 will fix this issue.
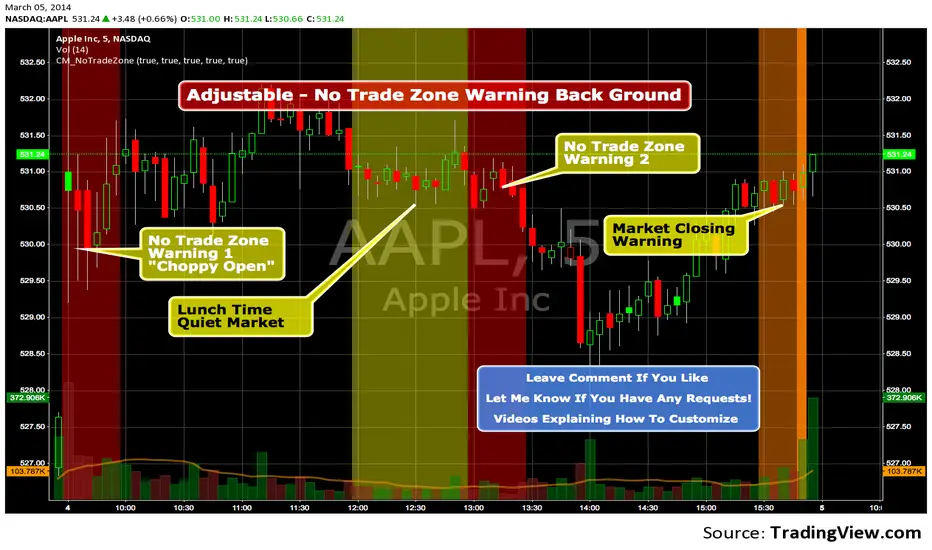
Custom Indicator - No Trade Zone Warning Back Ground Highlights!Years ago I did an analysis of my trades. Every period of the day was profitable except for two. From 10:00-1030, and 1:00 to 1:30. (I was actively Day Trading Futures) Imagine a vertical graph broken down in to 30 minute time segments. I had nice Green bars in every time slot (Showing Net Profits), and HUGE Red Bars from 10 to 10:30 and 1 to 1:30. After analysis I found I made consistent profits at session open, but then I would enter in to bad setups around 10 to make more money. I also found after I took lunch when I came back at 1:00 I would force trades instead of patiently waiting for a great trade setup. I created an indicator that plotted a red background around those times telling me I was not allowed to enter a trade. Profits went up!!! Details on How to adjust times are in 1st Post. You can adjust times and colors to meet your own trading needs.
VIX/VVIX Spike RiskVIX/VVIX Spike Risk Analyzer
The VIX/VVIX Spike Risk Analyzer analyzes historical VIX behavior under similar market conditions to forecast future VIX spike risk.
By combining current VIX and VVIX levels as dual filters, it identifies historical precedents and calculates the probability and magnitude of VIX spikes over the next 1, 5, and 10 trading days.
IMPORTANT: This indicator must be applied to the VIX chart (CBOE:VIX) to function correctly.
Methodology
1. Dual-Filter Pattern Matching
The indicator uses both VIX and VVIX as simultaneous filters to identify historically analogous market conditions:
By requiring BOTH metrics to match historical levels, the indicator creates more precise market condition filters than using VIX alone. This dual-filter approach significantly improves predictive accuracy because:
VIX alone might be at 15, but VVIX can tell us if that 15 is stable (low VVIX) or explosive (high VVIX)
High VVIX + Low VIX often precedes major spikes
Low VVIX + Low VIX suggests sustained calm
2. Tolerance Settings
VIX Matching (Default: ±10% Relative)
Uses relative percentage matching for consistency across different VIX regimes
Example: VIX at 15 matches 13.5-16.5 (±10%)
Can switch to absolute tolerance (±5 points) if preferred
VVIX Matching (Default: ±10 Points Absolute)
Uses absolute point matching as VVIX scales differently
Example: VVIX at 100 matches 90-110
Can switch to relative percentage if preferred
3. Historical Analysis Window
The indicator scans up to 500 bars backward (limited by VVIX data availability) to find all historical periods where both VIX and VVIX were at similar levels. Each match becomes a "sample" for statistical analysis.
4. Forward-Looking Spike Analysis
For each historical match, the indicator measures VIX behavior over the next 1, 5, and 10 days
Display Metrics Explained
Average Highest Spike
Shows the average of the maximum VIX spikes observed.
Highest Single Spike
Shows the single largest spike ever recorded
Probability No 10% Spike
Shows what percentage of historical cases stayed BELOW a 10% spike:
Probability No 20% Spike
Shows what percentage of historical cases stayed BELOW a 20% spike:
Note : You'll see many more shaded bars than the sample count because each match creates up to 5 consecutive shaded bars (bars 1-5 after the match all "look back" and see it).
Short Volatility Strategies:
Enter when there's a LOW probability of big vol spikes based on today's metrics
Long Volatility Strategies
Enter when there's a HIGH probability of big vol spikes based on today's metrics

LibTmFrLibrary "LibTmFr"
This is a utility library for handling timeframes and
multi-timeframe (MTF) analysis in Pine Script. It provides a
collection of functions designed to handle common tasks related
to period detection, session alignment, timeframe construction,
and time calculations, forming a foundation for
MTF indicators.
Key Capabilities:
1. **MTF Period Engine:** The library includes functions for
managing higher-timeframe (HTF) periods.
- **Period Detection (`isNewPeriod`):** Detects the first bar
of a given timeframe. It includes custom logic to handle
multi-month and multi-year intervals where
`timeframe.change()` may not be sufficient.
- **Bar Counting (`sinceNewPeriod`):** Counts the number of
bars that have passed in the current HTF period or
returns the final count for a completed historical period.
2. **Automatic Timeframe Selection:** Offers functions for building
a top-down analysis framework:
- **Automatic HTF (`autoHTF`):** Suggests a higher timeframe
(HTF) for broader context based on the current timeframe.
- **Automatic LTF (`autoLTF`):** Suggests an appropriate lower
timeframe (LTF) for granular intra-bar analysis.
3. **Timeframe Manipulation and Comparison:** Includes tools for
working with timeframe strings:
- **Build & Split (`buildTF`, `splitTF`):** Functions to
programmatically construct valid Pine Script timeframe
strings (e.g., "4H") and parse them back into their
numeric and unit components.
- **Comparison (`isHigherTF`, `isActiveTF`, `isLowerTF`):**
A set of functions to check if a given timeframe is
higher, lower, or the same as the script's active timeframe.
- **Multiple Validation (`isMultipleTF`):** Checks if a
higher timeframe is a practical multiple of the current
timeframe. This is based on the assumption that checking
if recent, completed HTF periods contained more than one
bar is a valid proxy for preventing data gaps.
4. **Timestamp Interpolation:** Contains an `interpTimestamp()`
function that calculates an absolute timestamp by
interpolating at a given percentage across a specified
range of bars (e.g., 50% of the way through the last
20 bars), enabling time calculations at a resolution
finer than the chart's native bars.
---
**DISCLAIMER**
This library is provided "AS IS" and for informational and
educational purposes only. It does not constitute financial,
investment, or trading advice.
The author assumes no liability for any errors, inaccuracies,
or omissions in the code. Using this library to build
trading indicators or strategies is entirely at your own risk.
As a developer using this library, you are solely responsible
for the rigorous testing, validation, and performance of any
scripts you create based on these functions. The author shall
not be held liable for any financial losses incurred directly
or indirectly from the use of this library or any scripts
derived from it.
buildTF(quantity, unit)
Builds a Pine Script timeframe string from a numeric quantity and a unit enum.
The resulting string can be used with `request.security()` or `input.timeframe`.
Parameters:
quantity (int) : series int Number to specifie how many `unit` the timeframe spans.
unit (series TFUnit) : series TFUnit The size category for the bars.
Returns: series string A Pine-style timeframe identifier, e.g.
"5S" → 5-seconds bars
"30" → 30-minute bars
"120" → 2-hour bars
"1D" → daily bars
"3M" → 3-month bars
"24M" → 2-year bars
splitTF(tf)
Splits a Pine‑timeframe identifier into numeric quantity and unit (TFUnit).
Parameters:
tf (string) : series string Timeframe string, e.g.
"5S", "30", "120", "1D", "3M", "24M".
Returns:
quantity series int The numeric value of the timeframe (e.g., 15 for "15", 3 for "3M").
unit series TFUnit The unit of the timeframe (e.g., TFUnit.minutes, TFUnit.months).
Notes on strings without a suffix:
• Pure digits are minutes; if divisible by 60, they are treated as hours.
• An "M" suffix is months; if divisible by 12, it is converted to years.
autoHTF(tf)
Picks an appropriate **higher timeframe (HTF)** relative to the selected timeframe.
It steps up along a coarse ladder to produce sensible jumps for top‑down analysis.
Mapping → chosen HTF:
≤ 1 min → 60 (1h) ≈ ×60
≤ 3 min → 180 (3h) ≈ ×60
≤ 5 min → 240 (4h) ≈ ×48
≤ 15 min → D (1 day) ≈ ×26–×32 (regular session 6.5–8 h)
> 15 min → W (1 week) ≈ ×64–×80 for 30m; varies with input
≤ 1 h → W (1 week) ≈ ×32–×40
≤ 4 h → M (1 month) ≈ ×36–×44 (~22 trading days / month)
> 4 h → 3M (3 months) ≈ ×36–×66 (e.g., 12h→×36–×44; 8h→×53–×66)
≤ 1 day → 3M (3 months) ≈ ×60–×66 (~20–22 trading days / month)
> 1 day → 12M (1 year) ≈ ×(252–264)/quantity
≤ 1 week → 12M (1 year) ≈ ×52
> 1 week → 48M (4 years) ≈ ×(208)/quantity
= 1 M → 48M (4 years) ≈ ×48
> 1 M → error ("HTF too big")
any → error ("HTF too big")
Notes:
• Inputs in months or years are restricted: only 1M is allowed; larger months/any years throw.
• Returns a Pine timeframe string usable in `request.security()` and `input.timeframe`.
Parameters:
tf (string) : series string Selected timeframe (e.g., "D", "240", or `timeframe.period`).
Returns: series string Suggested higher timeframe.
autoLTF(tf)
Selects an appropriate **lower timeframe LTF)** for intra‑bar evaluation
based on the selected timeframe. The goal is to keep intra‑bar
loops performant while providing enough granularity.
Mapping → chosen LTF:
≤ 1 min → 1S ≈ ×60
≤ 5 min → 5S ≈ ×60
≤ 15 min → 15S ≈ ×60
≤ 30 min → 30S ≈ ×60
> 30 min → 60S (1m) ≈ ×31–×59 (for 31–59 minute charts)
≤ 1 h → 1 (1m) ≈ ×60
≤ 2 h → 2 (2m) ≈ ×60
≤ 4 h → 5 (5m) ≈ ×48
> 4 h → 15 (15m) ≈ ×24–×48 (e.g., 6h→×24, 8h→×32, 12h→×48)
≤ 1 day → 15 (15m) ≈ ×26–×32 (regular sessions ~6.5–8h)
> 1 day → 60 (60m) ≈ ×(26–32) per day × quantity
≤ 1 week → 60 (60m) ≈ ×32–×40 (≈5 sessions of ~6.5–8h)
> 1 week → 240 (4h) ≈ ×(8–10) per week × quantity
≤ 1 M → 240 (4h) ≈ ×33–×44 (~20–22 sessions × 6.5–8h / 4h)
≤ 3 M → D (1d) ≈ ×(20–22) per month × quantity
> 3 M → W (1w) ≈ ×(4–5) per month × quantity
≤ 1 Y → W (1w) ≈ ×52
> 1 Y → M (1M) ≈ ×12 per year × quantity
Notes:
• Ratios for D/W/M are given as ranges because they depend on
**regular session length** (typically ~6.5–8h, not 24h).
• Returned strings can be used with `request.security()` and `input.timeframe`.
Parameters:
tf (string) : series string Selected timeframe (e.g., "D", "240", or timeframe.period).
Returns: series string Suggested lower TF to use for intra‑bar work.
isNewPeriod(tf, offset)
Returns `true` when a new session-aligned period begins, or on the Nth bar of that period.
Parameters:
tf (string) : series string Target higher timeframe (e.g., "D", "W", "M").
offset (simple int) : simple int 0 → checks for the first bar of the new period.
1+ → checks for the N-th bar of the period.
Returns: series bool `true` if the condition is met.
sinceNewPeriod(tf, offset)
Counts how many bars have passed within a higher timeframe (HTF) period.
For daily, weekly, and monthly resolutions, the period is aligned with the trading session.
Parameters:
tf (string) : series string Target parent timeframe (e.g., "60", "D").
offset (simple int) : simple int 0 → Running count for the current period.
1+ → Finalized count for the Nth most recent *completed* period.
Returns: series int Number of bars.
isHigherTF(tf, main)
Returns `true` when the selected timeframe represents a
higher resolution than the active timeframe.
Parameters:
tf (string) : series string Selected timeframe.
main (bool) : series bool When `true`, the comparison is made against the chart's main timeframe
instead of the script's active timeframe. Optional. Defaults to `false`.
Returns: series bool `true` if `tf` > active TF; otherwise `false`.
isActiveTF(tf, main)
Returns `true` when the selected timeframe represents the
exact resolution of the active timeframe.
Parameters:
tf (string) : series string Selected timeframe.
main (bool) : series bool When `true`, the comparison is made against the chart's main timeframe
instead of the script's active timeframe. Optional. Defaults to `false`.
Returns: series bool `true` if `tf` == active TF; otherwise `false`.
isLowerTF(tf, main)
Returns `true` when the selected timeframe represents a
lower resolution than the active timeframe.
Parameters:
tf (string) : series string Selected timeframe.
main (bool) : series bool When `true`, the comparison is made against the chart's main timeframe
instead of the script's active timeframe. Optional. Defaults to `false`.
Returns: series bool `true` if `tf` < active TF; otherwise `false`.
isMultipleTF(tf)
Returns `true` if the selected timeframe (`tf`) is a practical multiple
of the active skript's timeframe. It verifies this by checking if `tf` is a higher timeframe
that has consistently contained more than one bar of the skript's timeframe in recent periods.
The period detection is session-aware.
Parameters:
tf (string) : series string The higher timeframe to check.
Returns: series bool `true` if `tf` is a practical multiple; otherwise `false`.
interpTimestamp(offStart, offEnd, pct)
Calculates a precise absolute timestamp by interpolating within a bar range based on a percentage.
This version works with RELATIVE bar offsets from the current bar.
Parameters:
offStart (int) : series int The relative offset of the starting bar (e.g., 10 for 10 bars ago).
offEnd (int) : series int The relative offset of the ending bar (e.g., 1 for 1 bar ago). Must be <= offStart.
pct (float) : series float The percentage of the bar range to measure (e.g., 50.5 for 50.5%).
Values are clamped to the range.
Returns: series int The calculated, interpolated absolute Unix timestamp in milliseconds.

💻 RSI Dual-Band Reversal Strategy (Hacker Mode)This 💻 RSI Dual-Band Reversal Strategy (Hacker Mode) is a mean-reversion trading strategy built on the Relative Strength Index (RSI) indicator.
It identifies potential trend reversals when price momentum reaches extreme overbought or oversold levels — then enters trades expecting the price to revert.
⚙️ Strategy Concept
The RSI measures market momentum on a scale of 0–100.
When RSI is too low, it signals an oversold market → potential buy.
When RSI is too high, it signals an overbought market → potential sell.
This strategy sets two reversal zones using dual RSI bands:
Zone RSI Range Meaning Action
Upper Band 80–90 Overbought Prepare to Sell
Lower Band 10–20 Oversold Prepare to Buy
🧩 Code Breakdown
1. Input Parameters
rsiLength = input.int(14)
upperBandHigh = input.float(90.0)
upperBandLow = input.float(80.0)
lowerBandLow = input.float(10.0)
lowerBandHigh = input.float(20.0)
You can adjust:
RSI Length (default 14) → sensitivity of the RSI.
Upper/Lower Bands → control when buy/sell triggers occur.
2. RSI Calculation
rsi = ta.rsi(close, rsiLength)
Calculates the RSI of the closing price over 14 periods.
3. Signal Logic
buySignal = ta.crossover(rsi, lowerBandHigh)
sellSignal = ta.crossunder(rsi, upperBandLow)
Buy Signal: RSI crosses up through 20 → market rebounding from oversold.
Sell Signal: RSI crosses down through 80 → market turning from overbought.
4. Plotting
RSI line (lime green)
Bands:
🔴 80–90 (Sell Zone)
🟢 10–20 (Buy Zone)
Gray midline at 50 for reference.
Triangle markers for signals:
🟢 “BUY” below chart
🔴 “SELL” above chart
5. Trading Logic
if (buySignal)
strategy.entry("Buy", strategy.long)
if (sellSignal)
strategy.entry("Sell", CRYPTO:BTCUSD strategy.short OANDA:XAUUSD )
Opens a long position on a buy signal.
Opens a short position on a sell signal.
No explicit stop loss or take profit — positions reverse when an opposite signal appears.
🧠 How It Works (Step-by-Step Example)
RSI drops below 20 → oversold → buy signal triggers.
RSI rises toward 80 → overbought → sell signal triggers.
Strategy flips position, always staying in the market (either long or short).
📈 Visual Summary
Imagine the RSI line oscillating between 0 and 100:
100 ────────────────────────────────
90 ───── Upper Band High (Sell Limit)
80 ───── Upper Band Low (Sell Trigger)
50 ───── Midline
20 ───── Lower Band High (Buy Trigger)
10 ───── Lower Band Low (Buy Limit)
0 ────────────────────────────────
When RSI moves above 80 → SELL
When RSI moves below 20 → BUY
⚡ Strategy Profile
Category Description
Type Mean Reversion
Entry Rule RSI crosses up 20 → Buy
Exit/Reverse Rule RSI crosses down 80 → Sell
Strengths Simple, effective in sideways/range markets, minimal lag
Weaknesses Weak in strong trends, no stop-loss or take-profit logic
💡 Suggested Improvements
You can enhance this script by adding:
Stop loss & take profit levels (e.g., % or ATR-based).
Trend filter (e.g., trade only in direction of 200 EMA).
RSI smoothing to reduce noise.
Lot Size Calculator - Gold🥇 Lot Size Calculator for Gold (XAU/USD)
Description:
A professional and accurate lot size calculator specifically designed for Gold (XAU/USD) trading. This indicator helps traders calculate the optimal position size based on account balance, risk percentage, and stop loss distance, ensuring proper risk management for every trade.
Key Features:
Accurate Gold Calculations - Properly accounts for Gold pip values ($10 per pip for standard 100oz lots)
Multi-Currency Support - Works with USD, EUR, and GBP account currencies
Flexible Contract Sizes - Supports Standard (100 oz), Mini (10 oz), and Micro (1 oz) lots
Customizable Decimal Places - Display lot sizes with 2-8 decimal precision (no rounding)
Clean Visual Design - Modern, professional info panel with gold-themed styling
Adjustable Display - Position panel anywhere on chart with customizable colors and sizes
Real-Time Calculations - Instantly updates as you adjust your risk parameters
How It Works:
The calculator uses the standard forex position sizing formula optimized for Gold:
Lot Size = Risk Amount / (Stop Loss in Pips × Pip Value Per Lot)
For Gold (XAU/USD):
Standard Lot (100 oz): 1 pip = $10
Mini Lot (10 oz): 1 pip = $1
Micro Lot (1 oz): 1 pip = $0.10
Settings:
Account Settings:
Account Balance: Your trading capital
Account Currency: USD, EUR, or GBP
Risk Percentage: How much to risk per trade (default: 2%)
Contract Size: 100 oz (Standard), 10 oz (Mini), or 1 oz (Micro)
Display Currency: Choose how to display risk amounts
Trade Settings:
Stop Loss: Your SL distance in pips
Display Settings:
Label Position: Top/Bottom, Left/Right, Middle Right
Label Size: Tiny to Huge
Decimal Places: 2-8 decimals
Custom Colors: Background, text, and accent colors
Perfect For:
Gold (XAU/USD) day traders and swing traders
Position sizing and risk management
Traders using fixed percentage risk models
Anyone trading Gold CFDs or spot markets
Scalpers to long-term Gold investors
What Makes This Different:
Unlike generic lot size calculators, this tool correctly calculates Gold's pip values based on contract size. Many calculators get this wrong, leading to incorrect position sizing. This indicator ensures you're always trading the right lot size for your risk tolerance.
Example Usage:
Account Balance: $10,000
Risk: 1% = $100
Stop Loss: 60 pips
Contract Size: 100 oz (Standard)
Result: 0.1667 lots (exact, no rounding)
Perfect for maintaining consistent risk management in your Gold trading strategy!

ProScalper📊 ProScalper - Professional 1-Minute Scalping System
🎯 Overview
ProScalper is a sophisticated, multi-confluence scalping indicator designed specifically for 1-minute chart trading. Combining advanced technical analysis with intelligent signal filtering, it provides high-probability trade setups with clear entry, stop loss, and take profit levels.
✨ Key Features
🔺 Smart Signal Detection
Range Filter Technology: Fast-responding trend detection (25-period) optimized for 1-minute timeframe
Medium-sized triangles appear above/below candles for clear buy/sell signals
Only most recent signal shown - no chart clutter
Automatically deletes old signals when new ones appear
📋 Real-Time Signal Table
Top-center display shows complete trade breakdown
Grade system: A+, A, B+, B, C+ ratings for every setup
All confluence reasons listed with checkmarks
Score and R:R displayed for instant trade quality assessment
Color-coded: Green for LONG, Red for SHORT
📐 Multi-Confluence Analysis
ProScalper combines 10+ technical factors:
✅ EMA Trend: 4 EMAs (200, 48, 13, 8) for multi-timeframe alignment
✅ VWAP: Dynamic support/resistance
✅ Fibonacci Retracement: Golden ratio (61.8%), 50%, 38.2%, 78.6%
✅ Range Filter: Adaptive trend confirmation
✅ Pivot Points: Smart reversal detection
✅ Volume Analysis: Spike detection and volume profile
✅ Higher Timeframe: 5-minute trend confirmation
✅ HTF Support/Resistance: Key levels from higher timeframes
✅ Liquidity Sweeps: Smart money detection
✅ Opening Range Breakout: First 15-minute range
💰 Complete Trade Management
Entry Lines: Dashed green (LONG) or red (SHORT) showing exact entry
Stop Loss: Red dashed line with price label
Take Profit: Blue dashed line with price label and R:R
Partial Exits: 1R level marked with orange dashed line
All lines extend 10 bars for clean alignment with Fibonacci levels
📊 Dynamic Risk/Reward
Adaptive R:R calculation based on market volatility
Targets adjusted for pivot distances
Minimum 1.2:1 to maximum 3.5:1 for scalping
Position sizing based on account risk percentage
🎨 Professional Visualization
Clean chart layout - no clutter, only essential information
Custom EMA colors: Red (200), Aqua (48), Green (13), White (8)
Gold VWAP line for key support/resistance
Color-coded Fibonacci: Bright yellow (61.8%), white (50%), orange (38.2%), fuchsia (78.6%)
No shaded zones - pure price action focus
📈 Performance Tracking
Real-time statistics table (optional)
Win rate, total trades, P&L tracking
Average R:R and win/loss ratios
Setup-specific performance metrics
⚙️ Settings & Customization
Risk Management
Adjustable account risk per trade (default: 0.5%)
ATR-based stop loss multiplier (default: 0.8 for tight scalping)
Dynamic position sizing
Signal Sensitivity
Confluence Score Threshold: 40-100 (default: 55 for balanced signals)
Range Filter Period: 25 bars (fast signals for 1-min)
Range Filter Multiplier: 2.2 (tighter bands for more signals)
Visual Controls
Toggle signal table on/off
Show/hide Fibonacci levels
Control EMA visibility
Adjust table text size
Partial Exits
1R: 50% (default)
2R: 30% (default)
3R: 20% (default)
Fully customizable percentages
Trailing Stops
ATR-Based (best for scalping)
Pivot-Based
EMA-Based
Breakeven trigger at 0.8R
🎯 Best Use Cases
Ideal For:
✅ 1-minute scalping on liquid instruments
✅ Day traders looking for quick 2-8 minute trades
✅ High-frequency trading with 8-15 signals per session
✅ Trending markets where Range Filter excels
✅ Crypto, Forex, Futures - works on all liquid assets
Trading Style:
Timeframe: 1-minute (can work on 3-5 min with adjusted settings)
Hold Time: 3-8 minutes average
Target: 1.2-3R per trade
Frequency: 8-15 signals per day
Win Rate: 45-55% (with proper risk management)
📋 How to Use
Step 1: Wait for Signal
Watch for green triangle (BUY) or red triangle (SELL)
Signal table appears at top center automatically
Step 2: Review Confluence
Check grade (prefer A+, A, B+ for best quality)
Review all reasons listed in table
Confirm score is above your threshold (55+ recommended)
Note the R:R ratio
Step 3: Enter Trade
Enter at current market price
Set stop loss at red dashed line
Set take profit at blue dashed line
Mark 1R level (orange line) for partial exit
Step 4: Manage Trade
Exit 50% at 1R (orange line)
Move to breakeven after 0.8R
Trail remaining position using your chosen method
Exit fully at TP or opposite signal
🎨 Chart Setup Recommendations
Optimal Display:
Timeframe: 1-minute
Chart Type: Candles or Heikin Ashi
Background: Dark theme for best color visibility
Volume: Enable volume bars below chart
Complementary Indicators (optional):
Order flow/Delta for institutional confirmation
Market profile for key levels
Economic calendar for news avoidance
⚠️ Important Notes
Risk Disclaimer:
Not financial advice - for educational purposes only
Always use proper risk management (0.5-1% per trade max)
Past performance doesn't guarantee future results
Test on demo account before live trading
Best Practices:
✅ Trade during high liquidity hours (9:30-11 AM, 2-4 PM EST)
✅ Avoid news events and market open/close (first/last 2 minutes)
✅ Use tight stops (0.8-1.0 ATR) for 1-minute scalping
✅ Take partial profits quickly (1R = 50% off)
✅ Respect max daily loss limits (3% recommended)
✅ Focus on A and B grade setups for consistency
What Makes This Different:
🎯 Complete system - not just signals, but full trade management
📊 Multi-confluence - 10+ factors analyzed per trade
🎨 Professional visualization - clean, focused chart design
⚡ Optimized for 1-min - settings specifically tuned for fast scalping
📋 Transparent reasoning - see exactly why each trade was taken
🏆 Grade system - instantly know trade quality
🔧 Technical Details
Pine Script Version: 5
Overlay: Yes (plots on price chart)
Max Lines: 500
Max Labels: 100
Non-repainting: All signals confirmed on bar close
Alerts: Compatible with TradingView alerts
📞 Support & Updates
This indicator is actively maintained and optimized for 1-minute scalping. Settings can be adjusted for different timeframes and trading styles, but default configuration is specifically tuned for high-frequency 1-minute scalping.
🚀 Get Started
Add ProScalper to your 1-minute chart
Adjust settings to your risk tolerance
Wait for signals (green/red triangles)
Follow the signal table guidance
Manage trades using provided levels
Track performance with stats table
Happy Scalping! 📊⚡💰

FVG MagicFVG Magic — Fair Value Gaps with Smart Mitigation, Inversion & Auto-Clean-up
FVG Magic finds every tradable Fair Value Gap (FVG), shows who powered it, and then manages each gap intelligently as price interacts with it—so your chart stays actionable and clean.
Attribution
This tool is inspired by the idea popularized in “Volumatic Fair Value Gaps ” by BigBeluga (licensed CC BY-NC-SA 4.0). Credit to BigBeluga for advancing FVG visualization in the community.
Important: This is a from-scratch implementation—no code was copied from the original. I expanded the concept substantially with a different detection stack, a gap state machine (ACTIVE → 50% SQ → MITIGATED → INVERSED), auto-clean up rules, lookback/nearest-per-side pruning, zoom-proof volume meters, and timeframe auto-tuning for 15m/H1/H4.
What makes this version more accurate
Full-coverage detection (no “missed” gaps)
Default ICT-minimal rule (Bullish: low > high , Bearish: high < low ) catches all valid 3-candle FVGs.
Optional Strict filter (stricter structure checks) for traders who prefer only “clean” gaps.
Optional size percentile filter—off by default so nothing is hidden unless you choose to filter.
Correct handling of confirmations (wick vs close)
Mitigation Source is user-selectable: high/low (wick-based) or close (strict).
This avoids false “misses” when you expect wick confirmations (50% or full fill) but your logic required closes.
State-aware labelling to prevent misleading data
The Bull%/Bear% meter is shown only while a gap is ACTIVE.
As soon as a gap is 50% SQ, MITIGATED, or INVERSED, the meter is hidden and replaced with a clear tag—so you never read stale participation stats.
Robust zoom behaviour
The meter uses a fixed bar-width (not pixels), so it stays proportional and readable at any zoom level.
Deterministic lifecycle (no stale boxes)
Remove on 50% SQ (instant or delayed).
Inversion window after first entry: if price enters but doesn’t invert within N bars, the box auto-removes once fully filled.
Inversion clean up: after a confirmed flip, keep for N bars (context) then delete (or 0 = immediate).
Result: charts auto-maintain themselves and never “lie” about relevance.
Clarity near current price
Nearest-per-side (keep N closest bullish & bearish gaps by distance to the midpoint) focuses attention where it matters without altering detection accuracy.
Lookback (bars) ensures reproducible behaviour across accounts with different data history.
Timeframe-aware defaults
Sensible auto-tuning for 15m / H1 / H4 (right-extension length, meter width, inversion windows, clean up bars) to reduce setup friction and improve consistency.
What it does (under the hood)
Detects FVGs using ICT-minimal (default) or a stricter rule.
Samples volume from a 10× lower timeframe to split participation into Bull % / Bear % (sum = 100%).
Manages each gap through a state machine:
ACTIVE → 50% SQ (midline) → MITIGATED (full) → INVERSED (SR flip after fill).
Auto-clean up keeps only relevant levels, per your rules.
Dashboard (top-right) displays counts by side and the active state tags.
How to use it
First run (show everything)
Use Strict FVG Filter: OFF
Enable Size Filter (percentile): OFF
Mitigation Source: high/low (wick-based) or close (stricter), as you prefer.
Remove on 50% SQ: ON, Delay: 0
Read the context
While ACTIVE, use the Bull%/Bear% meter to gauge demand/supply behind the impulse that created the gap.
Confluence with your HTF structure, sessions, VWAP, OB/FVG, RSI/MACD, etc.
Trade interactions
50% SQ: often the highest-quality interaction; if removal is ON, the box clears = “job done.”
Full mitigation then rejection through the other side → tag changes to INVERSED (acts like SR). Keep for N bars, then auto-remove.
Keep the chart tidy (optional)
If too busy, enable Size Filter or set Nearest per side to 2–4.
Use Lookback (bars) to make behaviour consistent across symbols and histories.
Inputs (key ones)
Use Strict FVG Filter: OFF(default)/ON
Enable Size Filter (percentile): OFF(default)/ON + threshold
Mitigation Source: high/low or close
Remove on 50% SQ + Delay
Inversion window after entry (bars)
Remove inversed after (bars)
Lookback (bars), Nearest per side (N)
Right Extension Bars, Max FVGs, Meter width (bars)
Colours: Bullish, Bearish, Inversed fill
Suggested defaults (per TF)
15m: Extension 50, Max 12, Inversion window 8, Clean up 8, Meter width 20
H1: Extension 25, Max 10, Inversion window 6, Clean up 6, Meter width 15
H4: Extension 15, Max 8, Inversion window 5, Clean up 5, Meter width 10
Notes & edge cases
If a wick hits 50% or the far edge but state doesn’t change, you’re likely on close mode—switch to high/low for wick-based behaviour.
If a gap disappears, it likely met a clean up condition (50% removal, inversion window, inversion clean up, nearest-per-side, lookback, or max-cap).
Meters are hidden after ACTIVE to avoid stale percentages.

Ultimate Oscillator (ULTOSC)The Ultimate Oscillator (ULTOSC) is a technical momentum indicator developed by Larry Williams that combines three different time periods to reduce the volatility and false signals common in single-period oscillators. By using a weighted average of three Stochastic-like calculations across short, medium, and long-term periods, the Ultimate Oscillator provides a more comprehensive view of market momentum while maintaining sensitivity to price changes.
The indicator addresses the common problem of oscillators being either too sensitive (generating many false signals) or too slow (missing opportunities). By incorporating multiple timeframes with decreasing weights for longer periods, ULTOSC attempts to capture both short-term momentum shifts and longer-term trend strength, making it particularly valuable for identifying divergences and potential reversal points.
## Core Concepts
* **Multi-timeframe analysis:** Combines three different periods (typically 7, 14, 28) to capture various momentum cycles
* **Weighted averaging:** Assigns higher weights to shorter periods for responsiveness while including longer periods for stability
* **Buying pressure focus:** Measures the relationship between closing price and the true range rather than just high-low range
* **Divergence detection:** Particularly effective at identifying momentum divergences that precede price reversals
* **Normalized scale:** Oscillates between 0 and 100, with clear overbought/oversold levels
## Common Settings and Parameters
| Parameter | Default | Function | When to Adjust |
|-----------|---------|----------|---------------|
| Fast Period | 7 | Short-term momentum calculation | Lower (5-6) for more sensitivity, higher (9-12) for smoother signals |
| Medium Period | 14 | Medium-term momentum calculation | Adjust based on typical swing duration in the market |
| Slow Period | 28 | Long-term momentum calculation | Higher values (35-42) for longer-term position trading |
| Fast Weight | 4.0 | Weight applied to fast period | Higher weight increases short-term sensitivity |
| Medium Weight | 2.0 | Weight applied to medium period | Adjust to balance medium-term influence |
| Slow Weight | 1.0 | Weight applied to slow period | Usually kept at 1.0 as the baseline weight |
**Pro Tip:** The classic 7/14/28 periods with 4/2/1 weights work well for most markets, but consider using 5/10/20 with adjusted weights for faster markets or 14/28/56 for longer-term analysis.
## Calculation and Mathematical Foundation
**Simplified explanation:**
The Ultimate Oscillator calculates three separate "buying pressure" ratios using different time periods, then combines them using weighted averaging. Buying pressure is defined as the close minus the true low, divided by the true range.
**Technical formula:**
```
BP = Close - Min(Low, Previous Close)
TR = Max(High, Previous Close) - Min(Low, Previous Close)
BP_Sum_Fast = Sum(BP, Fast Period)
TR_Sum_Fast = Sum(TR, Fast Period)
Raw_Fast = 100 × (BP_Sum_Fast / TR_Sum_Fast)
BP_Sum_Medium = Sum(BP, Medium Period)
TR_Sum_Medium = Sum(TR, Medium Period)
Raw_Medium = 100 × (BP_Sum_Medium / TR_Sum_Medium)
BP_Sum_Slow = Sum(BP, Slow Period)
TR_Sum_Slow = Sum(TR, Slow Period)
Raw_Slow = 100 × (BP_Sum_Slow / TR_Sum_Slow)
ULTOSC = 100 × / (Fast_Weight + Medium_Weight + Slow_Weight)
```
Where:
- BP = Buying Pressure
- TR = True Range
- Fast Period = 7, Medium Period = 14, Slow Period = 28 (defaults)
- Fast Weight = 4, Medium Weight = 2, Slow Weight = 1 (defaults)
> 🔍 **Technical Note:** The implementation uses efficient circular buffers for all three period calculations, maintaining O(1) time complexity per bar. The algorithm properly handles true range calculations including gaps and ensures accurate buying pressure measurements across all timeframes.
## Interpretation Details
ULTOSC provides several analytical perspectives:
* **Overbought/Oversold conditions:** Values above 70 suggest overbought conditions, below 30 suggest oversold conditions
* **Momentum direction:** Rising ULTOSC indicates increasing buying pressure, falling indicates increasing selling pressure
* **Divergence analysis:** Divergences between ULTOSC and price often precede significant reversals
* **Trend confirmation:** ULTOSC direction can confirm or question the prevailing price trend
* **Signal quality:** Extreme readings (>80 or <20) indicate strong momentum that may be unsustainable
* **Multiple timeframe consensus:** When all three underlying periods agree, signals are typically more reliable
## Trading Applications
**Primary Uses:**
- **Divergence trading:** Identify when momentum diverges from price for reversal signals
- **Overbought/oversold identification:** Find potential entry/exit points at extreme levels
- **Trend confirmation:** Validate breakouts and trend continuations
- **Momentum analysis:** Assess the strength of current price movements
**Advanced Strategies:**
- **Multi-divergence confirmation:** Look for divergences across multiple timeframes
- **Momentum breakouts:** Trade when ULTOSC breaks above/below key levels with volume
- **Swing trading entries:** Use oversold/overbought levels for swing position entries
- **Trend strength assessment:** Evaluate trend quality using momentum consistency
## Signal Combinations
**Strong Bullish Signals:**
- ULTOSC rises from oversold territory (<30) with positive price divergence
- ULTOSC breaks above 50 after forming a base near 30
- All three underlying periods show increasing buying pressure
**Strong Bearish Signals:**
- ULTOSC falls from overbought territory (>70) with negative price divergence
- ULTOSC breaks below 50 after forming a top near 70
- All three underlying periods show decreasing buying pressure
**Divergence Signals:**
- **Bullish divergence:** Price makes lower lows while ULTOSC makes higher lows
- **Bearish divergence:** Price makes higher highs while ULTOSC makes lower highs
- **Hidden bullish divergence:** Price makes higher lows while ULTOSC makes lower lows (trend continuation)
- **Hidden bearish divergence:** Price makes lower highs while ULTOSC makes higher highs (trend continuation)
## Comparison with Related Oscillators
| Indicator | Periods | Focus | Best Use Case |
|-----------|---------|-------|---------------|
| **Ultimate Oscillator** | 3 periods | Buying pressure | Divergence detection |
| **Stochastic** | 1-2 periods | Price position | Overbought/oversold |
| **RSI** | 1 period | Price momentum | Momentum analysis |
| **Williams %R** | 1 period | Price position | Short-term signals |
## Advanced Configurations
**Fast Trading Setup:**
- Fast: 5, Medium: 10, Slow: 20
- Weights: 4/2/1, Thresholds: 75/25
**Standard Setup:**
- Fast: 7, Medium: 14, Slow: 28
- Weights: 4/2/1, Thresholds: 70/30
**Conservative Setup:**
- Fast: 14, Medium: 28, Slow: 56
- Weights: 3/2/1, Thresholds: 65/35
**Divergence Focused:**
- Fast: 7, Medium: 14, Slow: 28
- Weights: 2/2/2, Thresholds: 70/30
## Market-Specific Adjustments
**Volatile Markets:**
- Use longer periods (10/20/40) to reduce noise
- Consider higher threshold levels (75/25)
- Focus on extreme readings for signal quality
**Trending Markets:**
- Emphasize divergence analysis over absolute levels
- Look for momentum confirmation rather than reversal signals
- Use hidden divergences for trend continuation
**Range-Bound Markets:**
- Standard overbought/oversold levels work well
- Trade reversals from extreme levels
- Combine with support/resistance analysis
## Limitations and Considerations
* **Lagging component:** Contains inherent lag due to multiple moving average calculations
* **Complex calculation:** More computationally intensive than single-period oscillators
* **Parameter sensitivity:** Performance varies significantly with different period/weight combinations
* **Market dependency:** Most effective in trending markets with clear momentum patterns
* **False divergences:** Not all divergences lead to significant price reversals
* **Whipsaw potential:** Can generate conflicting signals in choppy markets
## Best Practices
**Effective Usage:**
- Focus on divergences rather than absolute overbought/oversold levels
- Combine with trend analysis for context
- Use multiple timeframe analysis for confirmation
- Pay attention to the speed of momentum changes
**Common Mistakes:**
- Over-relying on overbought/oversold levels in strong trends
- Ignoring the underlying trend direction
- Using inappropriate period settings for the market being analyzed
- Trading every divergence without additional confirmation
**Signal Enhancement:**
- Combine with volume analysis for confirmation
- Use price action context (support/resistance levels)
- Consider market volatility when setting thresholds
- Look for convergence across multiple momentum indicators
## Historical Context and Development
The Ultimate Oscillator was developed by Larry Williams and introduced in his 1985 article "The Ultimate Oscillator" in Technical Analysis of Stocks and Commodities magazine. Williams designed it to address the limitations of single-period oscillators by:
- Reducing false signals through multi-timeframe analysis
- Maintaining sensitivity to short-term momentum changes
- Providing more reliable divergence signals
- Creating a more robust momentum measurement tool
The indicator has become a standard tool in technical analysis, particularly valued for its divergence detection capabilities and its balanced approach to momentum measurement.
## References
* Williams, L. R. (1985). The Ultimate Oscillator. Technical Analysis of Stocks and Commodities, 3(4).
* Williams, L. R. (1999). Long-Term Secrets to Short-Term Trading. Wiley Trading.

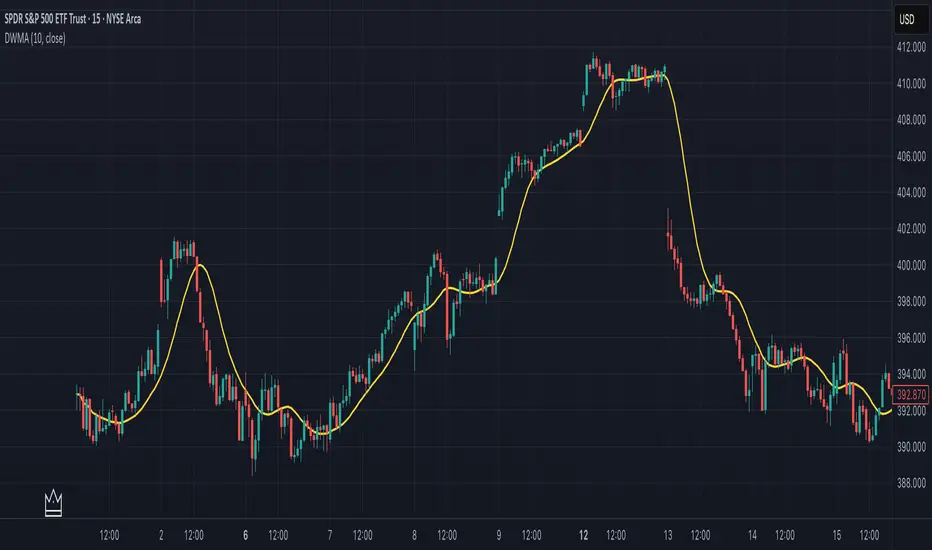
Double Weighted Moving Average (DWMA)# DWMA: Double Weighted Moving Average
## Overview and Purpose
The Double Weighted Moving Average (DWMA) is a technical indicator that applies weighted averaging twice in sequence to create a smoother signal with enhanced noise reduction. Developed in the late 1990s as an evolution of traditional weighted moving averages, the DWMA was created by quantitative analysts seeking enhanced smoothing without the excessive lag typically associated with longer period averages. By applying a weighted moving average calculation to the results of an initial weighted moving average, DWMA achieves more effective filtering while preserving important trend characteristics.
## Core Concepts
* **Cascaded filtering:** DWMA applies weighted averaging twice in sequence for enhanced smoothing and superior noise reduction
* **Linear weighting:** Uses progressively increasing weights for more recent data in both calculation passes
* **Market application:** Particularly effective for trend following strategies where noise reduction is prioritized over rapid signal response
* **Timeframe flexibility:** Works across multiple timeframes but particularly valuable on daily and weekly charts for identifying significant trends
The core innovation of DWMA is its two-stage approach that creates more effective noise filtering while minimizing the additional lag typically associated with longer-period or higher-order filters. This sequential processing creates a more refined output that balances noise reduction and signal preservation better than simply increasing the length of a standard weighted moving average.
## Common Settings and Parameters
| Parameter | Default | Function | When to Adjust |
|-----------|---------|----------|---------------|
| Length | 14 | Controls the lookback period for both WMA calculations | Increase for smoother signals in volatile markets, decrease for more responsiveness |
| Source | close | Price data used for calculation | Consider using hlc3 for a more balanced price representation |
**Pro Tip:** For trend following, use a length of 10-14 with DWMA instead of a single WMA with double the period - this provides better smoothing with less lag than simply increasing the period of a standard WMA.
## Calculation and Mathematical Foundation
**Simplified explanation:**
DWMA first calculates a weighted moving average where recent prices have more importance than older prices. Then, it applies the same weighted calculation again to the results of the first calculation, creating a smoother line that reduces market noise more effectively.
**Technical formula:**
```
DWMA is calculated by applying WMA twice:
1. First WMA calculation:
WMA₁ = (P₁ × w₁ + P₂ × w₂ + ... + Pₙ × wₙ) / (w₁ + w₂ + ... + wₙ)
2. Second WMA calculation applied to WMA₁:
DWMA = (WMA₁₁ × w₁ + WMA₁₂ × w₂ + ... + WMA₁ₙ × wₙ) / (w₁ + w₂ + ... + wₙ)
```
Where:
- Linear weights: most recent value has weight = n, second most recent has weight = n-1, etc.
- n is the period length
- Sum of weights = n(n+1)/2
**O(1) Optimization - Inline Dual WMA Architecture:**
This implementation uses an advanced O(1) algorithm with two complete inline WMA calculations. Each WMA uses the dual running sums technique:
1. **First WMA (source → wma1)**:
- Maintains buffer1, sum1, weighted_sum1
- Recurrence: `W₁_new = W₁_old - S₁_old + (n × P_new)`
- Cached denominator norm1 after warmup
2. **Second WMA (wma1 → dwma)**:
- Maintains buffer2, sum2, weighted_sum2
- Recurrence: `W₂_new = W₂_old - S₂_old + (n × WMA₁_new)`
- Cached denominator norm2 after warmup
**Implementation details:**
- Both WMAs fully integrated inline (no helper functions)
- Each maintains independent state: buffers, sums, counters, norms
- Both warm up independently from bar 1
- Performance: ~16 operations per bar regardless of period (vs ~10,000 for naive O(n²) implementation)
**Why inline architecture:**
Unlike helper functions, the inline approach makes all state variables and calculations visible in a single scope, eliminating function call overhead and making the dual-pass nature explicit. This is ideal for educational purposes and when debugging complex cascaded filters.
> 🔍 **Technical Note:** The dual-pass O(1) approach creates a filter that effectively increases smoothing without the quadratic increase in computational cost. Original O(n²) implementations required ~10,000 operations for period=100; this optimized version requires only ~16 operations, achieving a 625x speedup while maintaining exact mathematical equivalence.
## Interpretation Details
DWMA can be used in various trading strategies:
* **Trend identification:** The direction of DWMA indicates the prevailing trend
* **Signal generation:** Crossovers between price and DWMA generate trade signals, though they occur later than with single WMA
* **Support/resistance levels:** DWMA can act as dynamic support during uptrends and resistance during downtrends
* **Trend strength assessment:** Distance between price and DWMA can indicate trend strength
* **Noise filtering:** Using DWMA to filter noisy price data before applying other indicators
## Limitations and Considerations
* **Market conditions:** Less effective in choppy, sideways markets where its lag becomes a disadvantage
* **Lag factor:** More lag than single WMA due to double calculation process
* **Initialization requirement:** Requires more data points for full calculation, showing more NA values at chart start
* **Short-term trading:** May miss short-term trading opportunities due to increased smoothing
* **Complementary tools:** Best used with momentum oscillators or volume indicators for confirmation
## References
* Jurik, M. "Double Weighted Moving Averages: Theory and Applications in Algorithmic Trading Systems", Jurik Research Papers, 2004
* Ehlers, J.F. "Cycle Analytics for Traders," Wiley, 2013
CCI [Hash Adaptive]Adaptive CCI Pro: Professional Technical Analysis Indicator
The Commodity Channel Index is a momentum oscillator developed by Donald Lambert in 1980. CCI measures the relationship between an asset's price and its statistical average, identifying cyclical turns and overbought/oversold conditions. The indicator oscillates around zero, with values above +100 indicating overbought conditions and values below -100 suggesting oversold conditions.
Standard CCI Formula: (Typical Price - Moving Average) / (0.015 × Mean Deviation)
This indicator transforms the traditional CCI into a sophisticated visual analysis tool through several key enhancements:
Implements dual exponential moving average smoothing to eliminate market noise
Preserves signal integrity while reducing false signals
Adaptive smoothing responds to market volatility conditions
Dynamic Color Visualization System
Continuous gradient transitions from red (bearish momentum) to green (bullish momentum)
Real-time color intensity reflects momentum strength
Eliminates discrete color jumps for fluid visual interpretation
Adaptive Intelligence Features
Dynamic overbought/oversold thresholds adapt to market conditions
Reduces false signals during high volatility periods
Maintains sensitivity during low volatility environments
Momentum Vector Analysis
Incorporates velocity calculations for early trend identification
Crossover detection with momentum confirmation
Advanced signal filtering reduces market noise
Extreme Level Analysis
Values above +100: Strong overbought conditions, potential reversal zones
Values below -100: Strong oversold conditions, potential buying opportunities
Zero-line crossovers: Momentum shift confirmation
Optimization Parameters
CCI Period (Default: 14)
Shorter periods (10-12): Increased sensitivity, more signals
Standard periods (14-20): Balanced responsiveness and reliability
Longer periods (21-30): Reduced noise, stronger signal confirmation
Smoothing Factor (Default: 5)
Lower values (1-3): Maximum responsiveness, suitable for scalping
Medium values (4-6): Balanced approach for swing trading
Higher values (7-10): Institutional-grade smoothness for position trading
Signal Sensitivity (Default: 6)
Conservative (7-10): High-probability signals, reduced frequency
Balanced (5-6): Optimal risk-reward ratio
Aggressive (1-4): Maximum signal generation, requires additional confirmation
Strategic Implementation
Oversold reversals in red zones with momentum confirmation
Zero-line breaks with sustained color transitions
Extreme readings followed by momentum divergence
Risk Management
Use extreme levels (+100/-100) for position sizing decisions
Monitor color intensity for momentum strength assessment
Combine with price action analysis for comprehensive market view
Market Context Application
Trending markets: Focus on momentum direction and extreme readings
Range-bound markets: Utilize overbought/oversold levels for mean reversion
Volatile markets: Increase smoothing parameters and signal sensitivity
Professional Advantages
Instantaneous momentum assessment through color visualization
Reduced cognitive load compared to traditional oscillators
Professional presentation suitable for client reporting
Adaptive Technology
Self-adjusting parameters reduce manual optimization requirements
Consistent performance across varying market conditions
Advanced mathematics eliminate common CCI limitations
The Adaptive CCI Pro represents the evolution of momentum analysis, combining Lambert's foundational CCI concept with modern computational techniques to deliver institutional-grade market intelligence through an intuitive visual interface.

iFVG Strategie by Futures.RobbyiFVG Strategy Checklist by Futures.Robby
Updated: October 27, 2025
Description
This script is a manual checklist designed to help traders evaluate their setups based on the iFVG (Fair Value Gap) strategy. It serves solely as a visual aid and does not perform automatic analysis, signal generation, or trade execution.
How It Works
The script creates an interactive checklist directly on the chart. Traders manually select which criteria are met, and the script calculates a percentage score, displaying it with color coding:
Green (≥ 60%): Good fulfillment of criteria
Orange (40–59%): Partial fulfillment
Red (< 40%): Poor fulfillment
Checklist Criteria
The checklist is divided into two main sections:
1. Trade Criteria (8 Points)
Eight manually selectable criteria to assess setup quality:
Trade im Bias → Trade in Bias: Trade follows the higher timeframe trend (H1/H4/Daily).
BE Level → BE Level: Swing point between entry and target.
Sweep → Sweep: Price hits a key swing before reversing.
Displacement → Displacement: iFVG broken by strong candles.
Leg FVG geschlossen → Leg FVG Closed: No open m1 to m5 FVGs to target.
FVG Reaktion → FVG Reaction: Reaction at FVG during sweep (HTF).
FVG Größe → FVG Size: 6 to 10 points.
Anzahl Kerzen → Number of Candles: Maximum of 6 candles.
2. Goals (1 Point)
Six optional goal conditions, counted together as 1 point:
Equal H / L → Equal High/Low
Session H / L → Session High/Low
News H / L → News High/Low
HTF Swing Point → HTF Swing Point
HTF OB → HTF Order Block
HTF FVG → HTF FVG
Settings and Customization
The script’s settings are translated as follows:
Group: Trade Criteria
Trade im Bias → Trade in Bias
Tooltip: Trendrichtung folgt HTF (H1/H4/Täglich) – Trend follows HTF direction
BE Level → BE Level
Tooltip: Swingpunkt zwischen Einstieg und Ziel – Swing point between entry and target
Sweep → Sweep
Tooltip: Kurs erreicht markanten Swing – Price hits key swing before inverse
Displacement → Displacement
Tooltip: iFVG durch starke Kerzen gebrochen – iFVG broken by strong candles
Leg FVG geschlossen → Leg FVG Closed
Tooltip: Keine offenen m1 bis m5 FVGs bis Ziel – No open m1 to m5 FVGs to target
FVG Reaktion → FVG Reaction
Tooltip: Reaktion an FVG beim Sweep (HTF) – Reaction at FVG during sweep (HTF)
FVG Größe → FVG Size
Tooltip: 6 bis 10 Punkte – 6 to 10 points
Anzahl Kerzen → Number of Candles
Tooltip: Maximal 6 Kerzen – Maximum of 6 candles
Group: Goals
Equal H / L → Equal High/Low
Session H / L → Session High/Low
News H / L → News High/Low
HTF Swing Point → HTF Swing Point
HTF OB → HTF Order Block
HTF FVG → HTF FVG
ℹ️ Ziele zählen gemeinsam als 1 Punkt → ℹ️ Goals count together as 1 point
Window Position & Size
Fensterposition → Window Position
oben rechts → top right
oben links → top left
unten rechts → bottom right
unten links → bottom left
Tabellengröße → Table Size
normal → normal
small → small
tiny → tiny
Translation of Chart Table Contents
The table headers and entries on the chart are translated as follows:
Table Headers:
Trade Checkliste → Trade Checklist
Ziele → Goals
Status Symbols:
✅ → ✅ (Fulfilled)
❌ → ❌ (Not fulfilled)
Individual Criteria (Trade Criteria):
Trade im Bias → Trade in Bias
BE Level → BE Level
Sweep → Sweep
Displacement → Displacement
Leg FVG geschlossen → Leg FVG Closed
FVG Reaktion → FVG Reaction
FVG Größe → FVG Size
Anzahl Kerzen → Number of Candles
Individual Criteria (Goals):
Equal H / L → Equal High/Low
Session H / L → Session High/Low
News H / L → News High/Low
HTF Swing Point → HTF Swing Point
HTF OB → HTF Order Block
HTF FVG → HTF FVG
Note Line:
Ziele zählen gemeinsam als 1 Punkt → Goals count together as 1 point
Important Note
This tool is not an automated indicator, but a visual decision aid for traders who want to apply their strategy in a structured and conscious way.

Relative Performance Tracker [QuantAlgo]🟢 Overview
The Relative Performance Tracker is a multi-asset comparison tool designed to monitor and rank up to 30 different tickers simultaneously based on their relative price performance. This indicator enables traders and investors to quickly identify market leaders and laggards across their watchlist, facilitating rotation strategies, strength-based trading decisions, and cross-asset momentum analysis.
🟢 Key Features
1. Multi-Asset Monitoring
Track up to 30 tickers across any market (stocks, crypto, forex, commodities, indices)
Individual enable/disable toggles for each ticker to customize your watchlist
Universal compatibility with any TradingView symbol format (EXCHANGE:TICKER)
2. Ranking Tables (Up to 3 Tables)
Each ticker's percentage change over your chosen lookback period, calculated as:
(Current Price - Past Price) / Past Price × 100
Automatic sorting from strongest to weakest performers
Rank: Position from 1-30 (1 = strongest performer)
Ticker: Symbol name with color-coded background (green for gains, red for losses)
% Change: Exact percentage with color intensity matching magnitude
For example, Rank #1 has the highest gain among all enabled tickers, Rank #30 has the lowest (or most negative) return.
3. Histogram Visualization
Adjustable bar count: Display anywhere from 1 to 30 top-ranked tickers (user customizable)
Bar height = magnitude of percentage change.
Bars extend upward for gains, downward for losses. Taller bars = larger moves.
Green bars for positive returns, red for negative returns.
4. Customizable Color Schemes
Classic: Traditional green/red for intuitive interpretation
Aqua: Blue/orange combination for reduced eye strain
Cosmic: Vibrant aqua/purple optimized for dark mode
Custom: Full personalization of positive and negative colors
5. Built-In Ranking Alerts
Six alert conditions detect when rankings change:
Top 1 Changed: New #1 leader emerges
Top 3/5/10/15/20 Changed: Shifts within those tiers
🟢 Practical Applications
→ Momentum Trading: Focus on top-ranked assets (Rank 1-10) that show strongest relative strength for trend-following strategies
→ Market Breadth Analysis: Monitor how many tickers are above vs. below zero on the histogram to gauge overall market health
→ Divergence Spotting: Identify when previously leading assets lose momentum (drop out of top ranks) as potential trend reversal signals
→ Multi-Timeframe Analysis: Use different lookback periods on different charts to align short-term and long-term relative strength
→ Customized Focus: Adjust histogram bars to show only top 5-10 strongest movers for concentrated analysis, or expand to 20-30 for comprehensive overview
