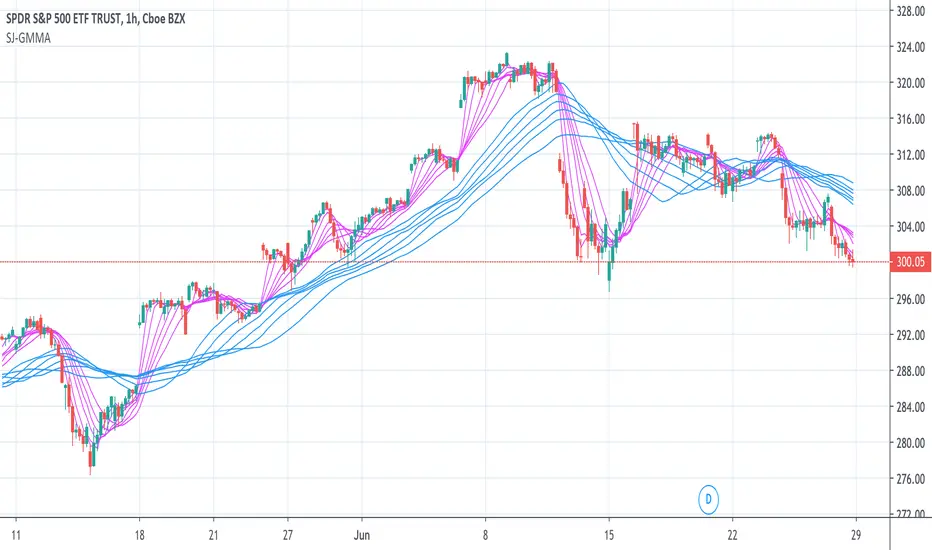
JSun - Guppy Multiple Moving AverAgeThe Guppy Multiple Moving Average (GMMA) is a technical indicator that identifies changing trends, breakouts, and trading opportunities in the price of an asset by combining two groups of moving averages (MA) with different time periods. There is a short-term group of MAs, and a long-term group of MA. Both contain six MAs, for a total of 12. The term gets its name from Daryl Guppy, an Australian trader who is credited with its development.
Key Takeaways:
1. The Gruppy Multiple Moving Average (GMMA) is applied as an overlay on the price chart of an asset.
2. The short-term MAs are typically set at 3, 5, 8, 10, 12, and 15 periods. The longer-term MAs are typically set at 30, 35, 40, 45, 50, and 60.
3. When the short-term group of averages moves above the longer-term group, it indicates a price uptrend in the asset could be emerging.
4. When the short-term group falls below the longer-term group of MAs, a price downtrend in the asset could be starting.
5. When there is lots of separation between the MAs, this helps confirm the price trend in the current direction.
6. If both groups become compressed with each other, or crisscross, it indicates the price has paused and a price trend reversal is possible.
7. Traders often trade in the direction the longer-term MA group is moving, and use the short-term group for trade signals to enter or exit.
Поиск скриптов по запросу "泰国一寺庙被曝藏有40多具尸体"
多重平均线(Multi Moving Average)This is a Multi Moving Average indicator which redesign and translate for Chinese.
这是一个多重平均线(Multi Moving Average)指标。
本脚本的目的在于帮助使用中文的人了解该指标,特别是其用法。同时将该指标代码添加完整的中文注释,方便使用中文的人学习Pine语言。
平均线是最常用的技术分析方法之一。
本指标的特色
相对于官方提供的平均线,本版本平均线指标有两点特色:
1 可以在图表上一次显示多条(最多6条)移动平均线;
2 支持包括SMA、EMA、WMA、HMA、VWMA、RMA等多种平均线,可以根据自己的需求选择相应的平均线。
*注释
SMA:简单移动平均线
EMA:指数加权移动平均线
WMA:加权移动平均线
HMA:船体移动平均线
VWMA:成交量加权移动平均线
RMA:RSI指标中使用的移动平均线,也叫指数加权移动平均线
指标可调节参数
该指标有六个可设置的参数
1 MA1:默认为5;
2 MA2:默认为13;
3 MA3:默认为20;
4 MA4:默认为40;
5 MA5:默认为80;
6 MA6:默认为160。
本指标还有两项可选设置项
1 价格源:价格源默认使用收盘价,但是你还可以选择使用开盘价、最高价、最低价等其他的价格计算方式;
2 选择使用的MA类型;

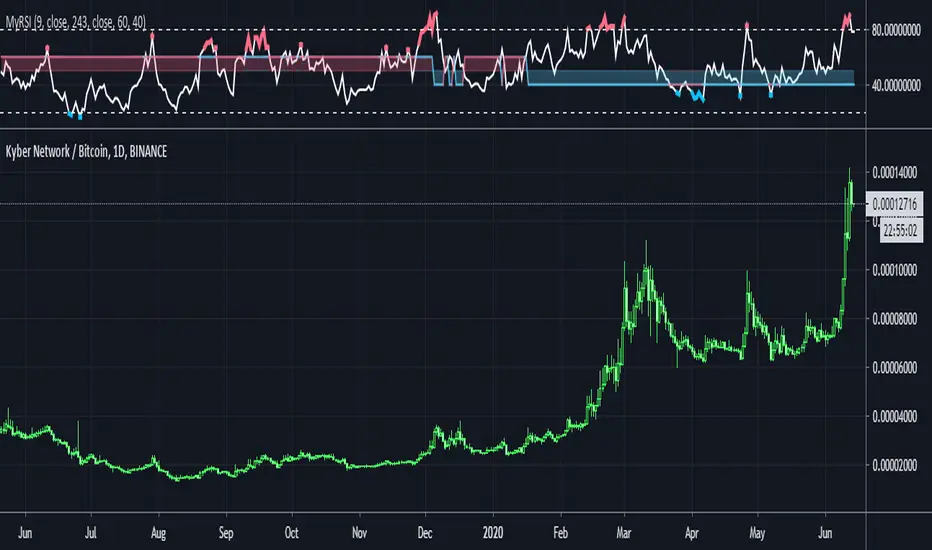
MyRSITrend colored support/resistance based on MA. Can toggle between EMA / SMA .
Trend = Close > MA or Close < MA
Default support in uptrend = 40 RSI
Default resistance in downtrend = 60 RSI
RSI Overbought/Oversold colors also linked to trend.
Ehlers Decycler [CC]The Decycler was created by John Ehlers (Cycle Analytics For Traders pgs 40-41) and this is a moving average that has an extremely low lag even though it uses a fairly high length to calculate everything. This can also work well as a trendline. Buy when the indicator line is green and sell when it is red.
Let me know if there are other scripts you would like to see me publish or if you want something custom done!

Twin Range Filter Algo@Colinmck used two different ranges to generate signals. Read his release notes to find out what the original script does.
I added one condition which seems to increase performance on 15m BTCUSD as well as 1h BTCUSD and that is ATR with 32 periods being smaller than ATR with 64 periods. I used my script Volatility Optimiser to discover this tendency.
Both buying and selling conditions are same as in @Colinmck's script plus one condition of my own. You can disable my condition.
Target and stop-loss are manually set values in ticks.
Time stop-loss is manually set value in a number of candles. After this number of candles, a position always exits (or should 😇). You can disable it by inserting a very long period. I do not recommend it, because a value of indicator should not be measured in luck and if market starts moving in the direction after 40 periods, the predictive capability of an indicator is questionable.
I used 300/150/17 for 15m BTCUSD chart and 900/30/17 for 1h BTCUSD. I didn't try to optimize any other parameters for these periods.
Since this script relies mostly on volatility for its prediction, I wouldn't recommend using it on its own. Individual approach to the market is recommended. Also, it didn't work on EURUSD when using the same default values and different order management (tp, sl, time sl), so it is probably not as versatile.
Let me know what do you think of this strategy. If you have some ideas about how to make it more reliable, share it in the comments, I might put it to the test. Good luck 🍀

{INDYAN} RSI + MACDModded RSI and MACD for intraday use. If rsi above 60 and macd is above zero line then go for buy and if rsi is below 40 and macd below zero line then go for sell side. use it in small timeframe i.e. 3 minute or less.
better for scalp trading
Happy Trading
Love INDYAN
#It can be used best with INDYAN Go With Trend

DARYL GUPPY'S MMA (MULTIPLE MOVING AVERAGES)This script plots 2 separate bundles of moving averages, consisting of 6 different MAs each, with the goal to avoid some false signal provided by individual MAs, and was designed by Daryl Guppy, an Australian trader.
The first bundle consists of 6 "fast" MAs (default width: 3, 5, 8, 10, 12, 15 periods) and is highlighted in blue. The second consists of 6 "slow" MAs (default width: 30, 35, 40, 45, 50, 60 periods) and is highlighted in orange. However I made it possible to modify the width for each MA. The original Daryl Guppy's MMA is made of EMAs, however this script also includes the possibility to plot SMAs instead.
From an operational point of view, those bundles act like individual MAs. So the trader should watch for crosses, convergences and divergencies between the 2 bundles and between the individual averages.

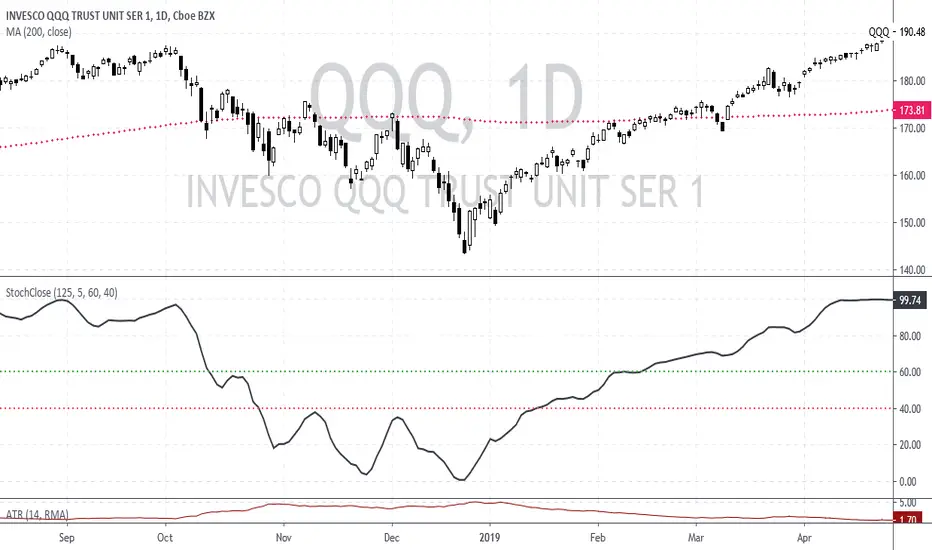
Stochastic based on Closing Prices - Identify and Rank TrendsStochClose is a trend indicator that can be used on its own to measure trend strength, in a scan to rank a group of securities according to trend strength or as part of a trend following strategy. Moreover, it acts as a volatility-adjusted trend indicator that puts securities on an equal footing.
StochClose measures the location of the current close relative to the close-only high-low range over a given period of time. In contrast to the traditional Stochastic Oscillator, this indicator only uses closing prices. Traditional Stochastic uses intraday highs and lows to calculate the range. The focus on closing prices reduces signal noise caused by intraday highs and lows, and filters out errant or irrationally exuberant price spikes.
Here are some examples when the high or low was out of proportion and suspect. Perhaps most famously, there were errant spike lows in dozens of ETFs in August 2015 (XLK, IJR, ITB). There were other spikes in VMBS (October 2014), IJR (October 2008) and KRE (May 2011). Elsewhere, there were suspicious spikes in IEI (April 2020), CHD (March 2020), CCRN (March 2020) and FNB (March 2020)
The preferred setting to identify medium and long-term uptrends is 125 days with 5 days smoothing. 125 days covers around six months. Thus, StochClose(125,5) is a 5-day SMA of the 125-day Stochastic based on closing prices. Smoothing with the 5-day SMA introduces a little lag, but reduces whipsaws and signal noise.
StochClose fluctuates between 0 and 100 with 50 as the midpoint. Values above 80 indicate that the current price is near the high end of the 125-day range, while values below 20 indicate that price is near the low end of the range. For signals, a move above 60 puts the indicator firmly in the top half of the range and points to an uptrend. A move below 40 puts the indicator firmly in the bottom half of the range and points to a downtrend.
StochClose values can also be ranked to separate the leaders from the laggards. In contrast to Rate-of-Change and Percentage Above/Below a Moving Average, StochClose acts as a volatility-adjusted indicator that can identify trend strength or weakness. The Consumer Staples SPDR is unlikely to win in a Rate-of-Change contest with the Technology SPDR. However, it is just as easy for the Consumer Staples SPDR to get in the top of its range as it is for the Technology SPDR. StochClose puts securities on an equal footing.
StochClose measures trend direction and trend strength with one number. The indicator value tells us immediately if the security is trending higher or lower. Furthermore, we can compare this value against the values for other securities. Securities with higher StochClose values are stronger than those with lower values.
Relative Strength Index custom lines and fillingI changed this RSI oscillator to give everyone ability to change position of strategic lines as RSI has a lot more to offer than only overbought and oversold boundries. You can change overbought and oversold line and make one more space depend what you are looking for. For me and as default it is 40-60 range. I put a center line at 50.

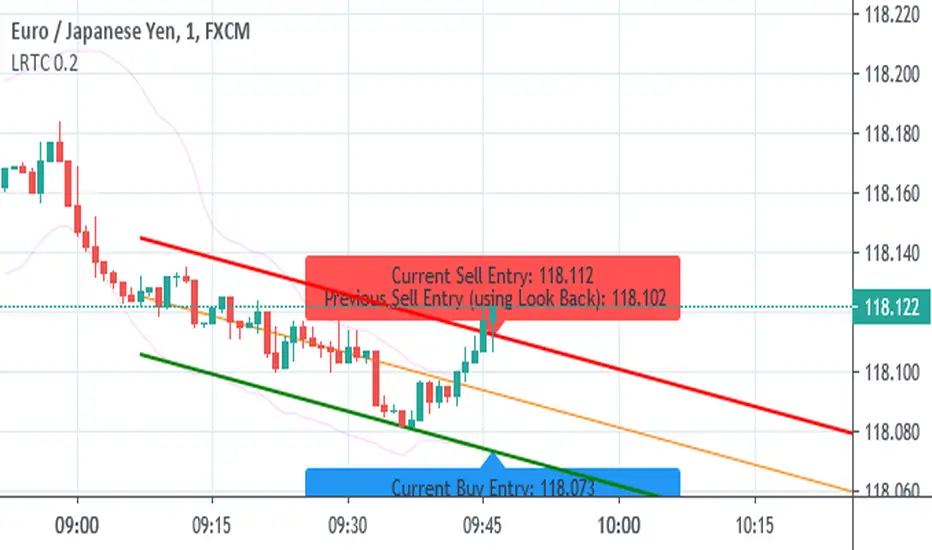
Linear Regression Trend Channel with Entries & AlertsPlease Use this Indicator If you understand the risk posed by linear regression trend channel
Features
Provides trend channel (best value for period is 40 on 5 minute timeframe
Provides BUY/SELL entries based on current channel
Provides custom color for channel
Best used with MattyPips strategy indicators
Risks : Please note, this script is the likes of Bollinger bands and poses a risk of falling in a trend range.
Entries may keep running on the same direction while the market is moving.
Dynamic Support and ResistanceSupport is a price level where a downtrend can be expected to pause due to a concentration of demand or buying interest. As the price of assets or securities drops, demand for the shares increases, thus forming the support line.
Meanwhile, resistance zones arise due to selling interest when prices have increased.s their name implies, dynamic support and resistance levels change their level with each new price-tick.To draw dynamic support and resistance levels, traders usually use moving averages which are automatically drawn by your trading platform. The 200-day exponential moving average (EMA), 100-day EMA, and 20-30-40-50-day EMA are very popular dynamic support and resistance levels.also in some references Williams Fractal level used for dynamic support and resistance levels. and it also includes other support and resistance levels that are projected based on the pivot point calculation. All these levels help traders see where the price could experience support or resistance. Similarly, if the price moves through these levels it lets the trader know the price is trending in that direction.

Ribbon_Arshiin this indicator
moving average 20-25-30-35-40-50-100-200 with fractal added to the chart.

Crypto McClellan OscillatorMcClellan Oscillator for cryptocurrency, taking into account only the top 40 cryptos.
Original code was by LazyBear.

Strategy - Bobo PAPATRHi I've revamped this bot mentioned in the linked idea to make it work with v4 of pine. In doing so there are some very significant changes to how it works. The main one is that it no longer uses traditional daily pivot calculations to calculate the bands. It creates a more dynamic intraday set of pivot points based on recent price action rather than yesterday's ohlc. As published, the bot is tuned for a 15 min time frame. But it actually works well on lower time frames you just need to adjust the lookback periods in settings a bit to re tune it. It's also tuned to ES really but will need tweaking for a different instrument at the very least.
The basic concept is recent price action is used to calculate a 'middle' around which red and green bands are located. Their position or width is largely determined by recent volatility. The middle line is again calculated from recent price action. The three lines from that form a tradeable range with green at the top and red at the bottom. The strategy is simple enough, it shorts as it sinks from outside red, and longs when rising above green. The basic principle being that once you enter that range you have a high probability of hitting the middle before you hit your stop loss. So the basic principle is you are trying to capture the inherent ranginess of liquid indices like S&P 500. That back and forth movement that happens. The bot is capturing this by fading extremes of a recent range but the problem with that is you'dd get murdered in a strong trend. To mitigate that there is a trend calculation running in the background the will prevent trading against firm trends mostly. So the bot should trade mostly in rangy conditions because that is what it is trying to do.
Bot will close issue close signals automatically upon crossing the middle, it also will close automatically at predefined stops or limits. These values are denominated in market mintick values. For example the CFD SPX500 has a mintick of 0.1. Therefore a stop value of 100 will equate to 10 points on the index. If trading the same market via ES1! the mintick value is different - 0.25. So in this case a value of 40 is required to set the stop at 10 points.
Anyway shout if you have questions. Hope it's useful.
TVC:SPX OANDA:SPX500USD

Custom EMA AngleThis script shows the angle of 6 EMAs to perform trade analysis. The EMA angle is also known as its Rate Of Change ( ROC ). The 6 EMAs (I, II, III , IV, V and VI ) default lengthes come from one of the Fibonacci Phi^3 and Phi^3/2 sub series (17, 34, 72, 144, 305 and 610), but can be changed to any values, particularly to the traditionally used 20, 40, 50, 100, 200 and 300. Up to my knowledge, Fibonacci Phi^3 and Phi^3/2 sub series lengthes were first proposed by Bo Williams.
Angle calculation is performed by calculating the tangent over a delta interval. Normalization is required to make the angle independent of the price range.
This script is meant to be used together with the corresponding EMAs on the candle pane. Non normalized view shows a more realistic angle condition but, if intended to be used with the CEMAS indicator, normalized view should be used.

Custom EMA + FIBOThis script combines 6 EMAs with 3 Donchian Channel 78.6% and 21.4% intermediary level lines to perform trade analysis. The 6 EMAs (I, II, III , IV, V and VI ) default lengthes come from one of the Fibonacci Phi^3 and Phi^3/2 sub series (17, 34, 72, 144, 305 and 610), but can be changed to any values, particularly to the traditionally used 20, 40, 50, 100, 200 and 300. Up to my knowledge, Fibonacci Phi^3 and Phi^3/2 sub series lengthes were first proposed by Bo Williams.
The 3 Donchian Channels used have default lengthes 72, 305 and 1292, calculated after the first length default value of 72. For each of the 3 Donchian Channels only an upper line, set by default at 78.6%, is plotted in green and its complement, set to 21.4%, is plotted in red. When the closing price is above 3 green lines, we say it is Forbidden to Sell ( PV ), and when the closing price is below 3 red lines, we say it is Forbidden to Buy ( PC ). Those conditions are flagged on the chart. These PV-PC conditions were, up to my knowledge, first proposed by Bo Williams.

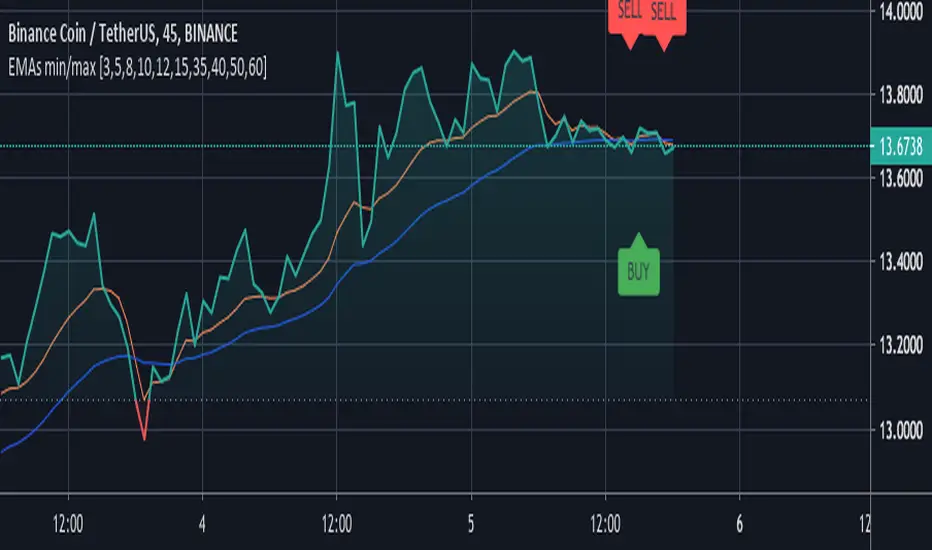
EMAs min/max [3,5,8,10,12,15,35,40,50,60]A very simple script for your trading. I compare ema for many times and draw point for buy/sell.
Check it!
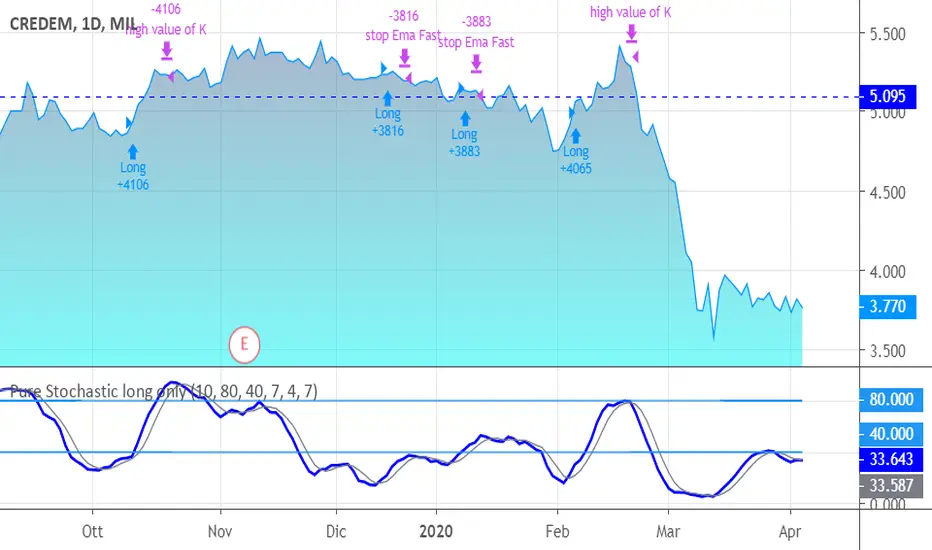
Pure Stochastic long onlyJust a stochastic for giving you a smart and quick signals of entering and exiting.
Your enter is K>D in the low band and close > last bar's high.
An Ema has been added for targeting and stops.
You exit also in case of high values of K or in case D crosses over K but in the "upper".
Length, periods and level of bands are personalized.
The system goes long only, because it fits at best for shares only; I leave you the attemp of writing code for other classes and for going short, in particular.
SUGGESTIONS:
Keep Oversold period high (> 20, also 40-45)
Keep Emaperiodfast higher (> 5)

Rsi Stops - JDThis simple indicator gives you a bias on the market that can be used as a filter, an entry indicator for pullbacks,...
It shows the special relationship I discovered between the rsi and the 27 period ema
and the relation between the 40/60 levels of the rsi and the atr offset of the 27 ema line
Enjoy!
JD.
#NotTradingAdvice
#DYOR

Support Resistance - DynamicThis is Dynamic Support / Resistance script.
How it Works?
It finds Pivot Points and creates channels for each Pivot Point. Channel size is calculated by (Highest - Lowest) * %Channel_size in Loopback Period. After creating channels it calculates that how many Pivot Points in the channels. more Pivot Points in channel means stronger Support/Resistance. in the option menu there is S/R Strength, this is the minimum number of Pivot Points that each channel must contain to be S/R. calculation starts from last pivot point and go back for "loopback period" which is 300 by default. so last Pivot Points have more priority. Finally after calculating Support/Resistance it draws lines.
Number of Support/Resistance line is Dynamic and up to 20 lines, that means number of lines changes dynamically. you can see how the script puts Suppport/Resistance lines dynamically by "Replay" button. (if I have time I will try to put a video)
Currently the scripts checks up to 40 pivot points in loopback period. it shows up to 20 S/Rs only for visible area in the chart.
There is option to Show S/R lines as Solid, Dotted or Dashed.
Enjoy!

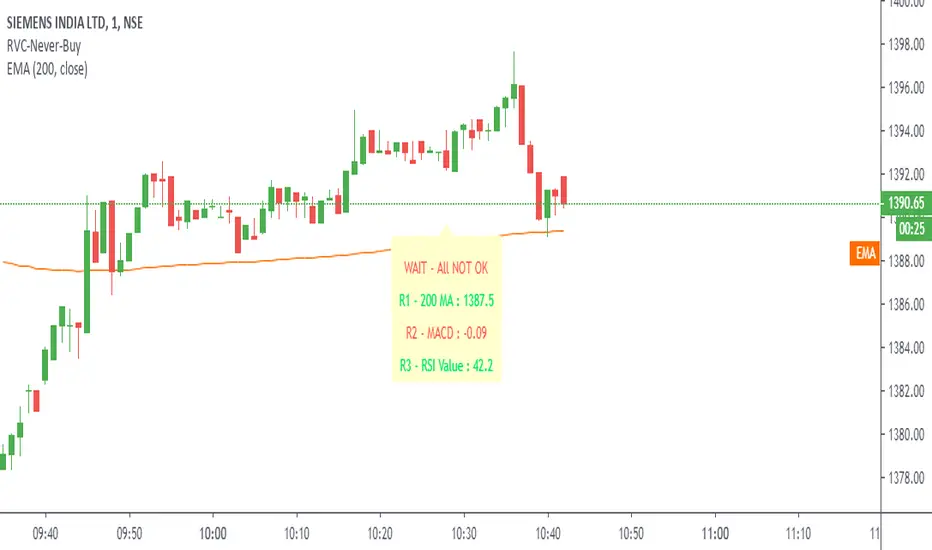
Never Buy rules Whatever may be the market cap .... doesn't matter
if you are planning to buy a script, please check 200 day avg, MACD and RSI levels
1. Never buy a stock trading below the 200-day Moving Average
2. Never Buy a stock with MACD below 0
3. Never buy stock with an RSI below 40
Script is written in simple terms, easy to understand and modify.
Zahorchak MeasureCreator: Michael G. Zahorchak.
References:
The Art of Low Risk Investing by Michael G. Zahorchak, 1977. Unfortunately, it's all but impossible to find a copy these days.
The Complete Guide to Market Breadth Indicators by Gregory L. Morris, 2006. A fantastic resource for those interested in Technical Analysis or creating their own trend based system.
Two articles by Greg Morris on the Zahorchak Measure. I can't link to them under the House Rules, but they are easily searchable.
The Zahorchak Measure (ZM) is designed to give you a market bias (either uptrend or downtrend) which you can use to determine a trade bias for ETF's or stocks.
ZM works by taking multiple moving averages of the NYSE Composite, a moving average of the NYSE advance decline line, and examining the relationship between those elements. Broadly, the market is considered to be in a uptrend when ZM is above zero, and a downtrend when below. However, there are many ways to interpret the indicator.
The version created by Greg Morris is more akin to a binary indicator in that ZM jumps from number to number. This version is smoothed to create an oscillator as it reduces whipsaws (at the expense of lag). You can set the EMA Length to 1 to go back to the original.
Some notes:
Michael Zahorchak called it the "Zahorchak Method", whereas Greg Morris uses the term "Measure". I'm not totally clear on the change, but Mr. Morris made some changes (covered below), so that may explain the altered name.
The original indicator used moving averages of 5, 15, and 40 weeks. I have converted these to daily numbers as that's the time frame I most commonly trade. You can convert the numbers back by dividing by 5.
The original indicator used the Dow Industrials for the moving averages, however Greg Morris switched to the NYSE Composite due to the advance decline line being based on the NYSE.
Greg Morris removed the 5 period moving average of the NYSE Composite, as it created increased volatility at market tops and bottoms. I tested ZM with the 5 period MA added back in, and I believe removing it creates a superior indicator.
I've added both Multi Time Frame functionality, and the ability to alter moving average lengths. Play around and see what you can come up with.
ZM oscillates between -10 and +10. There are some interesting levels creating between these two numbers (apart from the obvious zero level) - see what you can come up with.
All credit goes to Michael Zahorchak and Greg Morris for the indicator creation. I have simply reproduced their work for the TradingView community as this great indicator wasn't available.
Any queries let me know in the comments or PM me.
DD.
