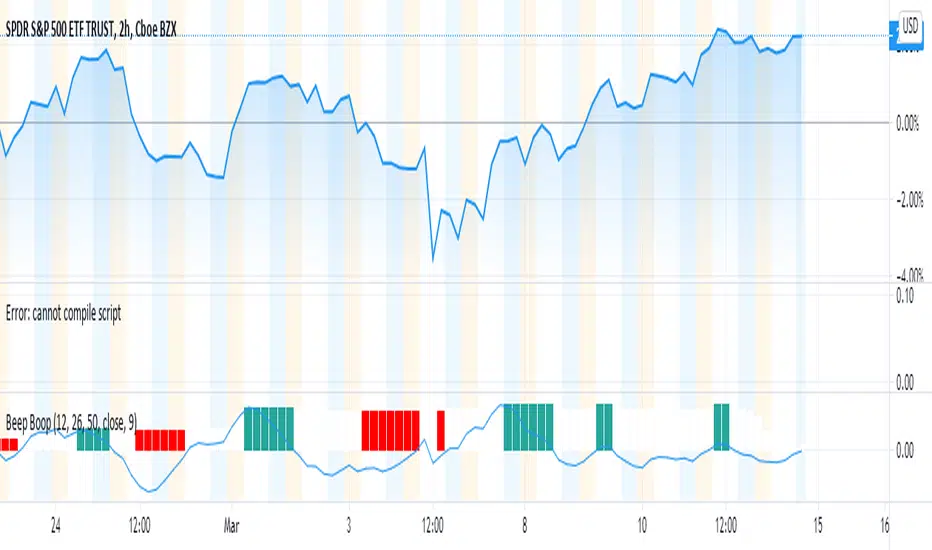
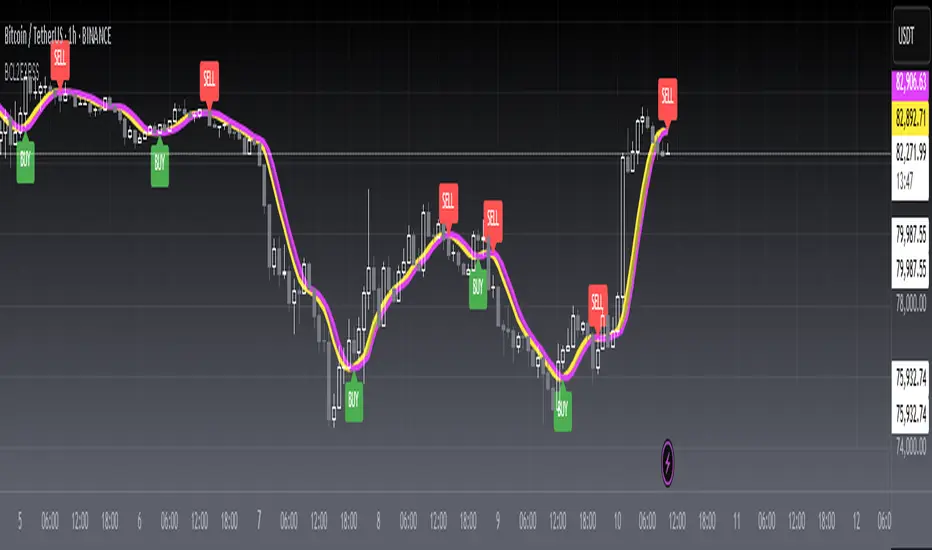
Beep Boop(Improved) Beep Boop Indicator for Trending Markets originally written by Trading Rush.
It is originally based on the MACD 12-26 and the 50 bar EMA.
The macd hist is color coded with green as buy and sell as red.
I added an option to use a couple of lower lag ema's (See line 13 - ema_signal).
Поиск скриптов по запросу "细算江西救护车家长倒赚了四万三+-医疗花费13万(家长视频)++医保报"
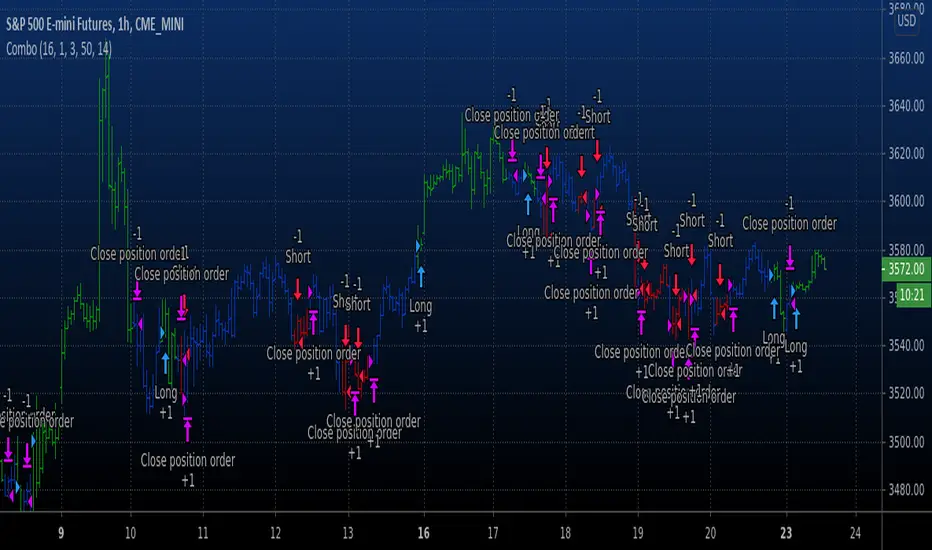
Combo Backtest 123 Reversal & High - EMA Strategy This is combo strategies for get a cumulative signal.
First strategy
This System was created from the Book "How I Tripled My Money In The
Futures Market" by Ulf Jensen, Page 183. This is reverse type of strategies.
The strategy buys at market, if close price is higher than the previous close
during 2 days and the meaning of 9-days Stochastic Slow Oscillator is lower than 50.
The strategy sells at market, if close price is lower than the previous close price
during 2 days and the meaning of 9-days Stochastic Fast Oscillator is higher than 50.
Second strategy
This indicator plots the difference between the High (of the previous period)
and an exponential moving average (13 period) of the Close (of the previous period).
You can use in the xPrice any series: Open, High, Low, Close, HL2, HLC3, OHLC4 and ect...
It buy if indicator above 0 and sell if below.
WARNING:
- For purpose educate only
- This script to change bars colors.
(mab) Williams %R, RSI, Stochastic and Stochastic RSIThis indicator can display a Williams %R and a second oscillator at the same time. RSI , Stochastic or Stochastic RSI can be displayed as second oscillator. Williams %R is configured with 21 length by default and adds a 13 EMA on it (like used by TRI ). There is an option to display divergences on the oscillators.

Rainbow Ribonacci RSIRainbow Ribonacci RSI is a modified version of RSI with Rainbow Ribbon of Fibonacci period and levels:
RSI lines modified to consists of several Fibonnaci Period Length of 3, 5, 8, 13;
RSI levels modified to contain the Fibonacci Percentage Levels of 78.6%, 61.8%, 50%, 38.2% and 23.6%;
Color fills between RSI lines;
Color fills between RSI levels.
The choice of colors: red-orange-yellow-green-blue-purple are in the order of rainbow colors.
Rainbow Ribonacci: Rainbow Ribbon with Fibonacci

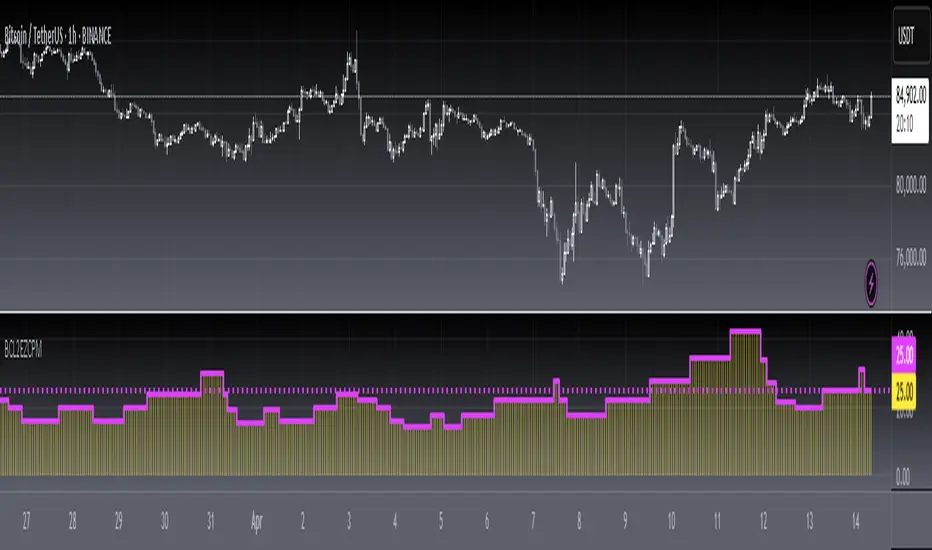
[blackcat] L2 Ehlers Zero Crossings Period MeasurerLevel: 2
Background
John F. Ehlers introuced Zero Crossings Period Measurer in his "Cycle Analytics for Traders" chapter 5 on 2004.
Function
The band-pass filter can be used as a relatively simple measurement of the dominant cycle. A cycle is complete when the waveform crosses zero two times from the last zero crossing. Therefore, each successive zero crossing of the indicator marks a half cycle period. We can establish the dominant cycle period as twice the spacing between successive zero crossings. When we measure the dominant cycle period this way, it is best to widen the pass band of the band-pass filter to avoid distorting the measurement simply due to the selectivity of the filter. Using an input bandwidth of 0.7 produces an octave-wide pass band. For example, if the center period of the filter is 20 and the relative bandwidth is 0.7, the bandwidth is 14. That means the pass band of the filter extends from 13-bar periods to 27-bar periods. That is, roughly an octave exists because the longest period is twice the shortest period of the pass band. It is imperative that a high-pass filter is tuned one octave below the halfbandwidth edge of the band-pass filter to ensure a nominal zero mean of the filtered output. Without a zero mean, the zero crossings can have a substantial error.
Key Signal
DC ---> dominant cycle
Pros and Cons
100% John F. Ehlers definition translation of original work, even variable names are the same. This help readers who would like to use pine to read his book. If you had read his works, then you will be quite familiar with my code style.
Remarks
The 39th script for Blackcat1402 John F. Ehlers Week publication.
Readme
In real life, I am a prolific inventor. I have successfully applied for more than 60 international and regional patents in the past 12 years. But in the past two years or so, I have tried to transfer my creativity to the development of trading strategies. Tradingview is the ideal platform for me. I am selecting and contributing some of the hundreds of scripts to publish in Tradingview community. Welcome everyone to interact with me to discuss these interesting pine scripts.
The scripts posted are categorized into 5 levels according to my efforts or manhours put into these works.
Level 1 : interesting script snippets or distinctive improvement from classic indicators or strategy. Level 1 scripts can usually appear in more complex indicators as a function module or element.
Level 2 : composite indicator/strategy. By selecting or combining several independent or dependent functions or sub indicators in proper way, the composite script exhibits a resonance phenomenon which can filter out noise or fake trading signal to enhance trading confidence level.
Level 3 : comprehensive indicator/strategy. They are simple trading systems based on my strategies. They are commonly containing several or all of entry signal, close signal, stop loss, take profit, re-entry, risk management, and position sizing techniques. Even some interesting fundamental and mass psychological aspects are incorporated.
Level 4 : script snippets or functions that do not disclose source code. Interesting element that can reveal market laws and work as raw material for indicators and strategies. If you find Level 1~2 scripts are helpful, Level 4 is a private version that took me far more efforts to develop.
Level 5 : indicator/strategy that do not disclose source code. private version of Level 3 script with my accumulated script processing skills or a large number of custom functions. I had a private function library built in past two years. Level 5 scripts use many of them to achieve private trading strategy.
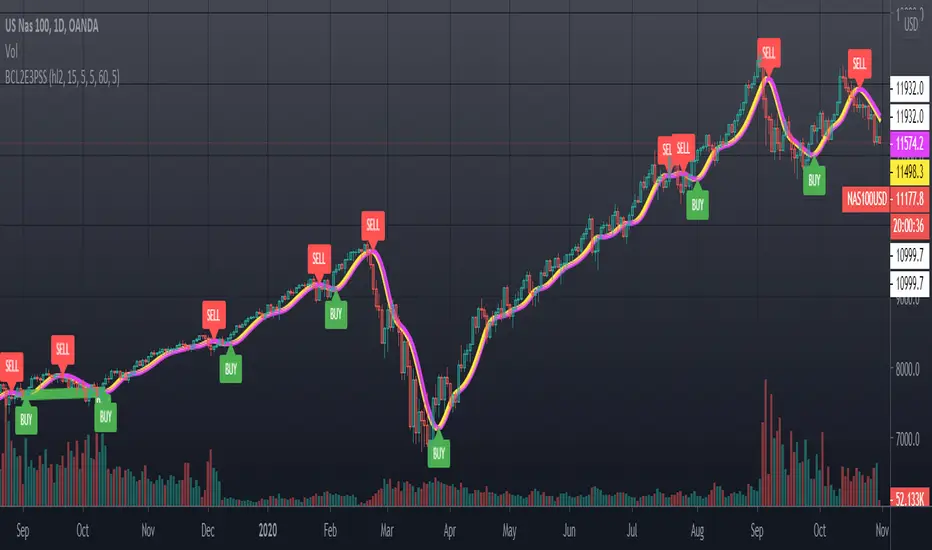
[blackcat] L2 Ehlers Three Pole Super SmootherLevel: 2
Background
John F. Ehlers introuced Three Pole Super Smoother in his "Cybernetic Analysis for Stocks and Futures" chapter 13 on 2004.
Function
The Super Smoother filter is formed by retaining the IIR part of a Butterworth digital filter. The order of Super Smoother filters can be increased indefinitely to increase the sharpness of the filter rejection, just as with Butterworth filters. A three-pole Super Smoother filter has far more attenuation in the reject band than the two-pole filters
Key Signal
Filt3 ---> Three Pole Super Smoother fast line
Trigger ---> Three Pole Super Smoother slow line
Pros and Cons
100% John F. Ehlers definition translation of original work, even variable names are the same. This help readers who would like to use pine to read his book. If you had read his works, then you will be quite familiar with my code style.
Remarks
The 32th script for Blackcat1402 John F. Ehlers Week publication.
Readme
In real life, I am a prolific inventor. I have successfully applied for more than 60 international and regional patents in the past 12 years. But in the past two years or so, I have tried to transfer my creativity to the development of trading strategies. Tradingview is the ideal platform for me. I am selecting and contributing some of the hundreds of scripts to publish in Tradingview community. Welcome everyone to interact with me to discuss these interesting pine scripts.
The scripts posted are categorized into 5 levels according to my efforts or manhours put into these works.
Level 1 : interesting script snippets or distinctive improvement from classic indicators or strategy. Level 1 scripts can usually appear in more complex indicators as a function module or element.
Level 2 : composite indicator/strategy. By selecting or combining several independent or dependent functions or sub indicators in proper way, the composite script exhibits a resonance phenomenon which can filter out noise or fake trading signal to enhance trading confidence level.
Level 3 : comprehensive indicator/strategy. They are simple trading systems based on my strategies. They are commonly containing several or all of entry signal, close signal, stop loss, take profit, re-entry, risk management, and position sizing techniques. Even some interesting fundamental and mass psychological aspects are incorporated.
Level 4 : script snippets or functions that do not disclose source code. Interesting element that can reveal market laws and work as raw material for indicators and strategies. If you find Level 1~2 scripts are helpful, Level 4 is a private version that took me far more efforts to develop.
Level 5 : indicator/strategy that do not disclose source code. private version of Level 3 script with my accumulated script processing skills or a large number of custom functions. I had a private function library built in past two years. Level 5 scripts use many of them to achieve private trading strategy.
[blackcat] L2 Ehlers Two Pole Super SmootherLevel: 2
Background
John F. Ehlers introuced Two Pole Super Smoother in his "Cybernetic Analysis for Stocks and Futures" chapter 13 on 2004.
Function
The transfer response of the two-pole Super Smoother is almost identical to the transfer response of the Regularized filter. The difference between the two is that the characteristics of the Super Smoother are determined by a single parameter and the flatness of the passband response is guaranteed. The order of Super Smoother filters can be increased indefinitely to increase the sharpness of the filter rejection, just as with Butterworth filters.
Key Signal
Filt2 ---> Two Pole Super Smoother fast line
Trigger ---> Two Pole Super Smoother slow line
Pros and Cons
100% John F. Ehlers definition translation of original work, even variable names are the same. This help readers who would like to use pine to read his book. If you had read his works, then you will be quite familiar with my code style.
Remarks
The 31th script for Blackcat1402 John F. Ehlers Week publication.
Readme
In real life, I am a prolific inventor. I have successfully applied for more than 60 international and regional patents in the past 12 years. But in the past two years or so, I have tried to transfer my creativity to the development of trading strategies. Tradingview is the ideal platform for me. I am selecting and contributing some of the hundreds of scripts to publish in Tradingview community. Welcome everyone to interact with me to discuss these interesting pine scripts.
The scripts posted are categorized into 5 levels according to my efforts or manhours put into these works.
Level 1 : interesting script snippets or distinctive improvement from classic indicators or strategy. Level 1 scripts can usually appear in more complex indicators as a function module or element.
Level 2 : composite indicator/strategy. By selecting or combining several independent or dependent functions or sub indicators in proper way, the composite script exhibits a resonance phenomenon which can filter out noise or fake trading signal to enhance trading confidence level.
Level 3 : comprehensive indicator/strategy. They are simple trading systems based on my strategies. They are commonly containing several or all of entry signal, close signal, stop loss, take profit, re-entry, risk management, and position sizing techniques. Even some interesting fundamental and mass psychological aspects are incorporated.
Level 4 : script snippets or functions that do not disclose source code. Interesting element that can reveal market laws and work as raw material for indicators and strategies. If you find Level 1~2 scripts are helpful, Level 4 is a private version that took me far more efforts to develop.
Level 5 : indicator/strategy that do not disclose source code. private version of Level 3 script with my accumulated script processing skills or a large number of custom functions. I had a private function library built in past two years. Level 5 scripts use many of them to achieve private trading strategy.
[blackcat] L2 Ehlers Three Pole Butterworth FilterLevel: 2
Background
John F. Ehlers introuced Three-Pole Butterworth Filter in his "Cybernetic Analysis for Stocks and Futures" chapter 13 on 2004.
Function
The transfer responses of Butterworth filters have polynomials in both the numerator and denominator. There is a polynomial in the numerator as well as the denominator. The significance of the polynomial in the numerator is that it represents the finite impulse response (FIR) part of the filter. This part is like a simple moving average. The denominator forms the iterative part of the filter calculation and is the infinite impulse response (IIR) part of the filter. The FIR part of the filter sharpens the filter rejection response, but it also contributes to lag in the response. Recognizing that the parts of a Butterworth filter are separable, Dr. Ehlers formed the multipole super smoothing filters by simply deleting the polynomial in the numerator. Butterworth filters can have an arbitrarily large number of poles. The passband of Butterworth filters is prescribed by a single parameter. That parameter is the Cutoff Period, where the attenuation of the filter is 3 dB.
Key Signal
Butter ---> Two Pole Butterworth Filter fast line
Trigger ---> Two Pole Butterworth Filter slow line
Pros and Cons
100% John F. Ehlers definition translation of original work, even variable names are the same. This help readers who would like to use pine to read his book. If you had read his works, then you will be quite familiar with my code style.
Remarks
The 30th script for Blackcat1402 John F. Ehlers Week publication.
Readme
In real life, I am a prolific inventor. I have successfully applied for more than 60 international and regional patents in the past 12 years. But in the past two years or so, I have tried to transfer my creativity to the development of trading strategies. Tradingview is the ideal platform for me. I am selecting and contributing some of the hundreds of scripts to publish in Tradingview community. Welcome everyone to interact with me to discuss these interesting pine scripts.
The scripts posted are categorized into 5 levels according to my efforts or manhours put into these works.
Level 1 : interesting script snippets or distinctive improvement from classic indicators or strategy. Level 1 scripts can usually appear in more complex indicators as a function module or element.
Level 2 : composite indicator/strategy. By selecting or combining several independent or dependent functions or sub indicators in proper way, the composite script exhibits a resonance phenomenon which can filter out noise or fake trading signal to enhance trading confidence level.
Level 3 : comprehensive indicator/strategy. They are simple trading systems based on my strategies. They are commonly containing several or all of entry signal, close signal, stop loss, take profit, re-entry, risk management, and position sizing techniques. Even some interesting fundamental and mass psychological aspects are incorporated.
Level 4 : script snippets or functions that do not disclose source code. Interesting element that can reveal market laws and work as raw material for indicators and strategies. If you find Level 1~2 scripts are helpful, Level 4 is a private version that took me far more efforts to develop.
Level 5 : indicator/strategy that do not disclose source code. private version of Level 3 script with my accumulated script processing skills or a large number of custom functions. I had a private function library built in past two years. Level 5 scripts use many of them to achieve private trading strategy.

[blackcat] L2 Ehlers Two Pole Butterworth FilterLevel: 2
Background
John F. Ehlers introuced Two Pole Butterworth Filter in his "Cybernetic Analysis for Stocks and Futures" chapter 13 on 2004.
Function
Dr. Ehlers translated analog Butterworth filters to their digital approximations. The transfer response is characterized by a single variable—the cutoff frequency. The cutoff frequency is that frequency where the input is attenuated by 3 dB. Below the cutoff frequency, the input frequency components are passed to the output; above the cutoff frequency, the input frequency components are rejected to the extent possible by the filter characteristics. Since traders are more comfortable with period, which is the reciprocal of frequency, the equations for the Butterworth digital filters are characterized in terms of the cutoff period.
As opposed to the Regularized filter, the order of Butterworth filters can be increased indefinitely to increase the sharpness of the filter rejection. For traders, this quickly reaches the point of diminishing returns because increasing the number of poles in the filter means the lag of the filter is also increased. A three-pole filter gives just about the limit of tolerable lag for a selected cutoff period.
Key Signal
Butter ---> Two Pole Butterworth Filter fast line
Trigger ---> Two Pole Butterworth Filter slow line
Pros and Cons
100% John F. Ehlers definition translation of original work, even variable names are the same. This help readers who would like to use pine to read his book. If you had read his works, then you will be quite familiar with my code style.
Remarks
The 29th script for Blackcat1402 John F. Ehlers Week publication.
Readme
In real life, I am a prolific inventor. I have successfully applied for more than 60 international and regional patents in the past 12 years. But in the past two years or so, I have tried to transfer my creativity to the development of trading strategies. Tradingview is the ideal platform for me. I am selecting and contributing some of the hundreds of scripts to publish in Tradingview community. Welcome everyone to interact with me to discuss these interesting pine scripts.
The scripts posted are categorized into 5 levels according to my efforts or manhours put into these works.
Level 1 : interesting script snippets or distinctive improvement from classic indicators or strategy. Level 1 scripts can usually appear in more complex indicators as a function module or element.
Level 2 : composite indicator/strategy. By selecting or combining several independent or dependent functions or sub indicators in proper way, the composite script exhibits a resonance phenomenon which can filter out noise or fake trading signal to enhance trading confidence level.
Level 3 : comprehensive indicator/strategy. They are simple trading systems based on my strategies. They are commonly containing several or all of entry signal, close signal, stop loss, take profit, re-entry, risk management, and position sizing techniques. Even some interesting fundamental and mass psychological aspects are incorporated.
Level 4 : script snippets or functions that do not disclose source code. Interesting element that can reveal market laws and work as raw material for indicators and strategies. If you find Level 1~2 scripts are helpful, Level 4 is a private version that took me far more efforts to develop.
Level 5 : indicator/strategy that do not disclose source code. private version of Level 3 script with my accumulated script processing skills or a large number of custom functions. I had a private function library built in past two years. Level 5 scripts use many of them to achieve private trading strategy.

Volatility Bands by DGTVolatility represents how large an asset's prices swing around the mean price, the degree of variation of a trading price over time, and is commonly measured with beta (β) coefficients, standard deviations (σ) of returns where tools such as Average True Range, Bollinger Bands, Keltner Channel, Squeeze Indicator, etc presents volatility concept
Volatility often refers to the amount of uncertainty or risk related to the size of changes in a security's value. The higher the volatility, the riskier the security - the price of the security can change dramatically over a short time period in either direction. A lower volatility - security's value does not fluctuate dramatically, and tends to be more steady
This study, Volatility Bands , attempts to present a way to measure and visualize volatility , using standard deviations (σ) and average true range indicator, and aims to point out areas that might indicate potential trading opportunities
I will try to explain the usage with examples,
same setup with different option selected
as you may observe from the examples different setting may have advantages and disadvantages over one another, it is recommended to verify a trading setup with different available options.
Additionally, It is recommended to use this indicator in conjunction with other technical indicators, or verify using chart/candle patterns. Below is an usage example using in conjunction with other indicator, in the given example “Neglected Volume by DGT” is selected
Similarities and Differences
Bollinger Bands depicts two standard deviations above and below a simple moving average, and Keltner Channel depicts two times average true range (ATR) above and below an exponential moving average
Volatility Bands study combines the approach of both Bollinger Bands and Keltner Channel, with different settings and different visualization
Default settings are one standard deviations and one time average true range (ATR) above and below 13 period exponential moving average. Setting can be adjusted by users but let me remind all testes are performed with the default settings.
Mathematically expressed as
Upper band area between “ema + stdev” and “ema + atr”
Lower band area between “ema – stdev” and “ema – atr”
A different display is added with the inspiration I get from one of the @quantgym ‘s study, many thanks @quantgym 😉
When difference band display is selected the study will reflect the area between “ema + stdev – atr” and “ema – stdev + atr”. As shown in the examples above
Note: standard deviation calculation can be adjusted based on price action or its moving average.
Other differentiation between BB and KC is with V-BANDS mostly we look for trade opportunities when price action move out of the bands and in most cases we assume market is consolidating when the price action is within the bands
The other indicator that presents similarities to Volatility Bands is Squeeze Indicator, which measures the relationship between Bollinger Bands and Keltner's Channels to help identify consolidations and signal when prices are likely to break out. Mainly Volatility Bands is different version of Squeeze indicator, in fact the purpose is almost same but visualization is completely different. Additionally Volatility Bands Offers trading opportunities whereas Squeeze indicator only presents market states unless a momentum indicator is adapted to Squeeze indicator.
Disclaimer:
Trading success is all about following your trading strategy and the indicators should fit within your trading strategy, and not to be traded upon solely
The script is for informational and educational purposes only. Use of the script does not constitute professional and/or financial advice. You alone have the sole responsibility of evaluating the script output and risks associated with the use of the script. In exchange for using the script, you agree not to hold dgtrd TradingView user liable for any possible claim for damages arising from any decision you make based on use of the script

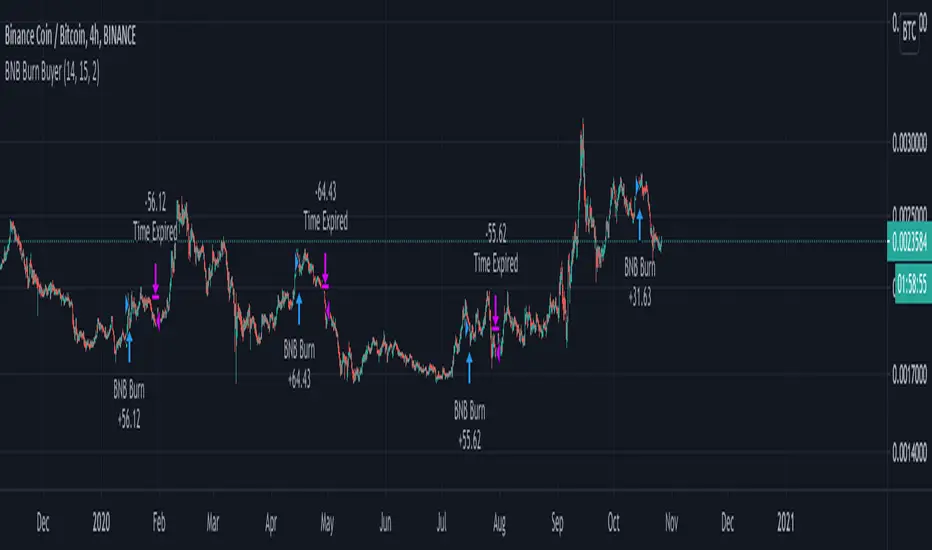
BNB Burn BuyerThis strategy is only meant to be used on BNB.
It's more of an inconclusive analysis of the effect of BNB's quarterly coin burn.
To date there have been 13 coin burns.
According to Binance's whitepaper, each quarter, they will burn BNB based on their trading volume until 50% of all BNB is burned. They eventually will destroy 100MM BNB, leaving 100MM BNB remaining.
Historically, coin burns for the 3rd quarter happen around October 17th-18th. So keep an eye out for those dates.
I built this strategy to run some experiments and test the fundamental effect a known coin burn has on the price. So far more testing is needed. So leave your insights and comments below!
Bar Delta SentimentScript that accumulates the magnitude of positive and negative bar change deltas. These differences are used to estimate market sentiment. When the sentiment line crosses the zero line downwards the sentiment is bearish and when it crosses it upwards it is bullish.
To enable the indicator to add value as a leading indicator, the ema of the sentiment line is plotted. When the sentiment line crosses below the ema it indicates a possible shift to a bearish market, and when it crosses above the ema it indicates the possibility of the market turning bullish.
The indicator can be used on all time-frames and all symbols. In general it works best when the length is quite short, like a 13, 21, but the user can play around with the settings a bit depending on the symbol and time frame in use.

EMA ICHI BB [Rogulabo]3 indicators in 1.
Included Indicators are:
- EMA 8,13,21,55,100,200,450
- Ichimoku
- Bollinger Band
These can be used to determine changes in trends when:
- EMA's collide, trajectories shift, or certain levels are reached.
- Ichimoku cloud is above or below the candles.
- Bollinger Band's width changes, or range is broken.
Reasons for 3 in 1 assembly:
This indicator is intended to be used by students, and followers of Dan Takahashi
(a prominent educator of investing in Japan who is also a user of TradingView) .
Those who wants to use and learn with the same setup as Dan, would greatly benefit from this since,
the complex setting up process which can be a pain for beginners can be skipped with a simple click.
Every stylistic choice of color and placement were made to make it similar to the chart used by Dan.
Simple customizations are available such as:
- Changing color
- Changing the values
- Hide/show controls
Notes:
This is intended to be used alongside “STOCH RSI ” for the complete the setup.
Any questions, please refer to:
@rogulabo
==
高橋ダンさんが使用されてるチャートと同様のセットアップの為にご活用ください。
複数のインジケータをグループにしておりますので、無料版を使われてる方は効率よく使っていただけると思います。
また、“STOCH RSI ”どいうタイトルのインジケータも同時に公開しておりますので、セットアップを完成させたい方はこちらもご活用ください。
以下のインジケータを含みます。
・EMA線
・一目均等表
・ボリンジャーバンド
カスタマイズされたい方はご自由に値を変更ください。
ご質問は @rogulabo までよろしくお願いいたします。

ADX strategy (considering ADX and +DI only )I have been checking the strategies on ADX indicator.
I have found that +DI crossing above ADX line under threshold 30 and exit on crossdown when ADX above 30 has better results than just following crossovers of +DI and -DI , ADX crossing above 30 .
BUY Rule
========
fast ema is above slow ema (default 13 and 55 , you can change these values in settings)
+DI cross above ADX well beloe threshold level (default 30)
Exit reule
========
when +DI cross down ADX , well above on threshold level
Stop Loss
=========
Default is set to 8%
Take a look and let me know how your symbol works with this strategy
Note : Bar color changes to yellow when the BUY condition is met.
Bar color and Background color shows to blue --- if Long position is active
fast ema and long ema doesnt print on the chart -- please add manually to the chart
Warning : for the use of educational purposes only

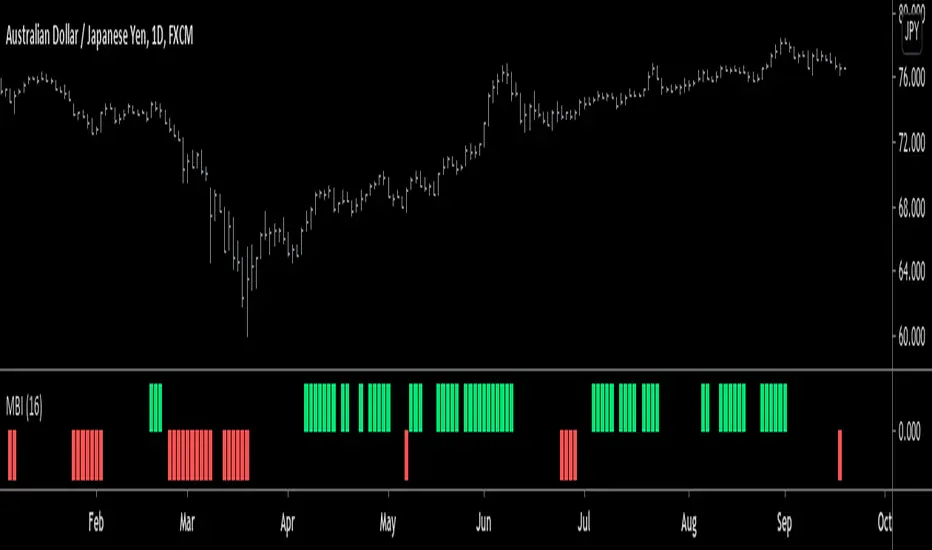
Monster Breakout Index V2Brief Description:
Monster Breakout Index V2 is a the successor to Monster Breakout Index, an indicator I published on May 13, 2020.
Like it's predecessor, MBI V2 gives high quality signals and is incredibly robust at preventing you from trading sideways/consolidating markets.
------------------------------------------------------------------------------------------------------------------------------------------------------------------
Interpreting Signals:
Green = Buy
Red = Sell
------------------------------------------------------------------------------------------------------------------------------------------------------------------
Calculation:
1) Calculate the median price of each bar over n periods. Determine the highest & lowest medians.
2) Current bar's high > highest median? -----Yes = Buy signal
3) Current bar's low < lowest median? -------Yes = Sell signal
Note: Occasionally, the indicator will simultaneously produce both a buy & sell signal. Because of this, it is recommended you use at least one other indicator in conjunction with this one...OR alternatively, ignore this double signal.
------------------------------------------------------------------------------------------------------------------------------------------------------------------
Enjoy ;)
unRekt - CloseLinedThis script will show the "Fibonacci" Close levels for 9 inputs. Currently set from 8, 13, 21, ..., 377. These lines can then be used for Support and Resistances. Source and Inputs are adjustable.

Matrix functions - JD/////////////////////////////////////////////////////////////////////////////////////////////////////////////////
// The arrays provided in Pinescript are linear 1D strucures that can be seen either as a large vertical stack or
// a horizontal row containing a list of values, colors, bools,..
//
// With the FUNCTIONS in this script the 1D ARRAY LIST can be CONVERTED INTO A 2D MATRIX form
//
//
///////////////////////////////////////////
/// BASIC INFO ON THE MATRIX STRUCTURE: ///
///////////////////////////////////////////
//
// The matrix is set up as an 2D structure and is devided in ROWS and COLUMNS.
// following the standard mathematical notation:
//
// a 3 x 4 matrix = 4 columns
// 0 1 2 3 column index
// 0
// 3 rows 1
// 2
// row
// index
//
// With the use of some purpose-built functions, values can be placed or retrieved in a specific column of a certain row
// this can be done by intuitively using row_nr and column_nr coördinates,
// without having to worry on what exact index of the Pine array this value is located (the functions do these conversions for you)
//
//
// the syntax I propose for the 2D Matrix array has the following structure:
//
// - the array starts with 2 VALUES describing the DIMENSION INFORMATION, (rows, columns)
// these are ignored in the actual calculations and serve as a metadata header (similar to the "location, time,... etc." data that is stored in photo files)
// so the array always carries it's own info about the nr. of rows and columns and doesn't need is seperate "info" file!
//
// To stay consistent with the standard Pinescript (array and ) indexing:
// - indexes for sheets and columns start from 0 (first) and run up to the (total nr of sheets or columns) - 1
// - indexes for rows also start from 0 (most recent, cfr. ) and run up to the (total nr of rows) - 1
//
// - this 2 value metadata header is followed by the actual df data
// the actual data array can consist of (100,000 - 2) usable items,
//
// In a theoretical example, you can have a matrix with almost 20,000 rows with each 5 columns of data (eg. open, high, low, close, volume) in it!!!
//
//
///////////////////////////////////
/// SCHEMATIC OF THE STRUCTURE: ///
///////////////////////////////////
//
////// (metadata header with dimensions info)
//
// (0) (1) (array index)
//

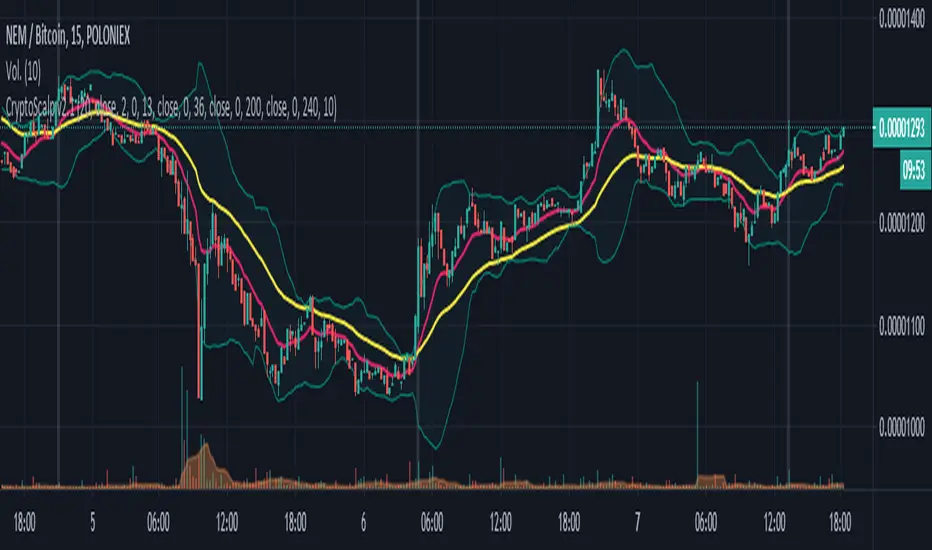
CryptoScalp v2.1CryptoScalp is a script that will allow us to identify possible entries while we do scalping, it is not of absolute truth but rather marks us a possible entry, the decision to enter or not is ours!
To use it, just add it to the graph we want to analyze, it has the following values preconfigured:
Bollinger Bands (BB Length): 20
Fast EMA (EMA 0 Length): 13
Slow EMA (EMA 1 Length): 36
EMA 2 (support | resistance): 200
EMA 2 Period (only appears in the configured period, 4h): 240
Volume MA: 10
Playing with these values will allow us to find our strategy.
How does the script work?
Basically, to mark a possible entry, in principle it controls that the Volume exceeds the Average of the configured Volume (Volume MA), and after the fast EMA (EMA 0) crosses over the slow EMA (EMA 1), if these conditions are met, it paints a background bar to identify a simple look at the crossing, and as said at the beginning, the decision is ours!
I hope it will be of help to you as it is being for me!
Kal's MTF OBV Haar Version 3Kal’s Multi-Time-Frame On-Balance-Volume Haar, also known as Kal’s MTF OBV Haar is a method/study for finding trending volume levels on stocks, indexes and cryptocurrencies using OBV, CMF and CCI over different time-frames (10Min, 1H, 4H, 1D, 1W, 1Month).
Upon adding to the 10Min chart, the sample Image in Tradingview looks as follows:
Note: Always check your time-frame(TF). Compare current TF to a row’s(bead row’s) time-frame. Ensure current TF is lower than a row’s time-frame when looking at it and higher time-frame rows above it. For instance, if you choose your chart’s time-frame at 1D, the lower time-frame rows(i.e. 10Min, 1H, 4H) don’t make sense.
For cryptocurrencies, one week is 7 periods, two weeks is 14 periods
For stocks, one week is 5 periods, two weeks is 10 periods
For the study of stocks, I used
9-period EMA over OBV for time-frames (10Min, 1H, 4H, D)
4-period EMA over OBV for time-frames (W, M)
For the study of cryptocurrencies, I would update EMAs as follows:
13-period EMA over OBV for time-frames (10Min, 1H, 4H, D)
6-period EMA over OBV for time-frames (W, M)
These days I'm finding the following parameters have better fitting
19-period EMA over OBV for time-frames (10Min, 1H, 4H, D)
9-period EMA over OBV for time-frames (W, M)
Description:
---------------
In the study plot, the lowest row is 10Min, the row above 10Min is 1H, then 4H, then 1D, then 1W and the highest row is 1M
Note: Always check your time-frame(TF). Compare current TF to a row’s(bead row’s) time-frame. Ensure current TF is lower than a row’s time-frame when looking at it and higher time-frame rows above it. For instance, if you choose your chart’s time-frame at 1D, the lower time-frame rows(i.e. 10Min, 1H, 4H) don’t make sense.
Lime( Bright Green) dot implies Trending Uptrend for that time-frame
Red dot implies Trending Downward for that time-frame
It’s best to wait and research for possibility of Trend Reversal during the following dots/bricks:
Silver dot implies indecisive up
Orange dot implies indecisive downtrend
Lime Brick implies CCI is near Zero line( between 15 and 0)
Red Brick implies CCI is near Zero line( between -15 and 0)
Purple dot implies CCI zero rejection to possibly/probably continue trend UP
Yellow dot implies CCI zero rejection to possibly/probably continue trend Down
Aqua dot implies that trend is overbought or oversold. This dot usually happens between red dots or green dots. Therefore, it’s best to wait for pull-back especially in lower time frames.
Safe Trading!
Kal Gandikota
Legal Disclaimer: This script is published here so I get replies from fellow viewers to educate myself. Hence, if anyone uses this script for making their financial decisions, I am not responsible for any failures incurred. If you have questions or improvements related to this script, please feel free to leave comments and as time permits, will respond to those comments.

Trend Following with Moving AveragesHello Traders,
With the info "Trend is Your Friend ", you should not take position against the trend. This script checks multipte moving averages if they are above/below the closing price and try to find trend. The moving averages with the length 8, 13, 21, 34, 55, 89, 144, 233, 377 used. these are fibonacci numbers, but optionally you can change the lengths of each moving averages. while it's green you better take long positions, while it's red you better take short positions according to other indcators or tools.
Optionally you have "smoothing" option to get rid of whipsaws. it's enabled by default.
You have option to use following moving average types: EMA, SMA, RMA, WMA, VWMA. by default it's EMA
Also the script has "Resolution" option. with this option you can get the trend for other time frames, in following example 1h was set as for higher time frame on 15m chart:
This should not be used as buy/sell signal indicators as it's tries to find trend but not entry points, you should use other indicators (such RSI, Momentum) or other tools to find buy/sell signals.
Enjoy!

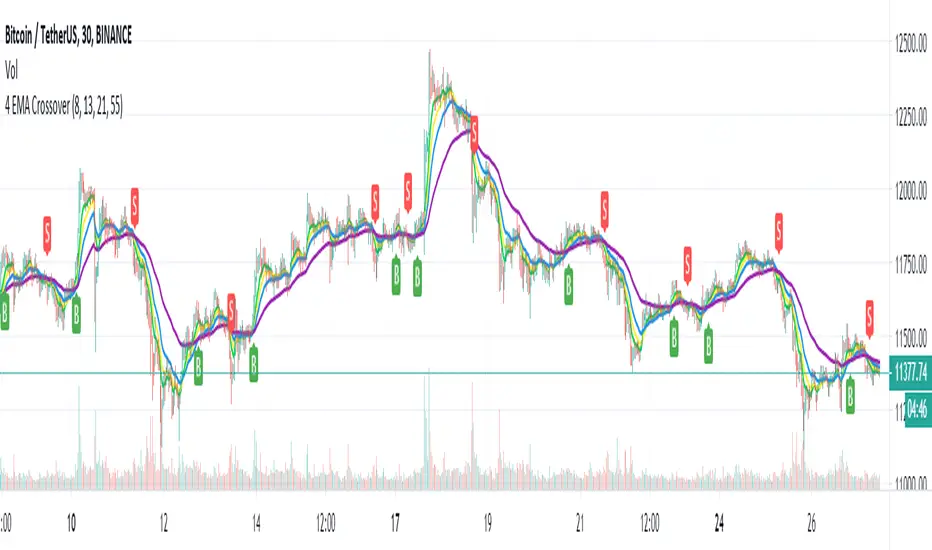
4 EMA Crossover w/alerts4 EMA crossover visualized (buy/sell) w/ alerts.
Personally I use 8, 13, 21 & 55 for LTF's and 21, 55, 100 & 200 for HTF's
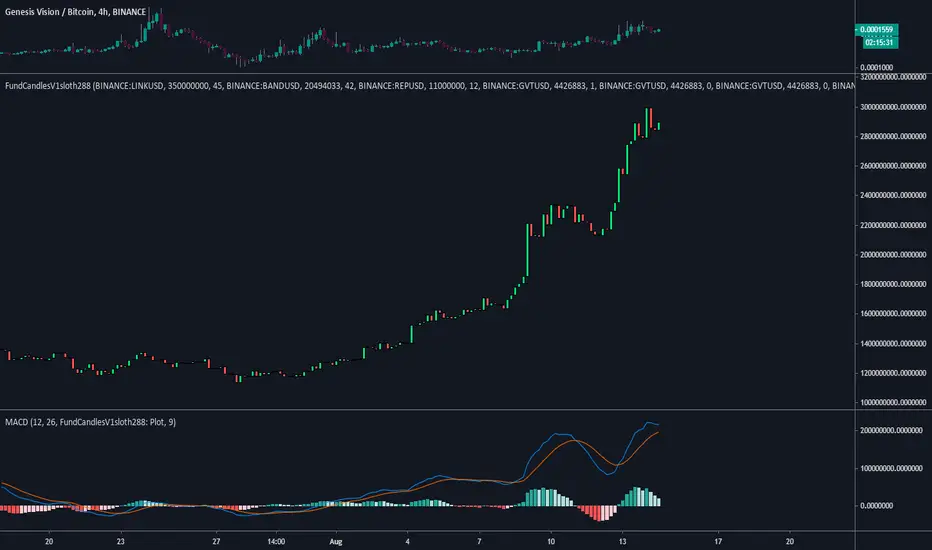
FundCandlesV1sloth288FundCandlesV1sloth288 is an indicator I decided to put together so I can track how funds are doing on $GVT Genesis Vision.
Using a standard MACD or RSI indicator you can change source to use the FundsCandles values to determine if its a good time to enter or exit different funds on the platform.
What you need to know...
Currently all securities need to pair the same, (USD / BTC ).
Security 01, 02, 03 etc etc to maximum of 10 need to be in "BINANCE:LINKUSD" format.
Manually need to input circulating supply from CMC to get the proper ratios for index.
Allocation is the % of the funds exposure to said security.
Inputting the values does not track previous reallocation's, the whole chart will be if the history of the fund was using up to date settings.
Values on the right is the Marketcap of the fund.
Standard settings is of Oracle Basket on the platform made by Somnium Funds as of Aug 13 2020.
Next update will be after GV includes traditional stocks onto the platform for managers to diversify their current allocations into them.
Average Difference OscillatorAverage Difference is a simple, yet powerful oscillator that can be used for entries or exits.
The indicator was made from scratch, so it's 100% original!
Calculation:
1) Difference = Close - Previous close
2) Average Difference = Sma (Difference, n periods)
How to interpret colors:
Green = Bullish
Red = Bearish
Default setting: 13 (For entries)
Enjoy, and hit the follow button to follow my latest indicators!
