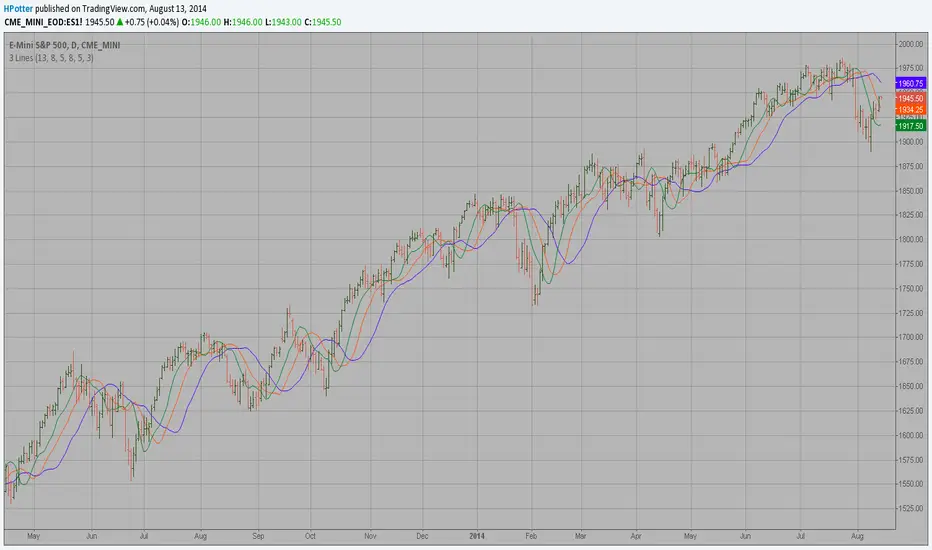
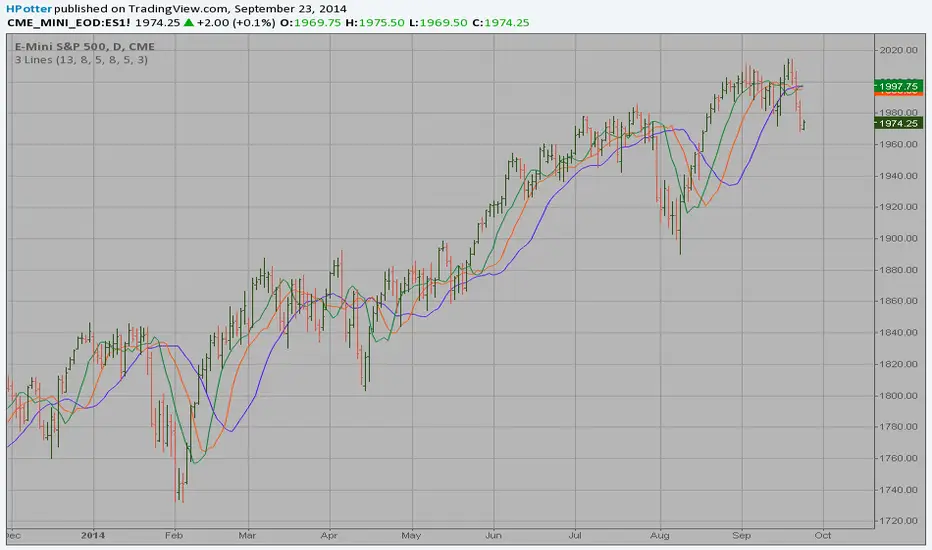
Bill Williams Averages. 3Lines Backtest This indicator calculates 3 Moving Averages for default values of
13, 8 and 5 days, with displacement 8, 5 and 3 days: Median Price (High+Low/2).
The most popular method of interpreting a moving average is to compare
the relationship between a moving average of the security's price with
the security's price itself (or between several moving averages).
Поиск скриптов по запросу "细算江西救护车家长倒赚了四万三+-医疗花费13万(家长视频)++医保报"

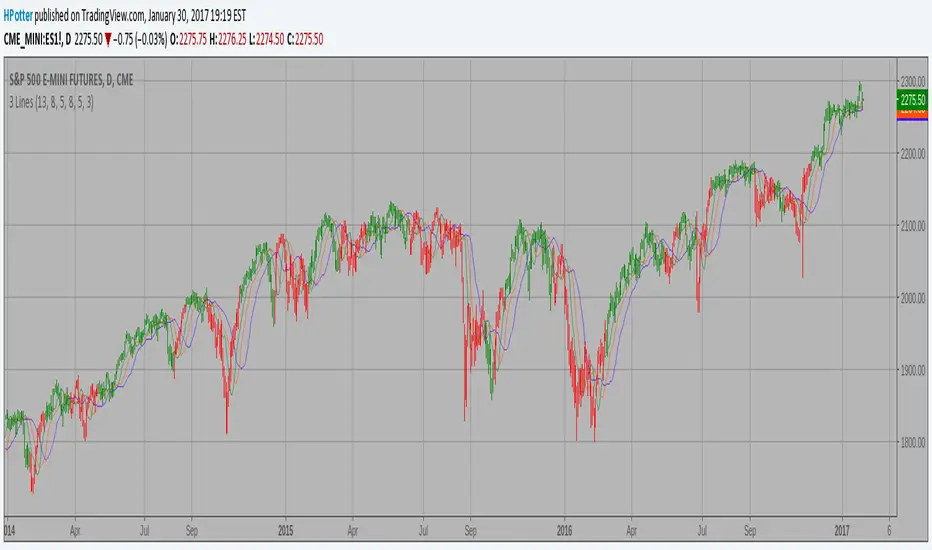
Bill Williams Averages. 3Lines Strategy This indicator calculates 3 Moving Averages for default values of
13, 8 and 5 days, with displacement 8, 5 and 3 days: Median Price (High+Low/2).
The most popular method of interpreting a moving average is to compare
the relationship between a moving average of the security's price with
the security's price itself (or between several moving averages).
High - EMA Strategy Backtest This indicator plots the difference between the High (of the previous period)
and an exponential moving average (13 period) of the Close (of the previous period).
You can use in the xPrice any series: Open, High, Low, Close, HL2, HLC3, OHLC4 and ect...
It buy if indicator above 0 and sell if below.
You can change long to short in the Input Settings
Please, use it only for learning or paper trading. Do not for real trading.

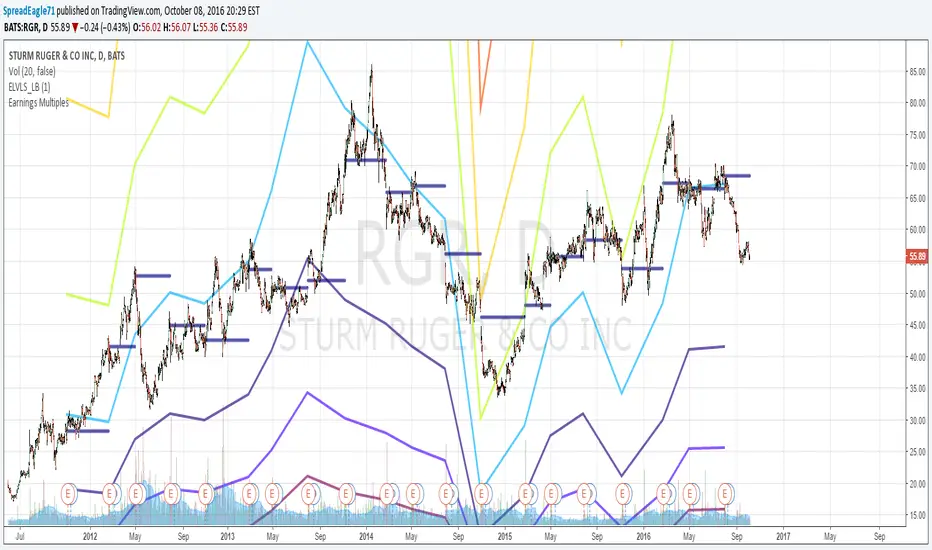
Earnings MultiplesMultiplies Quarterly Earnings x 13, x 21, x 34, x 55, x 89, x 144, x 233.
Yes its a fibonacci sequence.
"Goldilocks zone" seems to be in the 55x - 89x area.
Also when companies become profitable, the indicator looks like a "starburst".
Heiken Ashi zero lag EMA v1.1 by JustUncleLI originally wrote this script earlier this year for my own use. This released version is an updated version of my original idea based on more recent script ideas. As always with my Alert scripts please do not trade the CALL/PUT indicators blindly, always analyse each position carefully. Always test indicator in DEMO mode first to see if it profitable for your trading style.
DESCRIPTION:
This Alert indicator utilizes the Heiken Ashi with non lag EMA was a scalping and intraday trading system
that has been adapted also for trading with binary options high/low. There is also included
filtering on MACD direction and trend direction as indicated by two MA: smoothed MA(11) and EMA(89).
The the Heiken Ashi candles are great as price action trending indicator, they shows smooth strong
and clear price fluctuations.
Financial Markets: any.
Optimsed settings for 1 min, 5 min and 15 min Time Frame;
Expiry time for Binary options High/Low 3-6 candles.
Indicators used in calculations:
- Exponential moving average, period 89
- Smoothed moving average, period 11
- Non lag EMA, period 20
- MACD 2 colour (13,26,9)
Generate Alerts use the following Trading Rules
Heiken Ashi with non lag dot
Trade only in direction of the trend.
UP trend moving average 11 period is above Exponential moving average 89 period,
Doun trend moving average 11 period is below Exponential moving average 89 period,
CALL Arrow appears when:
Trend UP SMA11>EMA89 (optionally disabled),
Non lag MA blue dot and blue background.
Heike ashi green color.
MACD 2 Colour histogram green bars (optional disabled).
PUT Arrow appears when:
Trend UP SMA11

Traders Dynamic Index Indicator Alert v0.1 by JustUncleLThis is a trend trading indicator+alert utilising the Traders Dynamic Index (TDI), Price Action Channel (PAC) and Heikin Ashi candles.
About 6months ago I came across the use of TDI in "E.A.S.Y. Method" that I found in forexfactory forums: www.forexfactory.com
and I was able to set up a chart based on the specifications by using Kurbelklaus scripts. However, I found that the alerts were being generated one or two bars too late, so at that time I was not successful using it with Binary Options. A few months later I found a variation of the method in the forecfactory forums which is able to generate the alerts a bit earlier, so this indicator is a modification of that early detection version.
The indicator can optionally use Heikin Ashi candles only for all it's calculation. I would recommend viewing the chart with Heikin Ashi candles, these smooth out the trends and makes trends very clear.
I found that this method it works good with most currency pairs or commodities and with 5min+ timeframe charts. I would suggest expiry of 2 to 6 candles.
ALERT GENERATION:
=================
The TDI (Traders Dynamic Index)
---------------------------------------------
Volatility Band VB(34), color: Blue, buffer: UpZone, DnZone
Relative Strength Index RSI(13)
RSI PRICE LINE (2), color: Green, buffer: mab
RSI TRADE SIGNAL LINE (7), color: Red, buffer: mbb
MARKET BASE LINE MID VB(34), color: Orange, buffer: mid
Indicator SignalLevels:
-------------------------------
RSI_OversoldLevel : 22 (normally: 32)
RSI_OverboughtLevel : 78 (normally: 68)
Alert Conditions:
-----------------------
Strong Buy : yellow
Medium Buy : aqua
Weak Buy : blue
Strong Sell : fuchsia
Medium Sell : purple
Weak Sell : black
Hints on How to use:
----------------------------
- When a Medium or Strong alert is generated and MACD histogram colour matches the direction
of the alert (optional auto filter), then place trade in direction of alert candle and MACD.
- I use the multi-Hull MA's for overall trend direction confirmation.
- Best positions normally occur near the MACD(5,15,1) Histogram crossing the zero line.
- The optional coloured Dots along the bottom of the indicator represent the first alert
of this type that was generated in this sequence.
- It is advisable to trade in the direction of the main trend as indicated the HULL MA red cloud:
if red cloud underneath PAC then BULLISH trend, if red cloud above PAC then BEARISH trend.
- Selecting the HeiKin Ashi candles does affect the MACD and MA caculations, so if you select
normal candles the result chart will change. You can still Optionally select to use Heikin Ashi
for calculations.
- When using the Heikin Ashi candles, a good buy entry is indicated by long top wick and no bottom wick
for bull (green) candles and good sell entry is indicated by long bottom wick and no top wick for
bear (red) candles.
- When the MACD histogram is flat and close to zero line,
this indicates a ranging market, do NOT trade when this occurs.
- When the PAC channel on the main chart is spread apart widely, this is an indication
of extreme volatility and choppy chart, do NOT try to trade during these periods.
A choppy chart is also indicated by Heikin Ashi candles with long wicks on both sides
of the candles.
- You can specify what strength level Alerts are generated (default 2):
Level (1) means only generate Strong Alerts only.
Level (2) means generate Strong and Medium Alerts.
Level (3) means generate Strong, Medium and Weak Alerts.

Indicator Integrator StratThis strategy is based on my Indicator Integrator. The code sums the distances from the close of the price to an SMA (200 in example) with a summation period of the last 29 bars. I tuned this to NZDUSD 15min chart using 200SMA and 29 period sum. If I am reading strat tester correctly this hits a 39% gain since Mar-13 or 104 days. It has the ability to set stops and limits which they are not set at this point. There is no repainting or HA charts and other tricks of boosting a false gain. My codes are built for autotrading with some oversight, i.e stopping the autotrading prior to extreme news events on the economic calendar. I pick pairs that have low volatility so that the code does not have to act through heavy price changes.
Comments welcome

RSD Fractal Dimension Moving AverageHere is a Fractal Dimension Moving Average , that include a trend follow/divergence based on RSI , Stoch ,and ADX. Combineted this algo with the FDMA algo , we have a MA reactive without following the yo-yo during high volatility period. Can set the range from a min and max bars you want to have your MA , the value are powered , so the min can set 1 to 10 that s is 1 to 60 bars and the Max 13 to 24 range 100 to 300. Period length and RSD len-0.37% are use to calculate Fractal Dimen and Trend parameter
If you need more info how to set go here
etfhq.com

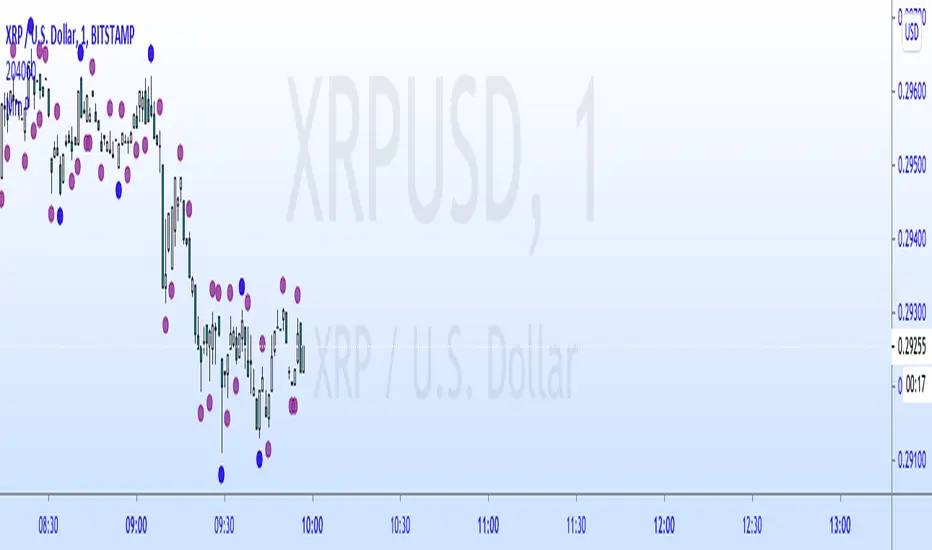
Major Minor Fib PointsHey guys I made this indicator that plots major and minor lows based on the candle duration since it's last seen a lower low or higher high.
I made this after watching a seminar and seeing it as a way to simply, easily and naturally find the plot points for fibonacci retracements and extentions.
Blue dots are Major, Purple are Minor.
The dots only appear if there has not been a newly established low or high in the default(13) periods (for Major) before or after that candle. This is done to make the pivot candle clear and less subjective. The periods are also changeable in the format icon.
Let me know what if you like/hate it. It's just another indicator and is only a visual tool. But I hope it helps. I hope it helps me as well!
Peaks&ValleysFor Peaks:
marks bars whose high is higher than bars on either side
For Valleys:
marks bars whose low is lower than bars on either side
defaults to 13

extended session - Regular Opening-Range- JayyOpening Range and some other scripts updated to plot correctly (see comments below.) There are three variations of the fibonacci expansion beyond the opening range and retracements within the opening range of the US Market session - I have not put in the script for the other markets yet.
The three scripts have different uses and strengths:
The extended session script (with the script here below) will plot the opening range whether you are using the extended session or the regular session. (that is to say whether "ext" in the lower right hand corner is highlighted or not.). While in the extended session the opening range has some plotting issues with periods like 13 minutes or any period that is not divisible into 330 mins with a round number outcome (eg 330/60 =5.5. Therefore an hour long opening range has problems in the extended session.
The pre session script is only for the premarket. You can select any opening range period you like. I have set the opening range to be the full premarket session. If you select a different session you will have to unselect "pre open to 9:30 EST for Opening Range?" in the format section. The script defaults to 15 minutes in the "period Of Pre Opening Range?". To go back to the 4 am to 9:30 pre opening range select "pre open to 9:30 EST for Opening Range?" there is no automatic 330 minute selection.
The past days offset script only works in 5 min or 15 minute period. It will show the opening range from up to 20 days past over the current days price action. Use this for the regular session only. 0 shows the current day's opening range. Use the positive integers for number of days back ie 1, 2, 3 etc not -1, -2, -3 etc. The script is preprogrammed to use the current day (0).
Scripts updated to plot correctly: One thing they all have in common is a way of they deal with a somewhat random problem that shifts the plots 4 hours in one direction or the other ie the plot started at 9:30 EST or 1:30PM EST. This issue started to occur approximately June 22, 2015 and impacts any script that tried to use "session" times to manage a plot in my scripts. The issue now seems to have been resolved during this past week.
Just in case the problem reoccurs I have added a "Switch session plot?" to each script. If the plot looks funny check or uncheck the "Switch session plot?" and see the difference. Of course if a new issue crops up it will likely require a different fix.
I have updated all of the scripts shown on this chart. If you are using a script of mine that suffers from the compiler issue then you will find an update on this chart. You can get any and all of the scripts by clicking on the small sideways wishbone on the left middle of the chart. You will see a dialogue box. Then click "make it mine". This will import all of the scripts to your computer and you can play around with them all to decide what you want and what you don't want. This is the easiest way to get all of the scripts in one fell swoop. It is also the easiest way for me to make all of the scripts available. I do not have all of the plots visible since it is too messy and one of the scripts (pre OR) is only for the regular session. To view the scripts click on the blue eye to the right of the script title to show it on this script. If you can only use the regular session. The scripts will all (with the exception of the pre OR) work fine.
If for any reason this script seems flakey refresh the page r try a slightly different period. I have noticed that sometimes randomly the script loves to return to the 5 min OR. This is a very new issue transient issue. As always if you see an issue please let me know.
Cheers Jayy


Madrid Trend SpotterThis study shows a pair of colored moving averages filled with the color of the direction of the trend.
This study calculates the moving averages with standard or exponential M.A.'s. By default it uses a couple of fast exponential moving average pair (5,13) with the closing price as the source.
Parameters:
source
fast MA length
slow MA Length
type of moving average

Stoch_VX2Nothing New about a Stochastic but maybe in how you use them ( Other than Over bought / Sold cross over & divergence signals )
Running 3 bands
Standard stoch & tops & bottoms swing band
Optimised variables 12, 5 , 3 or fib 13, 5, 3 / - 12 / 3 / 3 a little bit tighter to combine both smoothness & accuracy. These are my own personal setting inc. Strategy.

Binary Option Arrows (example) [TheMightyChicken]An example of binary option arrows for candlestick patterns bearish and bullish harami. With results as colored background and an option to choose your expiration (one candle by default). It's just an example for those who has their own strategy and wants to make nice arrows in their chart. All you need to do is rewrite piece of script in lines 9:13 - feel free to ask me for any help, but I believe it's all clear.
Disclaimer: It's just an example how to script arrows for binary option and I am not responsible for any loss of money by using this particular strategy.
I wish happy and successful trading! ;)

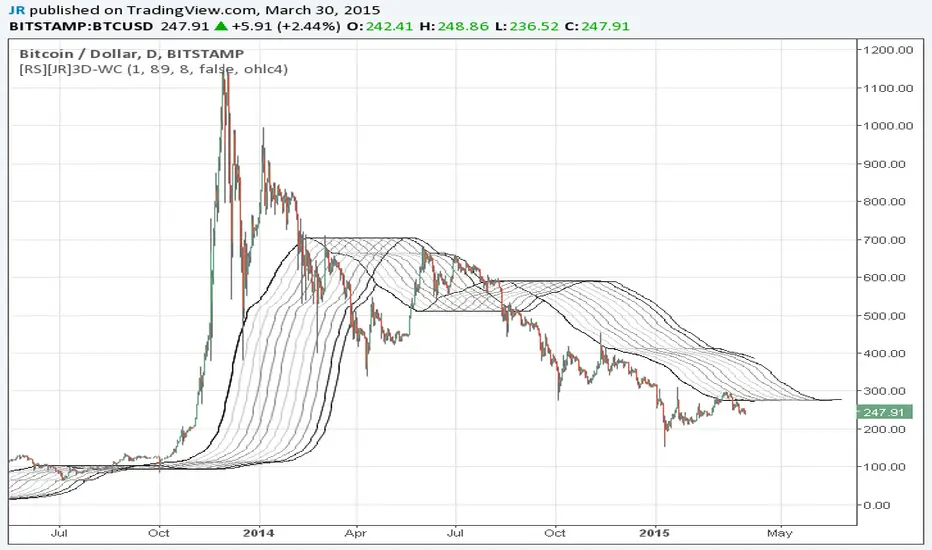
Wave Channel 3D Wave Channel 3D
Built by Ricardo idea from JR & Aloakdutt from indieTrades Jan. 2010
This indicator is very easy to build. We utilize Moving Averages with a set multiplier and an offset. Specially we try to use Fibonacci sequence series numbers (1, 2, 3, 5, 8, 13, 21, 34, 55, 89, 144...) as time space and multiplier (default 89, 8). Also included is Donchian Channel to locate strong trends and possible future support - resistance.
Examples of support/resistance on chart.
Dominant Price Trends
Future Support Resistance
Comparing Fibonacci Series Time Space - Multiplier
When Comparing make note of confluence support/resistance showing up with Fibonacci Series
Example uses DC
When Comparing make note of confluence support/resistance showing up with Fibonacci Series
Example without DC / Smooth MA
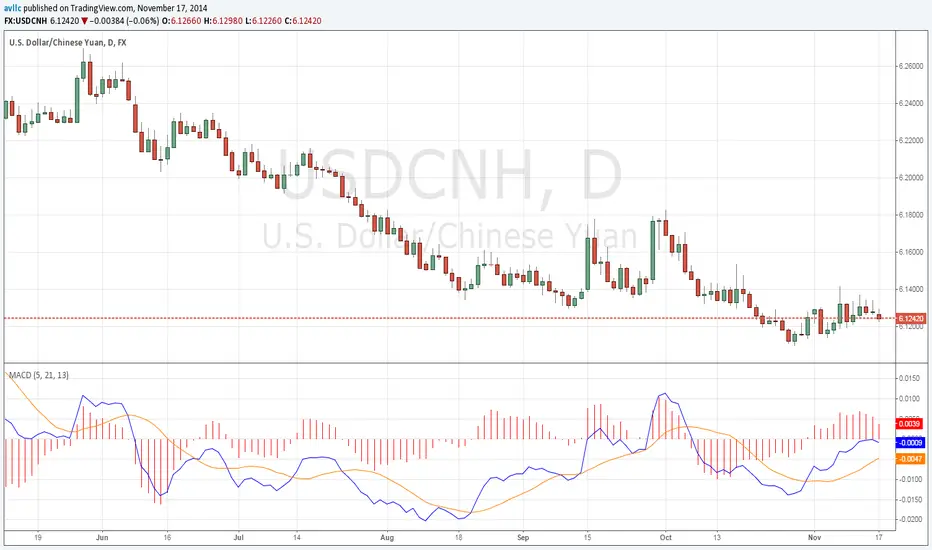
Vegas TunnelThis indicator adds and subtracts fib levels from the moving average. I suppose profits are meant to be taken at certain levels. Additionally, it may help in finding tops and bottoms. There's more info here: www.forexstrategiesresources.com
The fib levels should be changed depending on time frame:
short) 5, 8, 13, 21
intermediate) 34, 55, 89, 144
long) 55, 89, 144, 233

MAGNUS® CyclesThis indicator will help you if you struggle making any profit in bitcoin.
It generates very few signals with very nice profit potential ( around 100% this year ! ).
Perfect tool for longterm swing traders and new traders that need help figuring out the midterm trend.
Use it with these parameters only:
weekly: 13, 5, 12
daily: 92, 21, 96

Bill Williams Averages SMMA This indicator calculates 3 Smoothed moving average for default values of
13, 8 and 5 days, with displacement 8, 5 and 3 days.
The most popular method of interpreting a moving average is to compare
the relationship between a moving average of the security's price with
the security's price itself (or between several moving averages).
Bill Williams Averages This indicator calculates 3 Moving Averages for default values of
13, 8 and 5 days, with displacement 8, 5 and 3 days: Median Price (High+Low/2).
The most popular method of interpreting a moving average is to compare
the relationship between a moving average of the security's price with
the security's price itself (or between several moving averages).