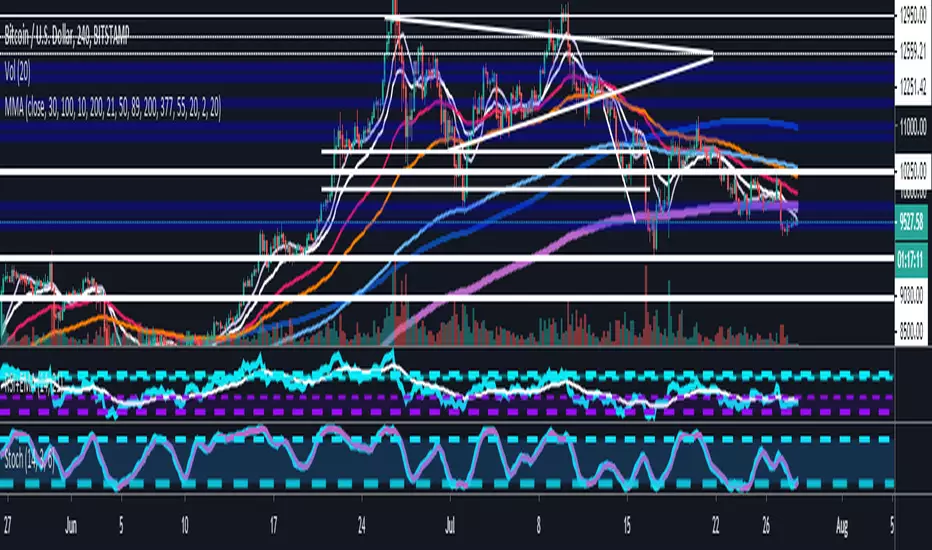
MIN_escgo_wt_cross_showstochehlers stochastic CG oscillator wavetrend with crosses slow stochastic 3가지 통합지표입니다. 원지않는 지표는 끌수있습니다. Индикатор Pine Script®от Destroy22190
[MIN] MA_BB_Ichimoku Cloud이동평균선 11개 볼리저맨드 일목구름 3가지가 합쳐진지표입니다. 총 지표만 13개들어가있습니다 편안하게 수정해서 쓰시면됩니다. Индикатор Pine Script®от Destroy31
WaveTrend with Crosses [MIN]channel length 값 average length 값 sma length 값 피어리어드 값 각각 조정할수있게편집.Индикатор Pine Script®от DestroyОбновлено 47
Leeloo Quadruple (4x) Simple Moving AverageOne-stop shop for all of the simple moving averages because editing separately is annoying.Индикатор Pine Script®от fsuaouo119
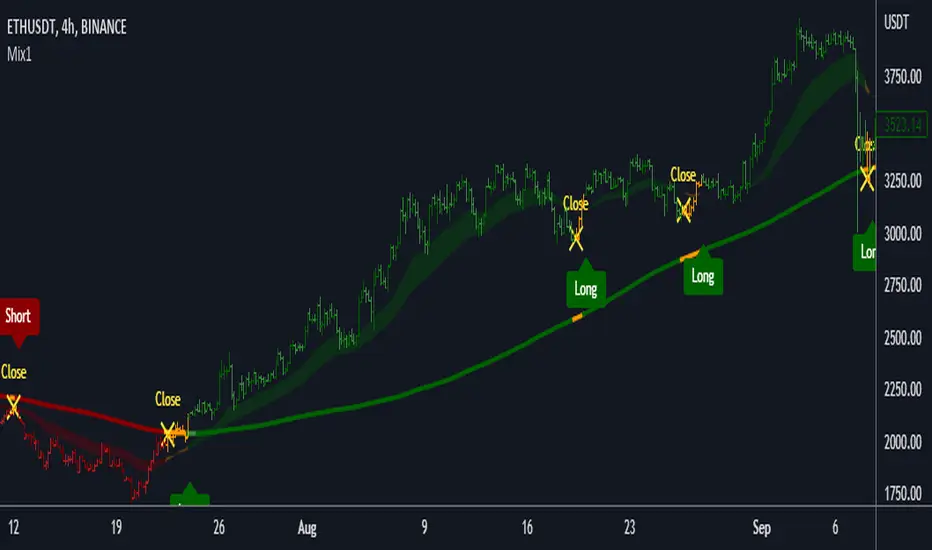
Mix1 : Ema Cross + Trend Channel [Gu5]Based on Trend Channel Ema-crossover is added Crossing alerts, only on trend Basado en mi anterior indicador, Trend Channel Se agrega Cruce de Medias Moviles (Ema-crossover) Las alertas solo son en favor a la tendencia El valor de SMA Range es arbitrario (No Backtesting). Cambia la amplitud de canal que determina cuando es rango (barras amarillas por estar muy cerca del SMA200, sin tendencia definida) Range Multiplier adapta el indicador a distintos mercados //Setting recommended for SMA Range //BTCUSD = 100 //EURUSD = 1000 //SPX = 100 //ETHUSD = 10 Si te fue útil este indicador, puedes comprarme una cerveza ;)Индикатор Pine Script®от gu5tavo71Обновлено 9999 5.6 K
Tres MédiasTrês Médias moveis simples de 200, 20 e 8 períodos.Индикатор Pine Script®от rubemesteves32
M&Ms - Multiple Moving AveragesThe (M&Ms) Multiple Moving Average Crossing allows the investor identify trends in different time frames and indicates when to entry short or long.Индикатор Pine Script®от Aldovitch19
2-Period RSI strategy (with filter)2-period RSI strategy backtest described in several books of the trader Larry Connors . This strategy uses a 2 periods RSI , one slow arithmetic moving average and one fast arithmetic moving average. Entry signal: - RSI 2 value below oversold level (Larry Connors usually sets oversold to be below 5, but other authors prefer to work below 10 due to the higher number of signals). - Closing above the slow average (200 periods). - Entry at closing of candle or opening of next candle. Exit signal: - Occurs when the candlestick closes above the fast average (the most common fast average is 5 periods, but some traders also suggest the 10 period average). Entry Filter (modification made by me): - Applied an RSI2 arithmetic moving average to smooth out oscillations. - Entered only when RSI2 is below oversold level and RSI2 moving average is below 30. * NOTE: In the stocks that I evaluate daily the averages of 4 and 6 periods work very well as a filter. Comments: This strategy works very well in Daily charts but can be applied in other chart times as well. As this is a strategy to catch market fluctuations, it presents different results with different stocks. I have been applying this strategy to the stocks of the Brazilian market (BOVESPA) and have enjoyed the result. Every day I evaluate the stocks that are generating entry signals and choose which one to trade based on the stocks with the highest Profit Value. The RSI 2 averaging filter probably will reduce profit of the backtests because reduces the number of signals, but the Profit Value will usually increase. For me this was a good thing because without the filter, this strategy usually shows more signals than I have capital to allocate. Before entering a trade I look at which fast average the paper has the highest Profit Value and then I use this average as my output signal for that trade (this change has greatly improved the result of the outputs). This strategy does not use Stop Loss because normally Stop Loss decreases effectiveness (profit). In any case, the option to apply a percentage Stop Loss if desired is added in the script. As the strategy does not use stop, extra caution with risk management is advisable. I advise not to allocate more than 20% of the trade capital in the same operation. I'm still studying ways to improve this strategy, but so far this is the best setup I've found. Suggestions are always welcome and we can test to see if they improve the backtest result. Good luck and good trades. ================================================ Backtest das estratégia do IFR de 2 períodos descrita em varios livros do trader Larry Connors . Esta estratégia usa um IFR de 2 períodos, uma média movel aritmética lenta e uma média movel aritmética rápida. Sinal de entrada: - Valor do IFR 2 abaixo do nível de sobrevenda (Larry Connors usualmente define sobrevenda sendo abaixo de 5, mas outros autores preferem trabalhar abaixo de 10 devido ao maior número de sinais). - Fechamento acima da média lenta (200 períodos). - Realizado a compra no fechamento do candle ou na abertura do candle seguinte. Sinal de saída: - Ocorre quando o candle fecha acima da média rápida (a média rápida mais comum é a de 5 períodos, mas alguns traders sugerem também a média de 10 períodos). Filtro para entrada (modificação feita por mim): - Aplicado uma média móvel aritmética do IFR2 para suavisar as oscilações. - Realizado a entrada apenas quando o IFR2 está abaixo do nível de sobrevenda e a média móvel do IFR2 está abaixo de 30. *OBS: nos ativos que avalio diariamente as médias de 4 e 6 períodos funcionam muito bem como filtro. Comentários: Esta estratégia funciona muito bem no tempo gráfico Diário mas pode ser aplicada tambem em outros tempos gráficos. Como trata-se de uma estratégia para pegar oscilações do mercado, ela apresenta diferentes resultados com diferentes ativos. Eu venho aplicando esta estratégia nos ativos do mercado brasileiro (BOVESPA) e tenho gostado do resultado. Diariamente eu avalio os papeis que estão gerando entrada e escolho qual irei realizar o trade baseado nos papeis que apresentam maior Profit Value. O filtro da média do IFR 2 reduz o lucro nos backtests pois reduz também a quantidade de sinais, mas em compensação o Profit Value irá normalmente aumentar. Para mim isto foi algo positivo pois, sem o filtro, normalmente esta estratégia apresenta mais sinais do que possuo capital para alocar. Antes de entrar em um trade eu olho em qual média rápida o papel apresenta maior Profit Value e então eu utilizo está média como meu sinal de saída para aquele trade (esta mudança tem melhorado bastante o resultado das saídas). Está estratégia não utiliza Stop Loss pois normalmente o Stop Loss diminui a eficácia (lucro). De qualquer maneira, foi acrescentado no script a opção de aplicar um Stop Loss percentual caso seja desejado. Como a estratégia não utiliza stop é aconselhável um cuidado redobrado com o gerenciamento de risco. Eu aconselho não alocar mais de 20% do capital de trade em uma mesma operação. Ainda estou estudando formas de melhorar esta estratégia, mas até o momento está é a melhor configuração que encontrei. Sugestões são sempre bem vindas e podemos testar para verificar se melhoram o resultado do backtest. Boa sorte e bons trades.Стратегия Pine Script®от Tomazetti1212420
Golden Cross by -Westy-Quick Guide - Yellow cross and green MA on top = Potential uptrend - Yellow cross and red MA on top = Potential downtrend A simple golden cross indicator of the green 50 and red 200 SMA with a yellow cross for ease of visibility and backtesting. Generally, longer time frames more powerful signals but are less frequent. I typically use it on the 4 hour, daily and weekly.Индикатор Pine Script®от Westy_Обновлено 236
Trend Channel [Gu5]SMA 200 determines the trend Bullish trend, green candles. Down trend, red candles. If the market value is narrow to the SMA200 channel, yellow candles. Setting recommended for SMA Range BTCUSD = 100 EURUSD = 1000 SPX = 100 ETHUSD = 10 Индикатор Pine Script®от gu5tavo71Обновлено 77457
Triple Moving Average HeatmapHi everyone I didn't publish on Friday because I was working on an Expert Advisor in MT4. The day I don't publish, some scripts spamming guys published many (not useful) scripts the same to kick me out of the TOP #1 ranking. So what I'm going to do about it? crying or sharing more quality scripts than before? :) I guess you know the answer :) I'm gonna share a few quality scripts that I have in my library. I noticed that you guys tend to like more the scripts useful for your trading actually making you money rather than a copy-paste (of another copy-paste) Alright, enough for the trolling now let's introduce the Three MA heatmap which is an upgrade of that script : MA-heatmap-Double-cross-edition/ The challenge was to keep the heatmap not rolling and to make it match with the MA cross. I did it using this ``` since_ma_buy = barssince(macrossover) since_ma_sell = barssince(macrossunder) heatmap_color() => since_ma_buy < since_ma_sell ? color.new(color.green, 20) : since_ma_buy > since_ma_sell ? color.new(color.red, 20) : na ``` This is a technique that I found after drinking three glasses of red wine (#french) to keep the heatmap stable and not rolling. To get what I'm saying I invite you to replace the piece of code above by what everyone would normally do ``` heatmap_color() => macrossunder() ? color.new(color.green, 20) : macrossover() ? color.new(color.red, 20) : na ``` Ah and I'm not done sharing for the day, a few scripts are coming also after that one and tonight !!!!! I want to live in a world where you guys can enjoy quality scripts (mostly) :) PS ____________________________________________________________ Feel free to hit the thumbs up as it shows me that I'm not doing this for nothing and will motivate to deliver more quality content in the future. - I'm an officially approved PineEditor/LUA/MT4 approved mentor on codementor. You can request a coaching with me if you want and I'll teach you how to build kick-ass indicators and strategies Jump on a 1 to 1 coaching with me - You can also hire for a custom dev of your indicator/strategy/bot/chrome extension/python Индикатор Pine Script®от Daveatt66468
Triple Moving Average & Elder ImpulseThis is an updated version of my previous Triple Moving average script. This one plots 3 moving averages + Elder impulse system. The user has an option to choose from EMA or SMA. User can also choose the length and source for moving averages. The user also has an option to turn ON/OFF the use of the Elder impulse system. All this utilizing the space for a single indicator. This is especially helpful for free users with a limit of only 3 indicators per chart. This way you can add the 4 above + 2 more indicators of your choice. Hope it helps.Индикатор Pine Script®от getmohsin.pyОбновлено 22194
Ultimate Moving Average Package (17 MA's)Included is the: VWAP Current time frame 10 EMA Current time frame 20 EMA Current time frame 50 EMA Current time frame 10 SMA Current time frame 20 SMA Current time frame 50 SMA Daily 10 EMA Daily 20 EMA Daily 50 EMA Daily 50 SMA Daily 100 SMA Daily 200 SMA Weekly 100 SMA Weekly 200 SMA Monthly 100 SMA Monthly 200 SMA All Daily/Weekly/Monthly MA's can be seen on intraday charts. Current time frame MA's change depending on your time frame. Obviously you dont need all 17 on your chart but you can pick the ones you like and disable the rest.Индикатор Pine Script®от Craig_Stine62
ck - 10 MA Combo (5 EMAs, 5 SMAs)Yet another MA and EMA indicator. These are my favourite presets & colour combos for Tradingview Dark Theme. Enjoy!Индикатор Pine Script®от ChrisKayeОбновлено 52
Simple Moving Average Shaded Fill Area Crossover 10/212 ma, 10/21 fills area between themИндикатор Pine Script®от matryskowal53
Triple Moving AverageSimple indicator combining up to three moving averages. Uses simple moving average (SMA) and exponential moving average (EMA).Индикатор Pine Script®от chuckination19
Dual Moving AverageBasic dual moving average indicator supporting both simple moving average (SMA) and exponential moving average (EMA).Индикатор Pine Script®от chuckination14
Multiple Moving AveragesThis is an indicator with 4 moving average slots and 6 exponential moving average slots It also has bollinger bands and a volume weighted moving average slot Feel free to edit this and add/remove some and publish your ownИндикатор Pine Script®от Coin_Savvvy38
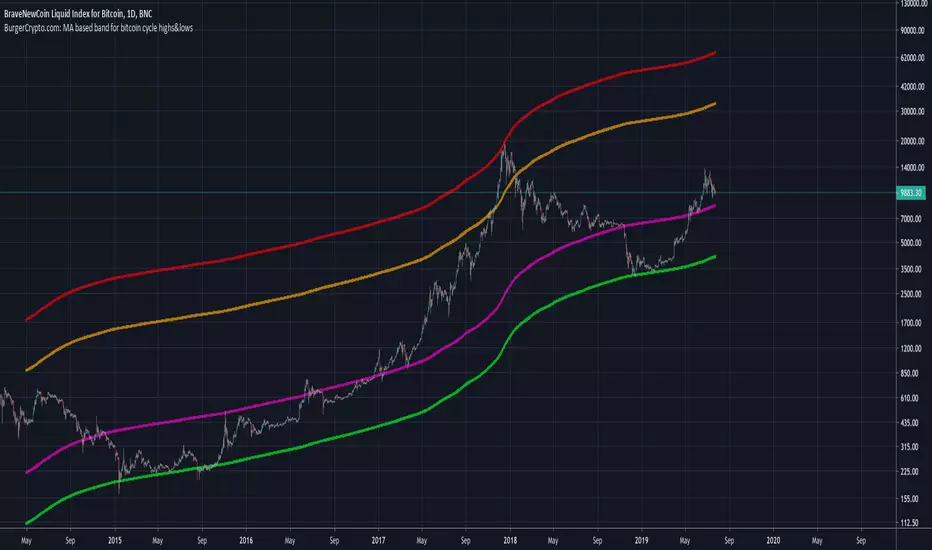
BurgerCrypto.com: MA based band for bitcoin cycle highs&lowsWarning: This script works only on a daily chart and only works for bitcoin charts with a long history. Best to be used on the BLX chart as it goes back to July 2010. This script shows you the Moving Average with the length of a full bitcoin cycle, in which a cycle is defined as a period between two reward halvings; i.e. 210.000 blocks. After data analysis in Python, I found that the average inter arrival time is a bit lower than the often communicated 10minutes; it's 9.46minutes, which makes the 210.000 block interval equal to 1379days. The 1379d Moving Average seems to serve well as a support for the price of bitcoin over time and it's 4th 2^n multiple did a good job in catching the cycle tops. If you like this indicator, please leave some claps for the Medium article in which I introduced this indicator: medium.com Индикатор Pine Script®от Marc3lBurg3r192