(JS) S&P 500 Volatility Oscillator For OptionsThe idea for this started here: www.tradingview.com with the user @dime
This should only be used on SPX or SPY (though you could use it on other things for correlation I suppose) given that the instrument used to create this calculation is derived from the S&P 500 (thank you VIX). There's a lot of moving parts here though, so allow me to explain...
First: The main signal is when Implied Volatility (from VIX) drops beneath Historical Volatility - which is what you want to see so you aren't purchasing a ton of premium on long options. Green and above 0 means that IV% has dropped lower than Historical Volatility. (this signal, for example, would suggest using a Long Call or Put depending on your sentiment)
Second: The green line running underneath zero is the bottom portion of the "Average True Range" derived from the values used to create the oscillator. the closer the bottom histogram is to the green line, the more "normal" IV% is. Obviously, if this gets far away from the line then it could be setting up nicely to short options and sell the IV premium to someone else. (this signal, for example, would suggest using something like a Bull Put Spread)
Third: The red background along with the white line that drops down below zero signals when (and how far) the IV% from 3 months out (from VIX3M) is less than the current IV%. This would signal the current environment has IV way too high, a signal to short options once again (and don't take any long option positions!).
Tried to make this simple, yet effective. If you trade options on SPX, SPY, even ES1! futures - this is a tool tailored specifically for you! As I said before, if you want you can use it for correlation on other securities. Any other ideas or suggestions surrounding this, please let me know! Enjoy!
Spy!

VIX INDICATORWorks best as an intraday indicator
Background black & line green = Long VIX
Background black & red line = No trade
Background orange & line green = Consider selling
Background orange & line red = Short VIX

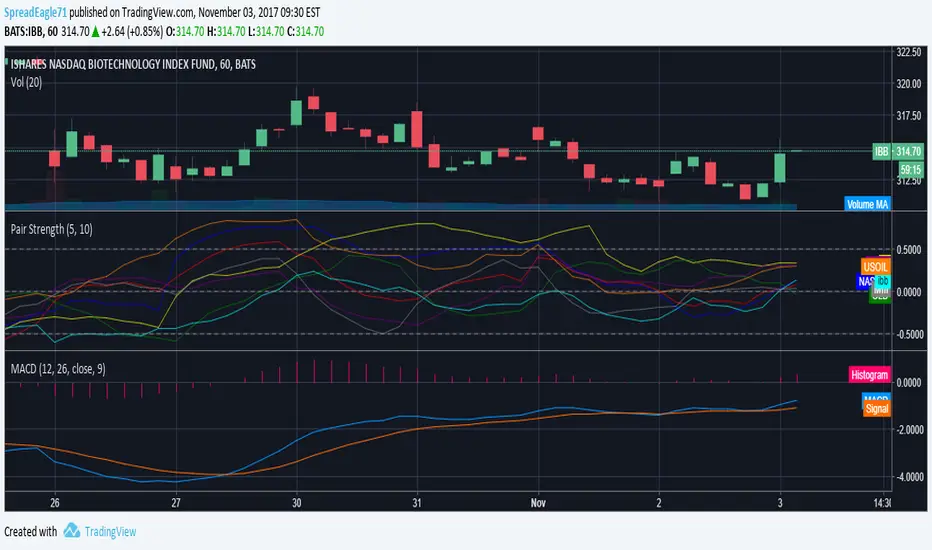
Pair Strength: Updated Version of the one by GlazI updated this version used for Forex with Stock&Index related instruments. Enjoy.
SMART4TRADER-UP-DOWN Stock Exchange Volume (SPY)Shows the trend direction for the S&P500
Показывает направление тренда для S&P500

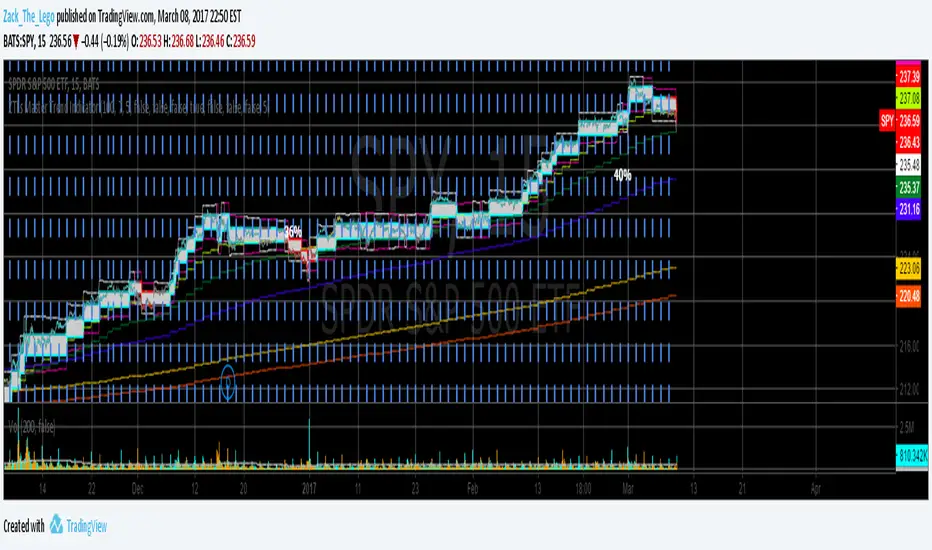
ZTLs Master Trend IndicatorIndicator utilizing a flexible renko (and other indicators assembled in a proprietary way) to "soften" the turbulence. A down-turn in renko combined with a red color signals a sell. An up-turn in renko combined with an aqua color signals a buy. Manually backtested: SPY, JNK, from May 2015 to present: 40%, 24% respectively. Can be used for day-trading or position trading. Has customizeable settings to suit your style. NOT SUITABLE FOR FOREX. (at least not tested)
Session barsthis script marks off the extended hours trading for NY session. Shades the off hours and overnight data. Highlights the regular trading session for NY session. It can be adjusted for any particular market.
I use it specifically to show the missing data on the SPY as compared with the continuous data on the SPX500.

Fibonacci Bollinger BandsThese Bollinger bands feature Fibonacci retracements to very clearly show areas of support and resistance. The basis is calculate off of the Volume Weighted Moving Average. The Bands are 3 standard deviations away from the mean. 99.73% of observations should be in this range.

After Hours Daytime - Consistency
Use only on Daily charts!!
When average AH moves are consistent with average daytime moves it tends to indicate a trend. The phenomenon is not obvious on a day to day basis but is easy to see with the smoothed changes.
Blue is smoothed daytime change and black is smoothed AH gap. The length is how many periods back to start the differentiation between AH and daytime.
Pink background shows BOTH smoothed AH and daytime changes are falling.
Lime background indicates both are rising.
When used on NYA with parameters shown the indicator give warnings with high specificity and reliability for the broader

ATR Pips [LazyBear] [Elixium Mod: FEAR GAUGE]Modified version of ATR Pips
The indicator's value is a third of the daily range which is good to use as a stop loss value for intra day scalping on markets such as index futures and forex.
It's good for detecting and confirming inflection points in the market.

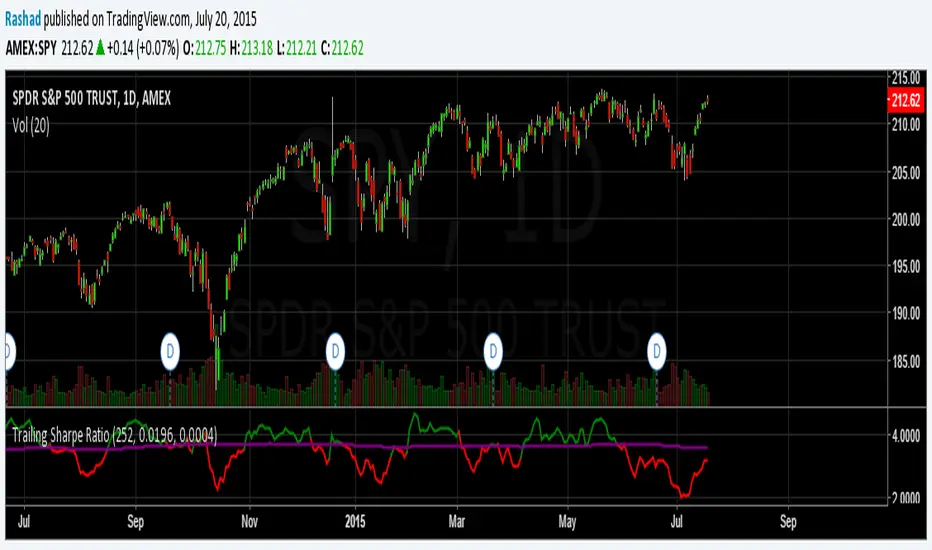
Trailing Sharpe RatioThe Sharpe ratio allows you to see whether or not an investment has historically provided a return appropriate to its risk level. A Sharpe ratio above one is acceptable, above 2 is good, and above 3 is excellent. A Sharpe ratio less than one would indicate that an investment has not returned a high enough return to justify the risk of holding it. Interesting in this example, SPY's one year avg Sharpe ratio is above 3. This would mean on average SPY returns 3x better returns than the risk associated with holding it, implying there is some sort of underlying value to the investment.
When the sharpe ratio is above its signal, this implies the investment is currently outperforming compared to its typical return, below the signal means the investment is currently under performing. A negative Shape would mean that the investment has not provided a positive return, and may be a possible short candidate.
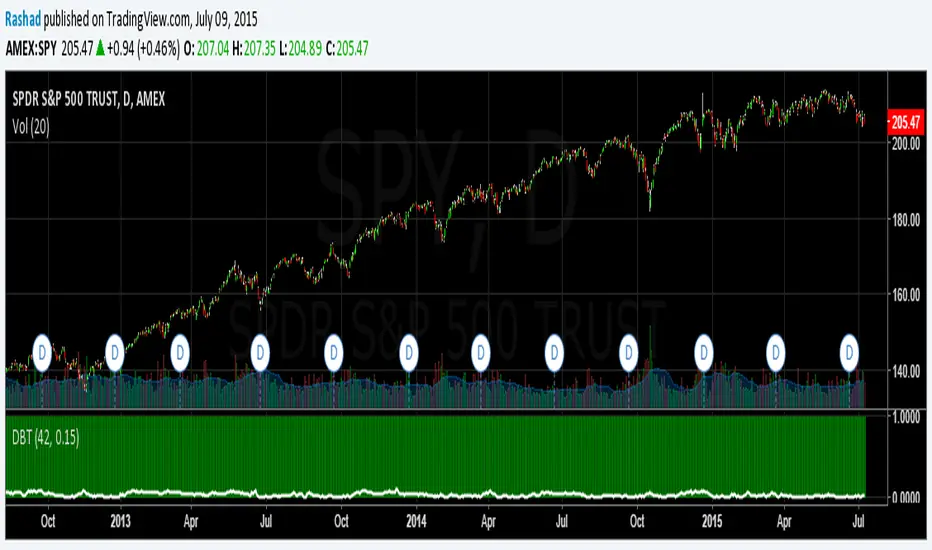
Deviation Back Tester (Great for Credit Spreads)!Error with math fixed in this one. Please use this one.
This is great for credit spreads! Lets say you wanted to know if you had sold a 15% OTM Bull Put vertical 2 months out, how often would you win? This Turns green if you would have been correct with your credit spread had it expired on that date, or red if you would've been wrong. Great for Back testing!
This could also be used for ATM debit spreads credit spreads etc. Example, how often does SPY deviate outside a 10% range relative to two months, 5% (if your doing straddles perhaps) etc.
This Can be used with any stock.
PLEASE KEEP IN MIND THAT IT TESTS DEVIATION IN BOTH DIRECTIONS. THEREFORE IT WILL HIGHLIGHT RED ON BOTH THE UPSIDE AND DOWNSIDE. WHEN BACKTESTING BE SURE TO CHECK WHETHER IT IS RED BECAUSE OF DOWNSIDE OR UPSIDE.