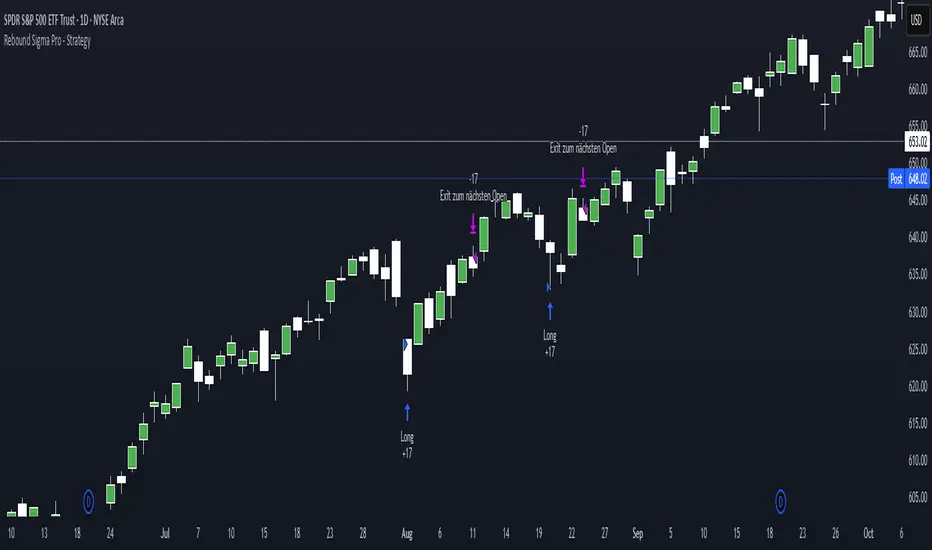
Rebound Sigma Pro - StrategyOverview
Rebound Sigma Pro is a mean-reversion indicator that detects statistically oversold conditions in trending markets.
It helps traders identify potential short-term rebounds based on momentum exhaustion and volatility-adjusted entry zones.
Concept
The indicator combines two quantitative components:
Short-term momentum to detect short-term exhaustion
Trend filter to ensure setups align with the long-term direction
When a stock in an uptrend becomes temporarily oversold, a limit-entry signal is plotted.
The trade is then tracked until short-term conditions normalize or a time-based exit occurs.
Visual Signals
Green Triangle: Suggests placing a limit order for the next session
Green Circle: Confirms entry was filled
Red Triangle: Signals an exit for the next session’s open
Orange Background: Pending order
Green Background: Position active
Red Background: Exit phase
Yellow Line: Entry reference price
User Inputs
Limit Entry (% below previous close) – Default 1 %
Use Limit Entry – Switch between limit or market entries
Enable Time Exit – Optional holding-period constraint
Maximum Holding Days
All other internal parameters (momentum length, filters) are pre-configured.
Alerts
Limit Order Signal: New setup detected
Entry Confirmed: Order filled
Exit Signal: Exit expected next day
Usage
Designed for liquid equities and ETFs
Works best in confirmed uptrends
Backtesting encouraged to adapt parameters per symbol and timeframe
Notes
Not an automated strategy; manual order execution required
Past behavior does not imply future performance
Always apply sound position sizing and risk management
Disclaimer
This indicator is provided for educational and analytical purposes only.
It does not constitute financial advice or performance assurance.
Stocktrading
AccumulationPro Money Flow StrategyAccumulationPro Money Flow Strategy identifies stock trading opportunities by analyzing money flow and potential long-only opportunities following periods of increased money inflow. It employs proprietary responsive indicators and oscillators to gauge the strength and momentum of the inflow relative to previous periods, detecting money inflow, buying/selling pressure, and potential continuation/reversals, while using trailing stop exits to maximize gains while minimizing losses, with careful consideration of risk management and position sizing.
Setup Instructions:
1. Configuring the Strategy Properties:
Click the "Settings" icon (the gear symbol) next to the strategy name.
Navigate to the "Properties" tab within the Settings window.
Initial Capital: This value sets the starting equity for the strategy backtesting. Keep in mind that you will need to specify your current account size in the "Inputs" settings for position sizing.
Base Currency: Leave this setting at its "Default" value.
Order Size: This setting, which determines the capital used for each trade during backtesting, is automatically calculated and updated by the script. You should leave it set to "1 Contract" and the script will calculate the appropriate number of contracts based on your risk per trade, account size, and stop-loss placement.
Pyramiding: Set this setting at 1 order to prevent the strategy from adding to existing positions.
Commission: Enter your broker's commission fee per trade as a percentage, some brokers might offer commission free trading. Verify Price for limit orders: Keep this value as 0 ticks.
Slippage: This value depends on the instrument you are trading, If you are trading liquid stocks on a 1D chart slippage might be neglected. You can Keep this value as 1 ticks if you want to be conservative.
Margin for long positions/short positions: Set both of these to 100% since this strategy does not employ leverage or margin trading.
Recalculate:
Select the "After order is filled" option.
Select the "On every tick" option.
Fill Orders: Keep “Using bar magnifier” unselected.
Select "On bar close". Select "Using standard OHLC"
2. Configuring the Strategy Inputs:
Click the "Inputs" tab in the Settings window.
From/Thru (Date Range): To effectively backtest the strategy, define a substantial period that includes various bullish and bearish cycles. This ensures the testing window captures a range of market conditions and provides an adequate number of trades. It is usually favorable to use a minimum of 8 years for backtesting. Ensure the "Show Date Range" box is checked.
Account Size: This is your actual current Account Size used in the position sizing table calculations.
Risk on Capital %: This setting allows you to specify the percentage of your capital you are willing to risk on each trade. A common value is 0.5%.
3. Configuring Strategy Style:
Select the "Style" tab.
Select the checkbox for “Stop Loss” and “Stop Loss Final” to display the black/red Average True Range Stop Loss step-lines
Make sure the checkboxes for "Upper Channel", "Middle Line", and "Lower Channel" are selected.
Select the "Plots Background" checkboxes for "Color 0" and "Color 1" so that the potential entry and exit zones become color-coded.
Having the checkbox for "Tables" selected allows you to see position sizing and other useful information within the chart.
Have the checkboxes for "Trades on chart" and "Signal Labels" selected for viewing entry and exit point labels and positions.
Uncheck* the "Quantity" checkbox.
Precision: select “Default”.
Check “Labels on price scale”
Check “Values in status line”
Strategy Application Guidelines:
Entry Conditions:
The strategy identifies long entry opportunities based on substantial money inflow, as detected by our proprietary indicators and oscillators. This assessment considers the strength and momentum of the inflow relative to previous periods, in conjunction with strong price momentum (indicated by our modified, less-lagging MACD) and/or a potential price reversal (indicated by our modified, less-noisy Stochastic). Additional confirmation criteria related to price action are also incorporated. Potential entry and exit zones are visually represented by bands on the chart.
A blue upward-pointing arrow, accompanied by the label 'Long' and green band fills, signifies a long entry opportunity. Conversely, a magenta downward-pointing arrow, labeled 'Close entry(s) order Long' with yellow band fills, indicates a potential exit.
Take Profit:
The strategy employs trailing stops, rather than fixed take-profit levels, to maximize gains while minimizing losses. Trailing stops adjust the stop-loss level as the stock price moves in a favorable direction. The strategy utilizes two types of trailing stop mechanisms: one based on the Average True Range (ATR), and another based on price action, which attempts to identify shifts in price momentum.
Stop Loss:
The strategy uses an Average True Range (ATR)-based stop-loss, represented by two lines on the chart. The black line indicates the primary ATR-based stop-loss level, set upon trade entry. The red line represents a secondary ATR stop-loss buffer, used in the position sizing calculation to account for potential slippage or price gaps.
To potentially reduce the risk of stop-hunting, discretionary traders might consider using a market sell order within the final 30 to 60 minutes of the main session, instead of automated stop-loss orders.
Order Types:
Market Orders are intended for use with this strategy, specifically when the candle and signal on the chart stabilize within the final 30 to 60 minutes of the main trading session.
Position Sizing:
A key aspect of this strategy is that its position size is calculated and displayed in a table on the chart. The position size is calculated based on stop-loss placement, including the stop-loss buffer, and the capital at risk per trade which is commonly set around 0.5% Risk on Capital per Trade.
Backtesting:
The backtesting results presented below the chart are for informational purposes only and are not intended to predict future performance. Instead, they serve as a tool for identifying instruments with which the strategy has historically performed well.
It's important to note that the backtester utilizes a tiny portion of the capital for each trade while our strategy relies on a diversified portfolio of multiple stocks or instruments being traded at once.
Important Considerations:
Volume data is crucial; the strategy will not load or function correctly without it. Ensure that your charts include volume data, preferably from a centralized exchange.
Our system is designed for trading a portfolio. Therefore, if you intend to use our system, you should employ appropriate position sizing, without leverage or margin, and seek out a variety of long opportunities, rather than opening a single trade with an excessively large position size.
If you are trading without automated signals, always allow the chart to stabilize. Refrain from taking action until the final 1 hour to 30 minutes before the end of the main trading session to minimize the risk of acting on false signals.
To align with the strategy's design, it's generally preferable to enter a trade during the same session that the signal appears, rather than waiting for a later session.
Disclaimer:
Trading in financial markets involves a substantial degree of risk. You should be aware of the potential for significant financial losses. It is imperative that you trade responsibly and avoid overtrading, as this can amplify losses. Remember that market conditions can change rapidly, and past performance is not indicative of future results. You could lose some or all of your initial investment. It is strongly recommended that you fully understand the risks involved in trading and seek independent financial advice from a qualified professional before using this strategy.

Qullamaggie [Modified] | FractalystWhat's the purpose of this strategy?
The strategy aims to identify high-probability breakout setups in trending markets, inspired by Kristjan "Qullamaggie" Kullamägi’s approach.
It focuses on capturing explosive price moves after periods of consolidation, using technical criteria like moving averages, breakouts, trailing stop-loss and momentum confirmation.
Ideal for swing traders seeking to ride strong trends while managing risk.
----
How does the strategy work?
The strategy follows a systematic process to capture high-momentum breakouts:
Pre-Breakout Criteria:
Prior Price Surge: Identifies stocks that have rallied 30-100%+ in recent month(s), signaling strong underlying momentum (per Qullamaggie’s volatility expansion principles).
Consolidation Phase: Looks for a tightening price range (e.g., flag, pennant, or tight base), indicating a potential "coiling" before continuation.
Trend Confirmation: Uses moving averages (e.g., 20/50/200 EMA) to ensure the stock is trading above key averages on the daily chart, confirming an uptrend.
Price Break: Enters when price clears the consolidation high with conviction.
Risk Management:
Initial Stop Loss: Placed below the consolidation low or a recent swing point to limit downside.
Break-Even Adjustment: Moves stop loss to breakeven once the trade reaches 1.5x risk-to-reward (RR), securing a "free trade" while letting winners run.
Trailing Stop (Unique Edge):
Market Structure Trailing: Instead of trailing via moving averages, the stop is dynamically adjusted using structural invalidation level. This adapts to price action, allowing the trade to stay open during volatile retracements while locking in gains as new structure forms.
Why This Matters: Most strategies use rigid trailing stops (e.g., below the 10EMA), which often exit prematurely in choppy markets. By trailing based on structure, this strategy avoids "noise" and captures larger trends, directly boosting overall returns.
----
What markets or timeframes is this suited for?
This is a long-only strategy designed for trending markets, and it performs best in:
Markets: Stocks (especially high-growth, liquid equities), cryptocurrencies (major pairs with strong volatility), commodities (e.g., oil, gold), and futures (index/commodity futures).
Timeframes: Primarily daily charts for swing trades (1-30 day holds), though weekly charts can help confirm broader trends.
Key Advantage: The TradingView script allows instant backtesting with adjustable parameters
You can:
- Test historical performance across multiple markets to identify which assets align best with the strategy.
- Optimize settings (e.g., trailing stop sensitivity, moving averages etc.) to match a market’s volatility profile.
Build a diversified portfolio by filtering for markets that show consistent profitability in backtests.
For example, you might discover cryptos require tighter trailing stops due to volatility, while stocks thrive with wider structural stops. The script automates this analysis, letting you to trade confidently.
----
What indicators or tools does the strategy use?
The strategy combines customizable technical tools with strict anti-lookahead safeguards:
Core Indicators:
Moving Averages: Adjustable periods (e.g., 20/50/200 EMA or SMA) and timeframes (daily/weekly) to confirm trend alignment. Users can test combinations (e.g., 10EMA vs. 20EMA) to optimize for specific markets.
Breakout Parameters:
Consolidation Length: Adjustable window to define the "tightness" of the pre-breakout pattern.
Entry Models: Flexible entry logics (Breakouts and fractals)
Anti-Lookahead Design:
All calculations (e.g., moving averages, consolidation ranges, volume averages) use only closed/confirmed data available at the time of the signal.
----
How do I manage risk with this strategy?
The strategy prioritizes customizable risk controls to align with your trading style and account size:
User-Defined Risk Inputs:
Risk Per Trade: Set a % of Equity (e.g., 1-2%) to determine position size. The strategy auto-calculates shares/contracts to match your selected risk per trade.
Flexibility: Choose between fixed risk or equity-based scaling.
The script adjusts position sizing dynamically based on your selection.
Pyramiding Feature:
Customizable Entries: Adjust the number of pyramiding trades allowed (e.g., 1-3 additional positions) in the strategy settings. Each new entry is triggered only if the prior trade hits its 1.5x RR target and the trend remains intact.
Risk-Scaled Additions: New positions use profits from prior trades, compounding gains without increasing initial risk.
Risk-Free Trade Mechanic:
Once a trade reaches 1.5x RR, the stop loss is moved to breakeven, eliminating downside risk.
The strategy then opens a new position (if pyramiding is enabled) using a portion of the locked-in profit. This "snowballs" winners while keeping total capital exposure stable.
Impact on Net Profit & Drawdown:
Net Profit Boost: Pyramiding lets you ride multi-leg trends aggressively. For example, a 100% runner could generate 2-3x more profit vs. a single-entry approach.
Controlled Drawdowns: Since new positions are funded by profits (not initial capital), max drawdown stays anchored to your original risk per trade (e.g., 1-2% of account). Even if later entries fail, the breakeven stop on prior trades protects overall equity.
Why This Works: Most strategies either over-leverage (increasing drawdowns) or exit too early. By recycling profits into new positions only after securing risk-free capital, this approach mimics hedge fund "scaling in" tactics while staying retail-trader friendly.
----
How does the strategy identify market structure for its trailing stoploss?
The strategy identifies market structure by utilizing an efficient logic with for loops to pinpoint the first swing candle that features a pivot of 2. This marks the beginning of the break of structure, where the market's previous trend or pattern is considered invalidated or changed.
----
What are the underlying calculations?
The underlying calculations involve:
Identifying Swing Points: The strategy looks for swing highs (marked with blue Xs) and swing lows (marked with red Xs). A swing high is identified when a candle's high is higher than the highs of the candles before and after it. Conversely, a swing low is when a candle's low is lower than the lows of the candles before and after it.
Break of Structure (BOS):
Bullish BOS: This occurs when the price breaks above the swing high level of the previous structure, indicating a potential shift to a bullish trend.
Bearish BOS: This happens when the price breaks below the swing low level of the previous structure, signaling a potential shift to a bearish trend.
Structural Liquidity and Invalidation:
Structural Liquidity: After a break of structure, liquidity levels are updated to the first swing high in a bullish BOS or the first swing low in a bearish BOS.
Structural Invalidation: If the price moves back to the level of the first swing low before the bullish BOS or the first swing high before the bearish BOS, it invalidates the break of structure, suggesting a potential reversal or continuation of the previous trend.
This method provides users with a technical approach to filter market regimes, offering an advantage by minimizing the risk of overfitting to historical data, which is often a concern with traditional indicators like moving averages.
By focusing on identifying pivotal swing points and the subsequent breaks of structure, the strategy maintains a balance between sensitivity to market changes and robustness against historical data anomalies, ensuring a more adaptable and potentially more reliable market analysis tool.
----
What entry criteria are used in this script?
The script uses two entry models for trading decisions: BreakOut and Fractal.
Underlying Calculations:
Breakout: The script records the most recent swing high by storing it in a variable. When the price closes above this recorded level, and all other predefined conditions are satisfied, the script triggers a breakout entry. This approach is considered conservative because it waits for the price to confirm a breakout above the previous high before entering a trade. As shown in the image, as soon as the price closes above the new candle (first tick), the long entry gets taken. The stop-loss is initially set and then moved to break-even once the price moves in favor of the trade.
Fractal: This method involves identifying a swing low with a period of 2, which means it looks for a low point where the price is lower than the two candles before and after it. Once this pattern is detected, the script executes the trade. This is an aggressive approach since it doesn't wait for further price confirmation. In the image, this is represented by the 'Fractal 2' label where the script identifies and acts on the swing low pattern.
----
What type of stop-loss identification method are used in this strategy?
This strategy employs two types of stop-loss methods: Initial Stop-loss and Trailing Stop-Loss.
Underlying Calculations:
Initial Stop-loss:
ATR Based: The strategy uses the Average True Range (ATR) to set an initial stop-loss, which helps in accounting for market volatility without predicting price direction.
Calculation:
- First, the True Range (TR) is calculated for each period, which is the greatest of:
- Current Period High - Current Period Low
- Absolute Value of Current Period High - Previous Period Close
- Absolute Value of Current Period Low - Previous Period Close
- The ATR is then the moving average of these TR values over a specified period, typically 14 periods by default. This ATR value can be used to set the stop-loss at a distance from the entry price that reflects the current market volatility.
Swing Low Based:
For this method, the stop-loss is set based on the most recent swing low identified in the market structure analysis. This approach uses the lowest point of the recent price action as a reference for setting the stop-loss.
Trailing Stop-Loss:
The strategy uses structural liquidity and structural invalidation levels across multiple timeframes to adjust the stop-loss once the trade is profitable. This method involves:
Detecting Structural Liquidity: After a break of structure, the liquidity levels are updated to the first swing high in a bullish scenario or the first swing low in a bearish scenario. These levels serve as potential areas where the price might find support or resistance, allowing the stop-loss to trail the price movement.
Detecting Structural Invalidation: If the price returns to the level of the first swing low before a bullish break of structure or the first swing high before a bearish break of structure, it suggests the trend might be reversing or invalidating, prompting the adjustment of the stop-loss to lock in profits or minimize losses.
By using these methods, the strategy dynamically adjusts the initial stop-loss based on market volatility, helping to protect against adverse price movements while allowing for enough room for trades to develop. The ATR-based stop-loss adapts to the current market conditions by considering the volatility, ensuring that the stop-loss is not too tight during volatile periods, which could lead to premature exits, nor too loose during calm markets, which might result in larger losses. Similarly, the swing low based stop-loss provides a logical exit point if the market structure changes unfavorably.
Each market behaves differently across various timeframes, and it is essential to test different parameters and optimizations to find out which trailing stop-loss method gives you the desired results and performance. This involves backtesting the strategy with different settings for the ATR period, the distance from the swing low, and how the trailing stop-loss reacts to structural liquidity and invalidation levels.
Through this process, you can tailor the strategy to perform optimally in different market environments, ensuring that the stop-loss mechanism supports the trade's longevity while safeguarding against significant drawdowns.
----
What type of break-even method is used in this strategy? What are the underlying calculations?
Moves the initial stop-loss to the entry price when the price reaches a certain RR ratio.
Calculation:
Break-even level = Entry Price + (Initial Risk * RR Ratio)
----
What tables are available in this script?
- Summary: Provides a general overview, displaying key performance parameters such as Net Profit, Profit Factor, Max Drawdown, Average Trade, Closed Trades and more.
Total Commission: Displays the cumulative commissions incurred from all trades executed within the selected backtesting window. This value is derived by summing the commission fees for each trade on your chart.
Average Commission: Represents the average commission per trade, calculated by dividing the Total Commission by the total number of closed trades. This metric is crucial for assessing the impact of trading costs on overall profitability.
Avg Trade: The sum of money gained or lost by the average trade generated by a strategy. Calculated by dividing the Net Profit by the overall number of closed trades. An important value since it must be large enough to cover the commission and slippage costs of trading the strategy and still bring a profit.
MaxDD: Displays the largest drawdown of losses, i.e., the maximum possible loss that the strategy could have incurred among all of the trades it has made. This value is calculated separately for every bar that the strategy spends with an open position.
Profit Factor: The amount of money a trading strategy made for every unit of money it lost (in the selected currency). This value is calculated by dividing gross profits by gross losses.
Avg RR: This is calculated by dividing the average winning trade by the average losing trade. This field is not a very meaningful value by itself because it does not take into account the ratio of the number of winning vs losing trades, and strategies can have different approaches to profitability. A strategy may trade at every possibility in order to capture many small profits, yet have an average losing trade greater than the average winning trade. The higher this value is, the better, but it should be considered together with the percentage of winning trades and the net profit.
Winrate: The percentage of winning trades generated by a strategy. Calculated by dividing the number of winning trades by the total number of closed trades generated by a strategy. Percent profitable is not a very reliable measure by itself. A strategy could have many small winning trades, making the percent profitable high with a small average winning trade, or a few big winning trades accounting for a low percent profitable and a big average winning trade. Most mean-reversion successful strategies have a percent profitability of 40-80% but are profitable due to risk management control.
BE Trades: Number of break-even trades, excluding commission/slippage.
Losing Trades: The total number of losing trades generated by the strategy.
Winning Trades: The total number of winning trades generated by the strategy.
Total Trades: Total number of taken traders visible your charts.
Net Profit: The overall profit or loss (in the selected currency) achieved by the trading strategy in the test period. The value is the sum of all values from the Profit column (on the List of Trades tab), taking into account the sign.
- Monthly: Displays performance data on a month-by-month basis, allowing users to analyze performance trends over each month and year.
- Weekly: Displays performance data on a week-by-week basis, helping users to understand weekly performance variations.
- UI Table: A user-friendly table that allows users to view and save the selected strategy parameters from user inputs. This table enables easy access to key settings and configurations, providing a straightforward solution for saving strategy parameters by simply taking a screenshot with Alt + S or ⌥ + S.
User-input styles and customizations:
Please note that all background colors in the style are disabled by default to enhance visualization.
How to Use This Strategy to Create a Profitable Edge and Systems?
Choose Your Strategy mode:
- Decide whether you are creating an investing strategy or a trading strategy.
Select a Market:
- Choose a one-sided market such as stocks, indices, or cryptocurrencies.
Historical Data:
- Ensure the historical data covers at least 10 years of price action for robust backtesting.
Timeframe Selection:
- Choose the timeframe you are comfortable trading with. It is strongly recommended to use a timeframe above 15 minutes to minimize the impact of commissions/slippage on your profits.
Set Commission and Slippage:
- Properly set the commission and slippage in the strategy properties according to your broker/prop firm specifications.
Parameter Optimization:
- Use trial and error to test different parameters until you find the performance results you are looking for in the summary table or, preferably, through deep backtesting using the strategy tester.
Trade Count:
- Ensure the number of trades is 200 or more; the higher, the better for statistical significance.
Positive Average Trade:
- Make sure the average trade is above zero.
(An important value since it must be large enough to cover the commission and slippage costs of trading the strategy and still bring a profit.)
Performance Metrics:
- Look for a high profit factor, and net profit with minimum drawdown.
- Ideally, aim for a drawdown under 20-30%, depending on your risk tolerance.
Refinement and Optimization:
- Try out different markets and timeframes.
- Continue working on refining your edge using the available filters and components to further optimize your strategy.
What Makes This Strategy Unique?
This strategy combines flexibility, smart risk management, and momentum focus in a way that’s rare and practical:
1. Adapts to Any Market Rhythm
Works on daily, weekly, or intraday charts without code changes.
Uses two entry types: classic breakouts (like trending stocks) or fractal patterns (to avoid false starts).
2. Smarter Stop-Loss System
No rigid rules: Stops adjust based on price structure (e.g., new “higher lows”), not fixed percentages.
Avoids whipsaws: Tightens stops only when the trend strengthens, not in choppy markets.
3. Safe Profit-Boosting Pyramiding
Adds new positions only after prior trades are risk-free (stops moved above breakeven).
Scales up using locked-in profits, not new capital, to grow gains safely.
4. Built-In Momentum Check
Tracks 1/3/6-month price growth to spotlight stocks with strong, lasting momentum.
Terms and Conditions | Disclaimer
Our charting tools are provided for informational and educational purposes only and should not be construed as financial, investment, or trading advice. They are not intended to forecast market movements or offer specific recommendations. Users should understand that past performance does not guarantee future results and should not base financial decisions solely on historical data.
Built-in components, features, and functionalities of our charting tools are the intellectual property of @Fractalyst Unauthorized use, reproduction, or distribution of these proprietary elements is prohibited.
- By continuing to use our charting tools, the user acknowledges and accepts the Terms and Conditions outlined in this legal disclaimer and agrees to respect our intellectual property rights and comply with all applicable laws and regulations.

Simple APF Strategy Backtesting [The Quant Science]Simple backtesting strategy for the quantitative indicator Autocorrelation Price Forecasting. This is a Buy & Sell strategy that operates exclusively with long orders. It opens long positions and generates profit based on the future price forecast provided by the indicator. It's particularly suitable for trend-following trading strategies or directional markets with an established trend.
Main functions
1. Cycle Detection: Utilize autocorrelation to identify repetitive market behaviors and cycles.
2. Forecasting for Backtesting: Simulate trades and assess the profitability of various strategies based on future price predictions.
Logic
The strategy works as follow:
Entry Condition: Go long if the hypothetical gain exceeds the threshold gain (configurable by user interface).
Position Management: Sets a take-profit level based on the future price.
Position Sizing: Automatically calculates the order size as a percentage of the equity.
No Stop-Loss: this strategy doesn't includes any stop loss.
Example Use Case
A trader analyzes a dayli period using 7 historical bars for autocorrelation.
Sets a threshold gain of 20 points using a 5% of the equity for each trade.
Evaluates the effectiveness of a long-only strategy in this period to assess its profitability and risk-adjusted performance.
User Interface
Length: Set the length of the data used in the autocorrelation price forecasting model.
Thresold Gain: Minimum value to be considered for opening trades based on future price forecast.
Order Size: percentage size of the equity used for each single trade.
Strategy Limit
This strategy does not use a stop loss. If the price continues to drop and the future price forecast is incorrect, the trader may incur a loss or have their capital locked in the losing trade.
Disclaimer!
This is a simple template. Use the code as a starting point rather than a finished solution. The script does not include important parameters, so use it solely for educational purposes or as a boilerplate.

DCA Alpha 1.0 Trading Tool for Dollar-Cost Averaging
Description:
DCA Alpha 1.0 is a precision-engineered trading tool designed to assist traders and investors in accumulating assets during market downturns. Using proprietary algorithms that combine momentum decay, extreme price deviation metrics, trend dynamics, divergence analysis, and mean regression, it identifies potential bottom extreme zones in various asset classes such as indices, stocks, crypto, and commodities.
This indicator highlights market conditions where assets are oversold, undervalued, or experiencing capitulation—providing disciplined, unleveraged dollar-cost averaging (DCA) opportunities. Ideal for long-term growth strategies, DCA Alpha 1.0 helps cut through market noise, pinpointing moments of peak fear and maximum reward potential.
Whether navigating volatile crypto markets, timing corrections in indices, or accumulating commodities, DCA Alpha 1.0 serves as a vital tool for mastering the art of buying low and building your assets up strategically.
Instructions:
Getting Started:
Add the Indicator:
Install DCA Alpha 1.0 on your TradingView chart.
Select your preferred asset class: stocks, indices, crypto, or commodities.
Choose an appropriate timeframe (e.g., daily or weekly for long-term DCA strategies).
Customize Inputs: Adjust the following settings to align with your strategy:
Percentage of Equity to Trade: Define the portion of your portfolio to allocate per signal (default: 1% equity).
Profit Target Percentages: Set thresholds for locking in gains (default: 50% on lower timeframes, 500% on higher timeframes).
Zones and Signals:
Extreme Negative Zones:
What It Represents:
These zones highlight conditions where prices are deeply oversold, indicating extreme bearish sentiment. The market is likely nearing a bottom, offering high-probability buying opportunities.
Entry Signals:
When the price enters these extreme negative zones, visual markers (e.g., green triangles or other indicators) will signal a potential buying opportunity. These moments are indicative of market exhaustion, signaling that a reversal could be imminent.
Momentum Decay & Divergence:
Momentum decay occurs when price movement slows over time. In extreme negative zones, if prices continue to fall but at a diminishing rate (e.g., decreased volume or a fading oscillator), it suggests weakening bearish momentum. This, coupled with bullish divergence (oscillator forming higher lows while price makes lower lows), signifies a reversal, making it an ideal point to consider dollar-cost averaging into the asset.
Neutral Zones:
What It Represents:
The neutral zone is a state of market equilibrium, where prices are neither overbought nor oversold. The market is in a balanced state, with no strong trend emerging.
Mean Regression:
In a neutral zone, the market is reverting to its mean or average price after overreacting in either direction. A price transition from extreme zones (overbought/oversold) to the neutral zone suggests a reversion to the market's long-term average, making this a period of reduced volatility and uncertainty.
Entering or Exiting Neutral Zones:
Traders should avoid entering or exiting positions during neutral zone conditions unless transitioning from an extreme zone (negative or positive). Transitioning from an extreme negative zone to neutral may suggest an opportunity to accumulate assets gradually, while a shift from neutral to an extreme negative zone may indicate a deeper correction and warrant caution.
Momentum Decay & Divergence (Exiting Neutral Zone):
If prices are rising but the oscillator shows lower highs (bearish divergence), and momentum is fading, this could signal a pullback. A transition out of the neutral zone in this context may prompt traders to hold off on new positions or consider profit-taking.
Extreme Positive Zones:
What It Represents:
Markets can also become overbought or overvalued. When price enters extreme positive zones, the asset may be overvalued, suggesting potential selling or a waiting period.
Exit Signals:
Red triangle indicators signal potential exit points when prices reach overbought conditions, signaling a time to lock in profits and reduce exposure.
Momentum Decay & Divergence (Exiting Positive Zone):
When prices are making new highs but momentum is weakening (momentum decay) and the oscillator is showing lower highs (bearish divergence), this could indicate a faltering rally. Such conditions represent an ideal time to reduce exposure or exit positions.
Key Inputs for Customization:
Percentage of Equity to Trade:
This setting allows you to allocate a portion of your total portfolio per buy signal. By default, 1% of equity is used per signal, but this can be adjusted based on your risk tolerance and strategy.
Profit Target Percentages:
These thresholds help lock in gains once the price moves a set percentage in your favor.
Lower Timeframes: Default profit target of 50%.
Higher Timeframes: Default profit target of 500%.
These settings can be customized for specific risk/reward preferences.
Warning!!! : Aggressive Mode
Aggressive Mode is an advanced feature designed for traders who want to increase the frequency of signals during periods of market volatility. This mode will trigger more frequent entries, even into slightly less extreme zones, capturing short-term reversals.
What Aggressive Mode Does:
It amplifies signals by allowing the tool to identify more frequent price reversals, including brief market corrections, increasing trade frequency. While this can offer more trading opportunities, it also exposes you to higher risk.
Warning:
Aggressive Mode should be used only by experienced traders familiar with short-term volatility. The increased frequency of signals could lead to higher risk exposure. Ensure robust risk management practices, such as stop-loss orders and profit-taking strategies, are in place before activating this mode.
Default Setting:
Aggressive Mode is disabled by default. It can be activated at your discretion based on your experience level and risk appetite.
Best Practices:
Focus on High-Quality Assets: Prioritize assets with strong recovery potential (e.g., major indices, blue-chip cryptocurrencies).
Use Longer Timeframes: Minimize market noise and optimize your DCA strategy by focusing on higher timeframes (e.g., daily or weekly charts).
Review Trading Inputs: Regularly adjust your inputs to ensure they align with your financial goals and risk tolerance.
Implement Risk Management: Use stop-loss orders and profit targets to manage risk, especially when using Aggressive Mode.
Disclaimer:
DCA Alpha 1.0 is designed specifically for unleveraged, long-term dollar-cost averaging strategies. It is not intended for day trading or leveraged positions. The tool excels at identifying market dips but cannot guarantee success. Users are fully responsible for their own risk management, including the use of stop-losses, profit targets, and position sizing.
Aggressive Mode increases trade frequency and may lead to higher exposure and potential losses. Only experienced traders should consider using this mode. Always understand the risks involved before incorporating this tool into your trading strategy.

AlgoBuilder [Trend-Following] | FractalystWhat's the strategy's purpose and functionality?
This strategy is designed for both traders and investors looking to rely on and trade based on historical and backtested data using automation. The main goal is to build profitable trend-following strategies that outperform the underlying asset in terms of returns while minimizing drawdown. For example, as for a benchmark, if the S&P 500 (SPX) has achieved an estimated 10% annual return with a maximum drawdown of -57% over the past 20 years, using this strategy with different entry and exit techniques, users can potentially seek ways to achieve a higher Compound Annual Growth Rate (CAGR) while maintaining a lower maximum drawdown.
Although the strategy can be applied to all markets and timeframes, it is most effective on stocks, indices, future markets, cryptocurrencies, and commodities and JPY currency pairs given their trending behaviors.
In trending market conditions, the strategy employs a combination of moving averages and diverse entry models to identify and capitalize on upward market movements. It integrates market structure-based trailing stop-loss mechanisms across different timeframes and provides exit techniques, including percentage-based and risk-reward (RR) based take profit levels.
Additionally, the strategy has also a feature that includes a built-in probability and sentiment function for traders who want to implement probabilities and market sentiment right into their trading strategies.
Performance summary, weekly, and monthly tables enable quick visualization of performance metrics like net profit, maximum drawdown, compound annual growth rate (CAGR), profit factor, average trade, average risk-reward ratio (RR), and more. This aids optimization to meet specific goals and risk tolerance levels effectively.
-----
How does the strategy perform for both investors and traders?
The strategy has two main modes, tailored for different market participants: Traders and Investors.
Trading:
1. Trading (1x):
- Designed for traders looking to capitalize on bullish trending markets.
- Utilizes a percentage risk per trade to manage risk and optimize returns.
- Suitable for active trading with a focus on trend-following and risk management.
- (1x) This mode ensures no stacking of positions, allowing for only one running position or trade at a time.
◓: Mode | %: Risk percentage per trade
2. Trading (2x):
Similar to the 1x mode but allows for two pyramiding entries.
This approach enables traders to increase their position size as the trade moves in their favor, potentially enhancing profits during strong bullish trends.
◓: Mode | %: Risk percentage per trade
3. Investing:
- Geared towards investors who aim to capitalize on bullish trending markets without using leverage while mitigating the asset's maximum drawdown.
- Utilizes 100% of the equity to buy, hold, and manage the asset.
- Focuses on long-term growth and capital appreciation by fully investing in the asset during bullish conditions.
- ◓: Mode | %: Risk not applied (In investing mode, the strategy uses 100% of equity to buy the asset)
-----
What's the purpose of using moving averages in this strategy? What are the underlying calculations?
Using moving averages is a widely-used technique to trade with the trend.
The main purpose of using moving averages in this strategy is to filter out bearish price action and to only take trades when the price is trading ABOVE specified moving averages.
The script uses different types of moving averages with user-adjustable timeframes and periods/lengths, allowing traders to try out different variations to maximize strategy performance and minimize drawdowns.
By applying these calculations, the strategy effectively identifies bullish trends and avoids market conditions that are not conducive to profitable trades.
The MA filter allows traders to choose whether they want a specific moving average above or below another one as their entry condition.
This comparison filter can be turned on (>/<) or off.
For example, you can set the filter so that MA#1 > MA#2, meaning the first moving average must be above the second one before the script looks for entry conditions. This adds an extra layer of trend confirmation, ensuring that trades are only taken in more favorable market conditions.
MA #1: Fast MA | MA #2: Medium MA | MA #3: Slow MA
⍺: MA Period | Σ: MA Timeframe
-----
What entry modes are used in this strategy? What are the underlying calculations?
The strategy by default uses two different techniques for the entry criteria with user-adjustable left and right bars: Breakout and Fractal.
1. Breakout Entries :
- The strategy looks for pivot high points with a default period of 3.
- It stores the most recent high level in a variable.
- When the price crosses above this most recent level, the strategy checks if all conditions are met and the bar is closed before taking the buy entry.
◧: Pivot high left bars period | ◨: Pivot high right bars period
2. Fractal Entries :
- The strategy looks for pivot low points with a default period of 3.
- When a pivot low is detected, the strategy checks if all conditions are met and the bar is closed before taking the buy entry.
◧: Pivot low left bars period | ◨: Pivot low right bars period
By utilizing these entry modes, the strategy aims to capitalize on bullish price movements while ensuring that the necessary conditions are met to validate the entry points.
-----
What type of stop-loss identification method are used in this strategy? What are the underlying calculations?
Initial Stop-Loss:
1. ATR Based:
The Average True Range (ATR) is a method used in technical analysis to measure volatility. It is not used to indicate the direction of price but to measure volatility, especially volatility caused by price gaps or limit moves.
Calculation:
- To calculate the ATR, the True Range (TR) first needs to be identified. The TR takes into account the most current period high/low range as well as the previous period close.
The True Range is the largest of the following:
- Current Period High minus Current Period Low
- Absolute Value of Current Period High minus Previous Period Close
- Absolute Value of Current Period Low minus Previous Period Close
- The ATR is then calculated as the moving average of the TR over a specified period. (The default period is 14).
Example - ATR (14) * 1.5
⍺: ATR period | Σ: ATR Multiplier
2. ADR Based:
The Average Day Range (ADR) is an indicator that measures the volatility of an asset by showing the average movement of the price between the high and the low over the last several days.
Calculation:
- To calculate the ADR for a particular day:
- Calculate the average of the high prices over a specified number of days.
- Calculate the average of the low prices over the same number of days.
- Find the difference between these average values.
- The default period for calculating the ADR is 14 days. A shorter period may introduce more noise, while a longer period may be slower to react to new market movements.
Example - ADR (14) * 1.5
⍺: ADR period | Σ: ADR Multiplier
Application in Strategy:
- The strategy calculates the current bar's ADR/ATR with a user-defined period.
- It then multiplies the ADR/ATR by a user-defined multiplier to determine the initial stop-loss level.
By using these methods, the strategy dynamically adjusts the initial stop-loss based on market volatility, helping to protect against adverse price movements while allowing for enough room for trades to develop.
Trailing Stop-Loss:
One of the key elements of this strategy is its ability to detec buyside and sellside liquidity levels across multiple timeframes to trail the stop-loss once the trade is in running profits.
By utilizing this approach, the strategy allows enough room for price to run.
There are two built-in trailing stop-loss (SL) options you can choose from while in a trade:
1. External Trailing Stop-Loss:
- Uses sell-side liquidity to trail your stop-loss, allowing price to consolidate before continuation. This method is less aggressive and provides more room for price fluctuations.
Example - External - Wick below the trailing SL - 12H trailing timeframe
⍺: Exit type | Σ: Trailing stop-loss timeframe
2. Internal Trailing Stop-Loss:
- Uses the most recent swing low with a period of 2 to trail your stop-loss. This method is more aggressive compared to the external trailing stop-loss, as it tightens the stop-loss closer to the current price action.
Example - Internal - Close below the trailing SL - 6H trailing timeframe
⍺: Exit type | Σ: Trailing stop-loss timeframe
Each market behaves differently across various timeframes, and it is essential to test different parameters and optimizations to find out which trailing stop-loss method gives you the desired results and performance.
-----
What type of break-even and take profit identification methods are used in this strategy? What are the underlying calculations?
For Break-Even:
- You can choose to set a break-even level at which your initial stop-loss moves to the entry price as soon as it hits, and your trailing stop-loss gets activated (if enabled).
- You can select either a percentage (%) or risk-to-reward (RR) based break-even, allowing you to set your break-even level as a percentage amount above the entry price or based on RR.
For TP1 (Take Profit 1):
- You can choose to set a take profit level at which your position gets fully closed or 50% if the TP2 boolean is enabled.
- Similar to break-even, you can select either a percentage (%) or risk-to-reward (RR) based take profit level, allowing you to set your TP1 level as a percentage amount above the entry price or based on RR.
For TP2 (Take Profit 2):
- You can choose to set a take profit level at which your position gets fully closed.
- As with break-even and TP1, you can select either a percentage (%) or risk-to-reward (RR) based take profit level, allowing you to set your TP2 level as a percentage amount above the entry price or based on RR.
The underlying calculations involve determining the price levels at which these actions are triggered. For break-even, it moves the initial stop-loss to the entry price and activate the trailing stop-loss once the break-even level is reached.
For TP1 and TP2, it's specifying the price levels at which the position is partially or fully closed based on the chosen method (percentage or RR) above the entry price.
These calculations are crucial for managing risk and optimizing profitability in the strategy.
⍺: BE/TP type (%/RR) | Σ: how many RR/% above the current price
-----
What's the ADR filter? What does it do? What are the underlying calculations?
The Average Day Range (ADR) measures the volatility of an asset by showing the average movement of the price between the high and the low over the last several days.
The period of the ADR filter used in this strategy is tied to the same period you've used for your initial stop-loss.
Users can define the minimum ADR they want to be met before the script looks for entry conditions.
ADR Bias Filter:
- Compares the current bar ADR with the ADR (Defined by user):
- If the current ADR is higher, it indicates that volatility has increased compared to ADR (DbU).(⬆)
- If the current ADR is lower, it indicates that volatility has decreased compared to ADR (DbU).(⬇)
Calculations:
1. Calculate ADR:
- Average the high prices over the specified period.
- Average the low prices over the same period.
- Find the difference between these average values in %.
2. Current ADR vs. ADR (DbU):
- Calculate the ADR for the current bar.
- Calculate the ADR (DbU).
- Compare the two values to determine if volatility has increased or decreased.
By using the ADR filter, the strategy ensures that trades are only taken in favorable market conditions where volatility meets the user's defined threshold, thus optimizing entry conditions and potentially improving the overall performance of the strategy.
>: Minimum required ADR for entry | %: Current ADR comparison to ADR of 14 days ago.
-----
What's the probability filter? What are the underlying calculations?
The probability filter is designed to enhance trade entries by using buyside liquidity and probability analysis to filter out unfavorable conditions.
This filter helps in identifying optimal entry points where the likelihood of a profitable trade is higher.
Calculations:
1. Understanding Swing highs and Swing Lows
Swing High: A Swing High is formed when there is a high with 2 lower highs to the left and right.
Swing Low: A Swing Low is formed when there is a low with 2 higher lows to the left and right.
2. Understanding the purpose and the underlying calculations behind Buyside, Sellside and Equilibrium levels.
3. Understanding probability calculations
1. Upon the formation of a new range, the script waits for the price to reach and tap into equilibrium or the 50% level. Status: "⏸" - Inactive
2. Once equilibrium is tapped into, the equilibrium status becomes activated and it waits for either liquidity side to be hit. Status: "▶" - Active
3. If the buyside liquidity is hit, the script adds to the count of successful buyside liquidity occurrences. Similarly, if the sellside is tapped, it records successful sellside liquidity occurrences.
5. Finally, the number of successful occurrences for each side is divided by the overall count individually to calculate the range probabilities.
Note: The calculations are performed independently for each directional range. A range is considered bearish if the previous breakout was through a sellside liquidity. Conversely, a range is considered bullish if the most recent breakout was through a buyside liquidity.
Example - BSL > 50%
-----
What's the sentiment Filter? What are the underlying calculations?
Sentiment filter aims to calculate the percentage level of bullish or bearish fluctuations within equally divided price sections, in the latest price range.
Calculations:
This filter calculates the current sentiment by identifying the highest swing high and the lowest swing low, then evenly dividing the distance between them into percentage amounts. If the price is above the 50% mark, it indicates bullishness, whereas if it's below 50%, it suggests bearishness.
Sentiment Bias Identification:
Bullish Bias: The current price is trading above the 50% daily range.
Bearish Bias: The current price is trading below the 50% daily range.
Example - Sentiment Enabled | Bullish degree above 50% | Bullish sentimental bias
>: Minimum required sentiment for entry | %: Current sentimental degree in a (Bullish/Bearish) sentimental bias
-----
What's the range length Filter? What are the underlying calculations?
The range length filter identifies the price distance between buyside and sellside liquidity levels in percentage terms. When enabled, the script only looks for entries when the minimum range length is met. This helps ensure that trades are taken in markets with sufficient price movement.
Calculations:
Range Length (%) = ( ( Buyside Level − Sellside Level ) / Current Price ) ×100
Range Bias Identification:
Bullish Bias: The current range price has broken above the previous external swing high.
Bearish Bias: The current range price has broken below the previous external swing low.
Example - Range length filter is enabled | Range must be above 5% | Price must be in a bearish range
>: Minimum required range length for entry | %: Current range length percentage in a (Bullish/Bearish) range
-----
What's the day filter Filter, what does it do?
The day filter allows users to customize the session time and choose the specific days they want to include in the strategy session. This helps traders tailor their strategies to particular trading sessions or days of the week when they believe the market conditions are more favorable for their trading style.
Customize Session Time:
Users can define the start and end times for the trading session.
This allows the strategy to only consider trades within the specified time window, focusing on periods of higher market activity or preferred trading hours.
Select Days:
Users can select which days of the week to include in the strategy.
This feature is useful for excluding days with historically lower volatility or unfavorable trading conditions (e.g., Mondays or Fridays).
Benefits:
Focus on Optimal Trading Periods:
By customizing session times and days, traders can focus on periods when the market is more likely to present profitable opportunities.
Avoid Unfavorable Conditions:
Excluding specific days or times can help avoid trading during periods of low liquidity or high unpredictability, such as major news events or holidays.
Increased Flexibility: The filter provides increased flexibility, allowing traders to adapt the strategy to their specific needs and preferences.
Example - Day filter | Session Filter
θ: Session time | Exchange time-zone
-----
What tables are available in this script?
Table Type:
- Summary: Provides a general overview, displaying key performance parameters such as Net Profit, Profit Factor, Max Drawdown, Average Trade, Closed Trades, Compound Annual Growth Rate (CAGR), MAR and more.
CAGR: It calculates the 'Compound Annual Growth Rate' first and last taken trades on your chart. The CAGR is a notional, annualized growth rate that assumes all profits are reinvested. It only takes into account the prices of the two end points — not drawdowns, so it does not calculate risk. It can be used as a yardstick to compare the performance of two strategies. Since it annualizes values, it requires a minimum 4H timeframe to display the CAGR value. annualizing returns over smaller periods of times doesn't produce very meaningful figures.
MAR: Measure of return adjusted for risk: CAGR divided by Max Drawdown. Indicates how comfortable the system might be to trade. Higher than 0.5 is ideal, 1.0 and above is very good, and anything above 3.0 should be considered suspicious and you need to make sure the total number of trades are high enough by running a Deep Backtest in strategy tester. (available for TradingView Premium users.)
Avg Trade: The sum of money gained or lost by the average trade generated by a strategy. Calculated by dividing the Net Profit by the overall number of closed trades. An important value since it must be large enough to cover the commission and slippage costs of trading the strategy and still bring a profit.
MaxDD: Displays the largest drawdown of losses, i.e., the maximum possible loss that the strategy could have incurred among all of the trades it has made. This value is calculated separately for every bar that the strategy spends with an open position.
Profit Factor: The amount of money a trading strategy made for every unit of money it lost (in the selected currency). This value is calculated by dividing gross profits by gross losses.
Avg RR: This is calculated by dividing the average winning trade by the average losing trade. This field is not a very meaningful value by itself because it does not take into account the ratio of the number of winning vs losing trades, and strategies can have different approaches to profitability. A strategy may trade at every possibility in order to capture many small profits, yet have an average losing trade greater than the average winning trade. The higher this value is, the better, but it should be considered together with the percentage of winning trades and the net profit.
Winrate: The percentage of winning trades generated by a strategy. Calculated by dividing the number of winning trades by the total number of closed trades generated by a strategy. Percent profitable is not a very reliable measure by itself. A strategy could have many small winning trades, making the percent profitable high with a small average winning trade, or a few big winning trades accounting for a low percent profitable and a big average winning trade. Most trend-following successful strategies have a percent profitability of 15-40% but are profitable due to risk management control.
BE Trades: Number of break-even trades, excluding commission/slippage.
Losing Trades: The total number of losing trades generated by the strategy.
Winning Trades: The total number of winning trades generated by the strategy.
Total Trades: Total number of taken traders visible your charts.
Net Profit: The overall profit or loss (in the selected currency) achieved by the trading strategy in the test period. The value is the sum of all values from the Profit column (on the List of Trades tab), taking into account the sign.
- Monthly: Displays performance data on a month-by-month basis, allowing users to analyze performance trends over each month.
- Weekly: Displays performance data on a week-by-week basis, helping users to understand weekly performance variations.
- OFF: Hides the performance table.
Labels:
- OFF: Hides labels in the performance table.
- PnL: Shows the profit and loss of each trade individually, providing detailed insights into the performance of each trade.
- Range: Shows the range length and Average Day Range (ADR), offering additional context about market conditions during each trade.
Profit Color:
- Allows users to set the color for representing profit in the performance table, helping to quickly distinguish profitable periods.
Loss Color:
- Allows users to set the color for representing loss in the performance table, helping to quickly identify loss-making periods.
These customizable tables provide traders with flexible and detailed performance analysis, aiding in better strategy evaluation and optimization.
-----
User-input styles and customizations:
To facilitate studying historical data, all conditions and rules can be applied to your charts. By plotting background colors on your charts, you'll be able to identify what worked and what didn't in certain market conditions.
Please note that all background colors in the style are disabled by default to enhance visualization.
-----
How to Use This Algobuilder to Create a Profitable Edge and System:
Choose Your Strategy mode:
- Decide whether you are creating an investing strategy or a trading strategy.
Select a Market:
- Choose a one-sided market such as stocks, indices, or cryptocurrencies.
Historical Data:
- Ensure the historical data covers at least 10 years of price action for robust backtesting.
Timeframe Selection:
- Choose the timeframe you are comfortable trading with. It is strongly recommended to use a timeframe above 15 minutes to minimize the impact of commissions on your profits.
Set Commission and Slippage:
- Properly set the commission and slippage in the strategy properties according to your broker or prop firm specifications.
Parameter Optimization:
- Use trial and error to test different parameters until you find the performance results you are looking for in the summary table or, preferably, through deep backtesting using the strategy tester.
Trade Count:
- Ensure the number of trades is 100 or more; the higher, the better for statistical significance.
Positive Average Trade:
- Make sure the average trade value is above zero.
(An important value since it must be large enough to cover the commission and slippage costs of trading the strategy and still bring a profit.)
Performance Metrics:
- Look for a high profit factor, MAR (Mar Ratio), CAGR (Compound Annual Growth Rate), and net profit with minimum drawdown. Ideally, aim for a drawdown under 20-30%, depending on your risk tolerance.
Refinement and Optimization:
- Try out different markets and timeframes.
- Continue working on refining your edge using the available filters and components to further optimize your strategy.
Automation:
- Once you’re confident in your strategy, you can use the automation section to connect the algorithm to your broker or prop firm.
- Trade a fully automated and backtested trading strategy, allowing for hands-free execution and management.
-----
What makes this strategy original?
1. Incorporating direct integration of probabilities into the strategy.
2. Leveraging market sentiment to construct a profitable approach.
3. Utilizing built-in market structure-based trailing stop-loss mechanisms across various timeframes.
4. Offering both investing and trading strategies, facilitating optimization from different perspectives.
5. Automation for efficient execution.
6. Providing a summary table for instant access to key parameters of the strategy.
-----
How to use automation?
For Traders:
1. Ensure the strategy parameters are properly set based on your optimized parameters.
2. Enter your PineConnector License ID in the designated field.
3. Specify the desired risk level.
4. Provide the Metatrader symbol.
5. Check for chart updates to ensure the automation table appears on the top right corner, displaying your License ID, risk, and symbol.
6. Set up an alert with the strategy selected as Condition and the Message as {{strategy.order.alert_message}}.
7. Activate the Webhook URL in the Notifications section, setting it as the official PineConnector webhook address.
8. Double-check all settings on PineConnector to ensure the connection is successful.
9. Create the alert for entry/exit automation.
For Investors:
1. Ensure the strategy parameters are properly set based on your optimized parameters.
2. Choose "Investing" in the user-input settings.
3. Create an alert with a specified name.
4. Customize the notifications tab to receive alerts via email.
5. Buying/selling alerts will be triggered instantly upon entry or exit order execution.
----
Strategy Properties
This script backtest is done on 4H COINBASE:BTCUSD , using the following backtesting properties:
Balance: $5000
Order Size: 10% of the equity
Risk % per trade: 1%
Commission: 0.04% (Default commission percentage according to TradingView competitions rules)
Slippage: 75 ticks
Pyramiding: 2
-----
Terms and Conditions | Disclaimer
Our charting tools are provided for informational and educational purposes only and should not be construed as financial, investment, or trading advice. They are not intended to forecast market movements or offer specific recommendations. Users should understand that past performance does not guarantee future results and should not base financial decisions solely on historical data.
Built-in components, features, and functionalities of our charting tools are the intellectual property of @Fractalyst Unauthorized use, reproduction, or distribution of these proprietary elements is prohibited.
By continuing to use our charting tools, the user acknowledges and accepts the Terms and Conditions outlined in this legal disclaimer and agrees to respect our intellectual property rights and comply with all applicable laws and regulations.

Rocket Grid Algorithm - The Quant ScienceThe Rocket Grid Algorithm is a trading strategy that enables traders to engage in both long and short selling strategies. The script allows traders to backtest their strategies with a date range of their choice, in addition to selecting the desired strategy - either SMA Based Crossunder or SMA Based Crossover.
The script is a combination of trend following and short-term mean reversing strategies. Trend following involves identifying the current market trend and riding it for as long as possible until it changes direction. This type of strategy can be used over a medium- to long-term time horizon, typically several months to a few years.
Short-term mean reversing, on the other hand, involves taking advantage of short-term price movements that deviate from the average price. This type of strategy is usually applied over a much shorter time horizon, such as a few days to a few weeks. By rapidly entering and exiting positions, the strategy seeks to capture small, quick gains in volatile market conditions.
Overall, the script blends the best of both worlds by combining the long-term stability of trend following with the quick gains of short-term mean reversing, allowing traders to potentially benefit from both short-term and long-term market trends.
Traders can configure the start and end dates, months, and years, and choose the length of the data they want to work with. Additionally, they can set the percentage grid and the upper and lower destroyers to manage their trades effectively. The script also calculates the Simple Moving Average of the chosen data length and plots it on the chart.
The trigger for entering a trade is defined as a crossunder or crossover of the close price with the Simple Moving Average. Once the trigger is activated, the script calculates the total percentage of the side and creates a grid range. The grid range is then divided into ten equal parts, with each part representing a unique grid level. The script keeps track of each grid level, and once the close price reaches the grid level, it opens a trade in the specified direction.
The equity management strategy in the script involves a dynamic allocation of equity to each trade. The first order placed uses 10% of the available equity, while each subsequent order uses 1% less of the available equity. This results in the allocation of 9% for the second order, 8% for the third order, and so on, until a maximum of 10 open trades. This approach allows for risk management and can help to limit potential losses.
Overall, the Rocket Grid Algorithm is a flexible and powerful trading strategy that can be customized to meet the specific needs of individual traders. Its user-friendly interface and robust backtesting capabilities make it an excellent tool for traders looking to enhance their trading experience.

CONSOLIDATION BAND BREAKOUT [5MIN TF]CONSOLIDTION BREAKOUT STRATEGY for 5 minute Time-Frame , that has the time condition adjustable for Indian Markets.
// ══════════════════════════════════════════════════════════════════════════ //
Unlike the Free Scripts - Risk Management , Position Sizing , Partial Exit etc. are also included .
Message to know more about the strategy.
// ══════════════════════════════════════════════════════════════════════════ //
The Timing can be changed to fit other markets, scroll down to "TIME CONDITION" to know more.
The commission is also included in the strategy .
The basic idea is when ,
1) Price crosses above upper Level ,indicated by Red Line, is a Long condition .
2) Price crosses below lower Level ,indicated by Green Line , is a Short condition .
3) Candle close crosses above ema1 , is a part of the Long condition .
4) Candle close crosses below ema1 , is a part of the Short condition .
5) Allowed hours specifies the trade entry timing.
6) ATR STOP is the stop-loss value on chart , can be adjusted in INPUTS.
7) Target 1 is the 1st target value on chart , can be adjusted in INPUTS.
8) RISK is Maximum Risk per trade for the intraday trade can be changed .
9) Total Capital used can be adjusted under INPUTS.
10) ATR TRAIL is used for trailing after entry, as mentioned in the inputs below.
11) Check trades under the list of trades .
12) Trade only in liquid stocks .
13) Risk only 1-5% of total capital.
14) Inputs can be changed for better back-test results, but also manually check the trades before setting alerts
15) SQUARE OFF TIME - As you change the time frame , also change the square-off time to that candle's closing time.
Eg: For 3min Time-frame , Hour = 2Hrs | Minute = 57min
16) Strategy stops for the day if you have a loss .
*The input values and the results are mentioned under "BACKTEST RESULTS" below*
// ══════════════════════════════ //
// ————————> RISK MANAGEMENT <——————— //
// ══════════════════════════════ //
Risk management is done based on max loss per trade and can be adjusted in the INPUTS.
// ═══════════════════════════ //
// ————————> POSITION SIZE <——————— //
// ═══════════════════════════ //
Quantity of each trade is different based on the loss
// ═════════════════════════ //
// ————————> PROPERTIES <——————— //
// ═════════════════════════ //
COMMISSION , SLIPPAGE ,RECALCULATE is already mentioned .
COMMISSION can be charges , based on the broker charges.
// ═══════════════════════════════//
// ————————> TIME CONDITION <————————— //
// ═══════════════════════════════//
The time can be changed in the INPUT.
The Indian Markets open at 9:15am and closes at 3:30pm.
The 'Allowed hours' under Inputs specifies the time at which Entries should happen .
"Close All" function closes all the trades before 3pm , at the open of the next candle.
To change the time to close all trades , check INPUT.
All open trades get closed at 3pm , because some brokers don't allow you to place fresh intraday orders after 3pm .
// ═══════════════════════════════════════════════ //
// ————————> BACKTEST RESULTS ( 123 CLOSED TRADES )<————————— //
// ═══════════════════════════════════════════════ //
INPUTS can be changed for better Back-Test results.
The strategy applied to NSE:TCS (5 min Time-Frame and with a capital of 1,00,000 ) gives us 77% profitability , as shown below
It was tested for a period a 1 year with a Profit Factor of 2.143 ,net Profit of 10,886 Rs .
The Initial Capital and Risk can be increased for better results.
The graph has a Linear Curve with Consistent Profits.
The INPUTS are as follows,
1) LENGTH ——————————————> 79
2) MUT_STDEV ————————————> 2.3
3) ALLOWED HRS ———————————> 9:25 TO 14:30
4) ATR STOP ——————————————> 2.2
5) RISK ——————————————————> 400
6) ATR TRAIL ———————————————> 2.6
7) TARGET 1 ————————————————> 2.1
8) MAX POSITION VALUE ——————————> 1,00,000
8) MAX DRAWDOWN —————————————> 2,000
8) SQUARE-OFF ————————————————> 14:55
NSE:TCS
Apply it to your charts Now !!
Send us a message to know more about this strategy
Thank You ☺ NSE:TCS

Stock trending strategy This is a long only strategy designed maily for stock markets and futures. In general it works best with 1h, however it can be optimized with other timeframes as well.
Components:
VWAP
MACD histogram
EMA 9
Rules for entry
Long :
For VWAP: close is above the vwap daily
EMA: close is above the moving average
MACD histogram is above 0
Short:
For VWAP: close is belowthe vwap daily
EMA: close is below the moving average
MACD histogram is below 0
Rules for exit
This strategy does not have any risk management inside. Instead it exits whenver it receives an opposite signal form the original one used for entry.
If you have any questions let me know !

Stock StrategyStock holding trading strategy based on base breakout. It should be combined with the analysis of the fundamental factors of the stock to choose the stock with the best signal.
Example using 10 contract size with ADP, and commission per order is 0.1% with actual capital of 10000$, you can adjust other contract size for other stocks to be consistent with reality.

Crypto Fox ANN Strategy No RepaintHello traders
This is (( sirolf's ANN Strategy )) i updated it to (( No Repaint Version )) and it still have very good results
The new in strategy : -
1 - The strategy is no repaint now in any time frame
2- Now Strategy have two time frames which make you control strategy in entry and exit positions and you can change it as you want .
3 - Added Back Test range to check Back test results
4 - Strategy is working in 10 % of equity and you can change it as you want .
5- I recommended so much working in 5 min time frame and 15 min time frame to get the best results
but in the same time the strategy is working in all time frames this just my advice for traders
6- I recommend so much using take profit and stop loss to avoid huge movements in markets

CRYPTOOOFOX (Scalping System)---DESCRIPTION---
How Strategy Work :
--This strategy is for scalping and also using confirmation when higher > highest time frame .
--The main indicator in this strategy is built on movement high and low so this indicator is belong to
the chart price and movement and you can make profit in any chart as you want
--Strategy is working on higher time frame so i use two high time frames .
the higher is ( 8 H ) and the highest is ( Daily ) Time frame .
-- When the higher time frame cross over the Daily time frame( the Highest ) this mean
the TREND and the PRICE also going UP this strategy is going to start working between the high and low buy in low .
-- When the higher time frame cross under Daily time frame( the Highest ) this mean the TREND and
the PRICE also going down and it will sell in high ( close position ) .
--Strategy is working only in Long position i am not recommend to use it in short positions .
--THIS IS NO REPAINT STRATEGY .
--This strategy is working in 10 % of equity and you can change it as you want .
--I recommend so mush to use 5 min time frame for low draw down
--I recommend so mush to use take profit and stop loss although the low draw down but some time
the market have a huge movements .
--This strategy have setting of movement for every chart and every price and movement so i will
comment the settings for every chart in forex and crypto and also stock markets

Long only strategy VWAP with BB and Golden Cross EMA50/200
This is strategy, mainly designed for stock markets
It makes uses of the EMA 50/ 200 ( Golden cross) and VWAP and Bollinger bands.
It only takes long positions. It can be adapted to all time frames, but preferably to be used with longer timeframes 1h +
The rules for entry are the next ones :
1. EMA50 > EMA 200
2. if current close > vwap session value
3. check if price dipped BB lower band for any of last 10 candles
EXIT RULE
1. price closes above BB upper
STOP LOSS EXIT
1. As configured --- default is set to 1%

PPSIGNAL fibo trade patrones armonicos with Back test v2.1here we have the Ppsignal Fibo Trade with harmonic patterns.
When the system finds a harmonic pattern either from the current time frame or a higher one, it depends on the setting you set, you will buy or sell depending on the harmonic pattern it detects.
Please note prior to use read about harmonic pattern formation

HFT The Ultimate Trend BacktesterThis is a trend following based strategy developed by HFT Research.
It works on Stocks, Forex and Cryptocurrency markets
This indicator comes fine tuned out of the box. It works on best on 15min, 1 hour and 4 hour time frames. It provides 3 separate entries for each of the time frames, providing you 12 different entry options.
Each time frame has the following options to choose from
You can use 1 hour settings on 15min chart however, it may not work the best.
Moderate entry will give you the modest amount of trades with modest amount of risk
Aggressive entry will give you wild entries and lots of action, if you are willing to babysit the trades, it might be an option for you
Conservative entry are best for those who want to automate the strategy or for those that don't have the time to trade the alerts actively
The backtester assumes the following;
- 1000$ capital
- 0.06% commission based on binance
- 1% risk meaning 100% equity on cross leverage
- Backtest results are starting from 2020
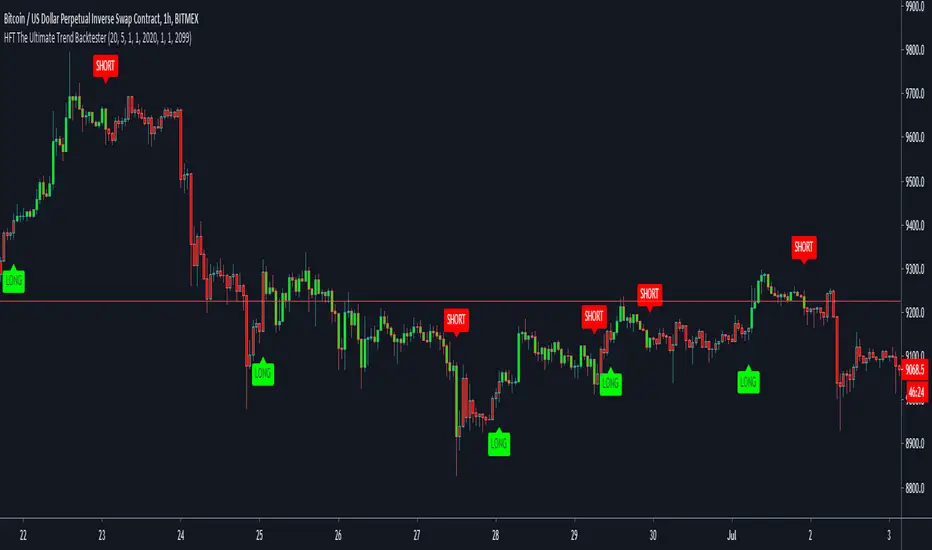
PpSignal Algorithmic trading system this strategy uses
1) trend
2) volatility
3) volume
Also, you can find in additional tools, rsi wilders on the chart and its standard deviation.
CFB composite fractal behavior and smoothed atr.
Candle converter MTF.
The strategy uses these four indicators to generate inputs and outputs.
Basically buy when cfb, rsi and atr go in the same direction upwards and the movement is accompanied by a rising volume (cfb green color and rsi Aqua ATR).
Idem in reverse for sell, when cfb, atra and rsi are giving a sell signal (Red color) and the volume is descending.
It is important that you also use other trading systems that you consider convenient. Support and resistance and also fibonacci levels all help to better trading.
Not all assets have or use the same configuration, for this, you must find the appropriate parameters with the variables, long length, short length, source, and period.
for example for btcusd the optimal parameters for me are:
long length = 2
short length = 2
signal length = 2
source = ohlc4
period = 9
It also has a take profit and stops loss tool in percentage.
remember to use parameters according to your tolerance as a trader or investor.
enjoy it
PD: you can write to me privately I have many optimizations and settings already done
este estrategia usa
1) trend
2)volatilidad
3)volumen
Tambien usted podrá encontrar en herramientas adicionales, rsi wilder on the chart y su desviación estándar.
CFB composite fractal behavior y atr suavizado.
Candle converter MTF.
La estrategia usa estos cuatro indicadores para generar entradas y salidas.
Básicamente buy cuándo cfb, rsi y atr van en la misma dirección hacia arriba y el movimiento está acompañado por un volumen ascendente (color verde cfb y rsi Aqua ATR).
Idem a la inversa para el sell, cuando cfb, atra y rsi están dando señal de venta (color Rojo) y el volumen es descendente.
Es importante que también use otros sistemas de trading que usted crea conveniente. Soporte y resistencia y también niveles fibonacci todo ayuda a un mejor trading.
No todos los activos tienen o usan la misma configuración para esto usted deberá encontrar los parámetros adecuado con las variables, long length, short length, source y period.
por ejemplo para btcusd los parámetros óptimos para mi son:
long length = 2
short length = 2
signal length = 2
source = ohlc4
period = 9
También posee una herramienta de take profit y stop lose en porcentaje.
recuerde usar parámetros acorde a su tolerancia como trader o inversor.
disfrutelo

MACD Bull Crossover and RSI Oversold 5 Candles Ago-Long StrategyHello everyone, I've been having a great time perfecting this strategy for a few weeks now. I finally feel like it's time to release it to the public and share what I have been working on.
This strategy only enters a long trade when the MACD crosses over the signal line and the RSI was oversold looking back 5 candles ago. The logic behind this is to wait for RSI to enter the oversold territory, and then when the market starts to recovery the MACD will crossover telling us the sell off is over.
This strategy will close once these 2 conditions are met.
1. MACD Histogram is above 0 and MACD crosses under the signal line.
2. RSI was overbought 5 previous candles ago.
In the strategies settings, you'll be able to enable visual stop-loss and profit levels and change those levels to what you like, enable up to 5 EMA'S,
ADDONS That Affect Strategy:
* Enable visual stop-loss and profit levels as soon as a buy signal is triggered.
* Modify stop-loss and profit levels.
* Modify RSI oversold and RSI overbought levels.
* Modify MACD Fast and Slow moving average.
ADDONS That Do Not Affect Strategy:
* Enable up to 5 EMA's. (This will not affect strategy, and is the only purpose is for people who like following EMA's.)
Thank you for taking the time to try my strategy. I hope you have the best success. I will be making a short strategy, and alerts for this strategy soon. Follow me for updates!

PpSignal BBstop Strategy strategy based on rsi of ma, in the example with btc usd we have as tp 1000 trailing stop 700, but you should adopt the money management to your criteria.
it has an alarm system when you see bbbuy or bbsell is a pre-notice only buy when the signal is Buy in blue or sell in maroon, it also has a buy exit and sell exit warning.
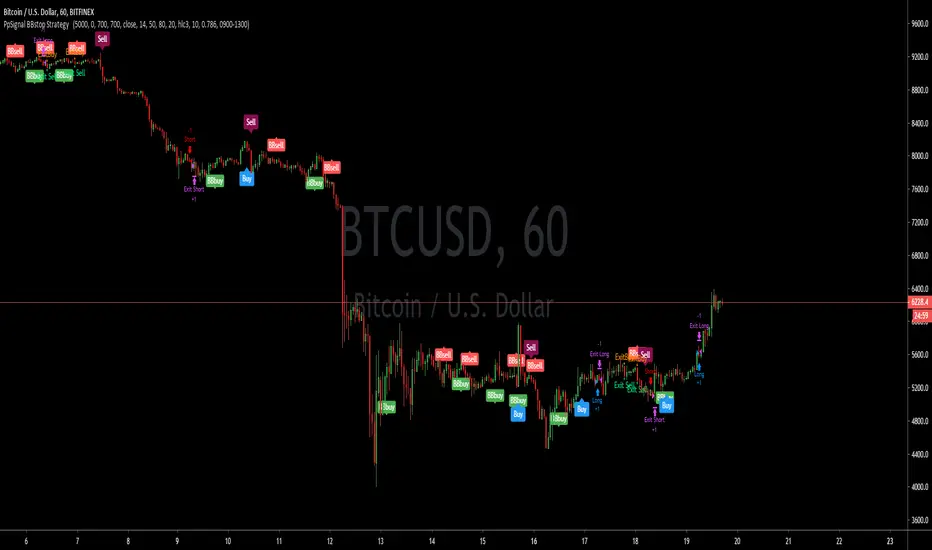
SAMURAI SWORDSamurai Sword is an add on tool for Ninja Scalper and the next evolution of the Trend Trade Indicator.
It auto plots the fib retracement to speed up target acquisition support and resistance areas based on the formula to increase the success rate of trade entry and exits.
None of this is to be taken as investment advice but rather Edutainment and infotainment
#TradeSocially

NINJA SCALPERNinja Scalper is the next evolution of the Trade Trend Indicator.
I have been trading for over 23 years now and these indicators are based on my trading style risk verse reward. The change in this is to make it more responsive and to integrate with Sword.
The background of this indicator is:
The original Trade Trend Indicator (indicator) has been the brain child of 23 years of trading experience rolled into a simple to understand all market setup alert system based solely on 5 high probability trade set ups with a 6th high risk. The hope is to provide something that is can assist traders in building confidence in their trades with a little assistance from the indicator.
This like any and all indicators is not a be all and end to trading, yes while back tested the indicator has produced fantastic profitable results; past performance is not a guarantee of future but which with human intervention can increase the return result exponentially.
You need to be able to chart simple candle sticks and you need to have an understanding of support and resistance areas to make sense of what you are doing in trading otherwise even this indicator won't help you.
While this may alert buy or sell / long or short entrance these are to be taken as educational points of reference and if you wish to trade you are understanding that you enter and exit at your own risk. Not many indicators will alert you to the possibility of a rogue wave spike / dump or both, this will but everything is perspective of the time frame you are on.
The indicator is designed for the 4hour time frame with trade entry on the 15min and managed on the 30min time frame. Alot can happen within these time frame but as we know not every trader can sit in front of a screen for hours at a time and this let's one trade for swings. Once you have your entry you place your exits and you set your stops. If you wait for the alert to exit you are in a draw down this should never reach that point pay yourself for being right.
The some set ups are simple:
1. Trend change from bearish to bullish buys are dip interim support entries.
2. Trend change from bullish to bearish sells are top interim resistance exits.
3. Blue buy is an entry position for a trade.
4. Blue long is an add position for a trade.
5. Red short is just that a short trade idea. (this is advanced and requires a manual cover target),
6. Green buy is a break out over the next candle to print above (highest risk)
All trades are based on a 5% to 10% of capital entry with no more than 40% ever in 1 trade goal is many consistent trade wins while limiting the losses and size.
Certain set ups such as longs over the Moving Averages but below the cloud can lead to strong rally returns as well as short in a bearish trend just above the Moving Averages can give prolonged selling pressure.
Pay attention to the golden dump line as it rises the closer to the candle it gets the higher the risk of the trade lacking continuation.
None of this is to be taken as investment advice but rather Edutainment and infotainment
#TradeSocially
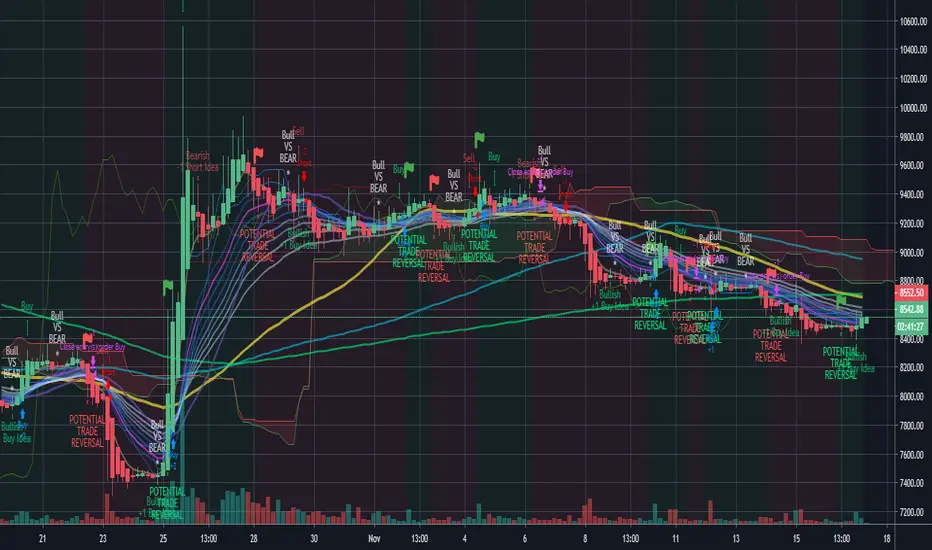
PerPro V7 V3 STOCK AND INDICESin this version Perpro V7 is only for trade indices and stock, the algorithm only send buy signal, the bes performance is in 1h time frame, 1 day and 1 w.
you need to find the best money management for stock or indices.

PerPro V3 We have agreed PerPro Strategy and PerPro Indicator.
Remember to use other indicators, oscillators, fibonacci levels, support, resistances, etc. to confirm entries. THIS IS NOT THE HOLY GRAIL .
We adde EMA 64 /200 and Ppsignal Nuke too.
Recommendations.
Forex:
- Graphics 5 minutes TF 60 to 240
- Graphics 60 Minutes D
- Graphics 240 D or W.
Stock
-Graphics 5 minutes Tf 120 to D
-Graphics 1 H TF D or W
-Graphics 1D W Or M
You can look for the best combination. Remember that stocks or currencies do not all move the same.
