Chinkou_ProWelcome traders,
I have made this script wishing a higher gain,
Originally, this strategy is taken from Ichimoku Kinko Hyo
Simply:
ChinkouPro crossing with price is giving a clear opportunity.
Review it, master it, work it.
first version
change log
Delete function of lazy trader { smooth candle }
Delete function of alert , { make alert from chart it's better }
Enjoy with it , and contact me for any reason :)
Strategy!

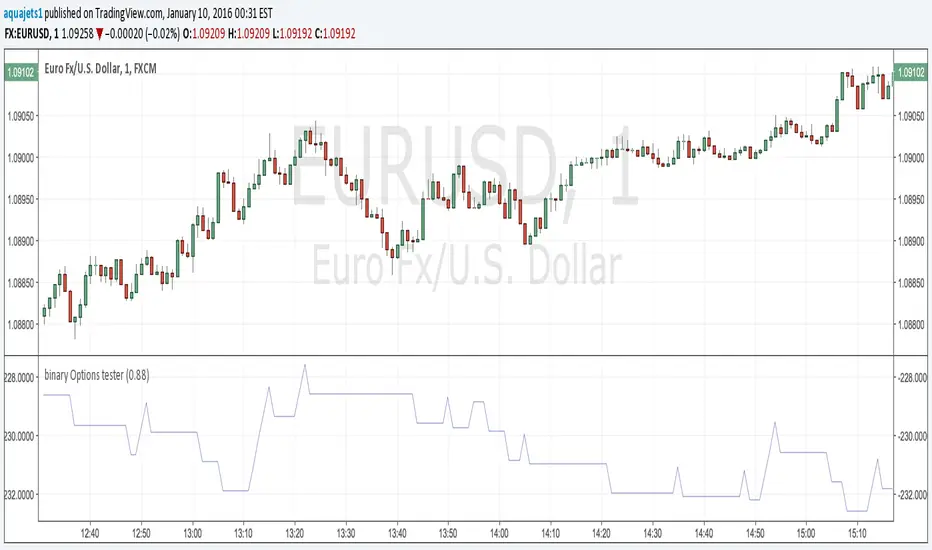
Binary Options Strategy Testing ScriptThis is a script for testing binary options trading strategies. To test a strategy, modify the 'go_down' or 'go_up' booleans. These SHOULD NOT access any current values (for example, 'ohlc4' or 'close '), or the backtesting will not be an accurate representation of the forward values.
Modify the fraction_return input to be the return rate of the option on success. This is assumed to be a true 100 or 0 option- i.e. if the choice is not correct, there is a 100% loss.
The strategy in place is merely an example, and as you can see, has a very negative rate of return when implemented as a strategy.
Please comment in your code if you use this in any future posts. Thanks!
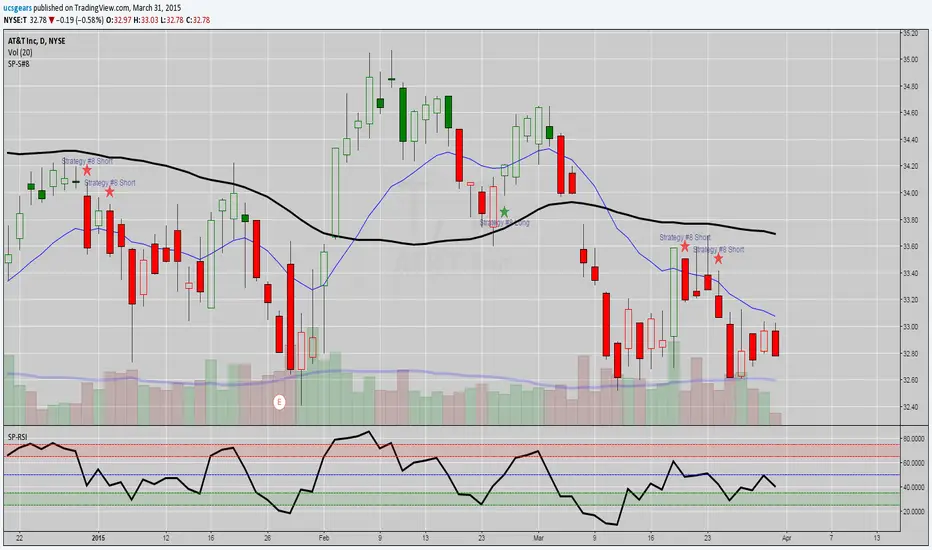
SP_Relative Strength IndexQuick Update to the Steve Primo RSI.
Nothing fancy, but one indicator to represent all his RSI based setups.
Primarily used on Strategy #1 and #8.

Romi Trend and Momentum Oscillator
Great oscillator which determines trend and momentum. So accurate it could be used as a stand alone indicator.

Binary option trading by two previous barsThis simple script uses the idea of inertia of the market. if 2 previous candles have the same color, current meant to have that too. Following this signal is equal to buying a binary option on the start of the bar (week here). Signals are shown as arrows on the series. The color of the bar shows the outcome of the current option: yellow is success, black is failure. The same outcomes are at the bottom of the chart. The blue line is the total revenue of all options so far. Can be used as template for strategy simulation.

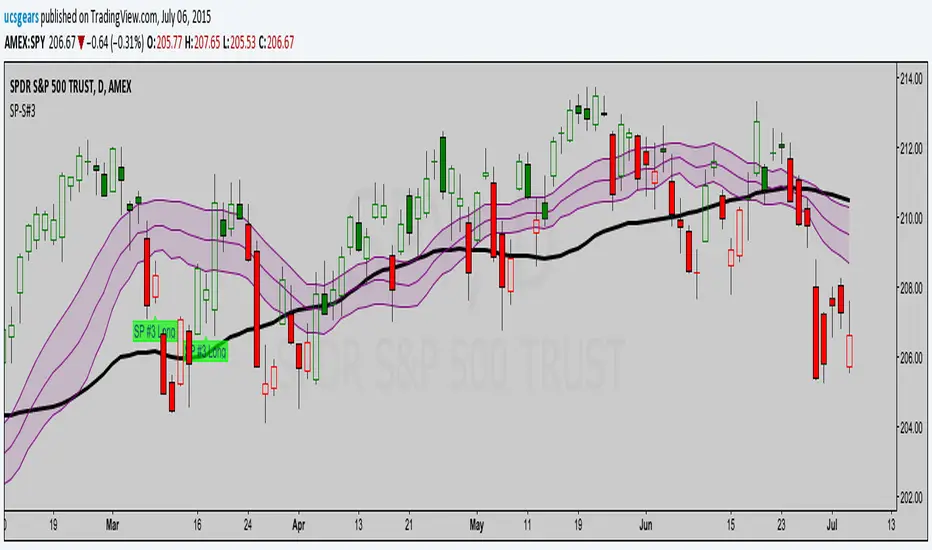
UCS_S_Steve Primo - Strategy 3Here is the code for Steve Primo Strategy #1 - Setup Long and Short
- Please refer to his videos for triggers and management.
Share your views.
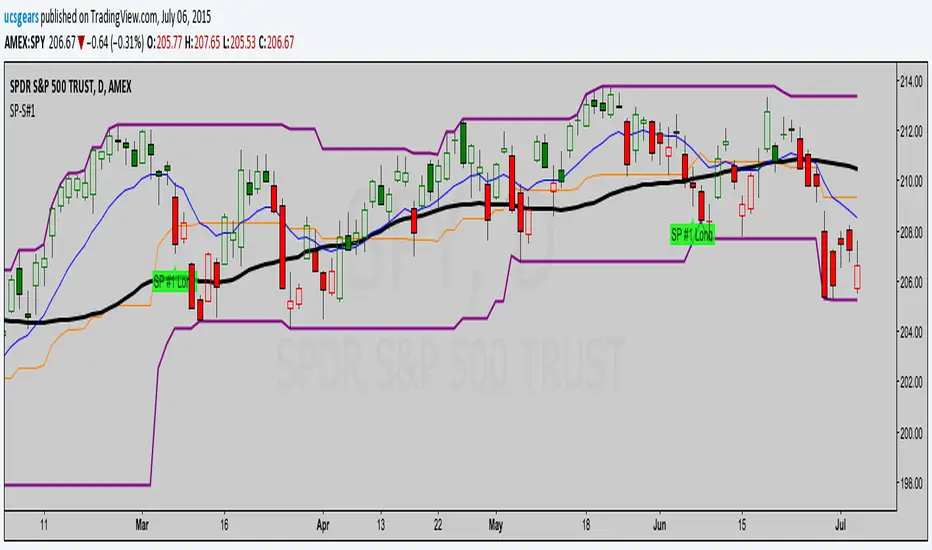
UCS_S_Steve Primo - Strategy 1Here is the code for Steve Primo Strategy #1 Long and Short Setups.
- Post your views and share the knowledge.
Watch his free videos on youtube for trigger and trade management
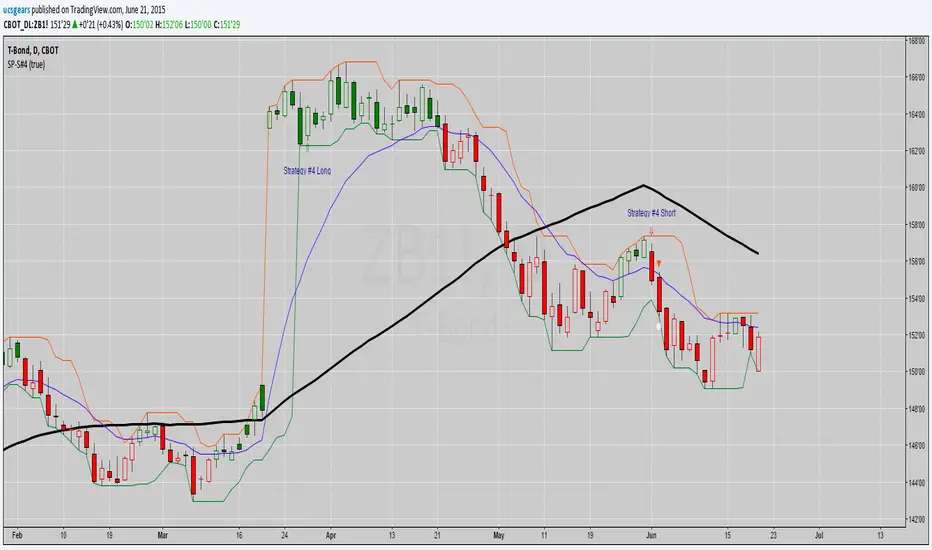
UCS_S_Steve Primo - Strategy 4 - Version 2For those who are interested with this strategy, Here is a better version.
Naked Forex Trading StrategyBased on "How Naked Trading Works" video by Walter Peters: youtu.be I don't know this person and I am in no way affiliated with him. I just found his video interesting enough to make this into a script.
Rules as described by Walter in his video:
1. if current candle makes a higher high than the previous one
2. and is a bearish engulfing candle
3. and has room to the left
4. and is the largest candle (high - low) compared to the last 7-10 previous ones
Then open trade on the next candle once it breaks bearish engulfing candle's low and take profit close above previous support. Stop loss goes a few pips above bearish engulfing candle high
Do the opposite on a bullish engulfing candle signal.
Works best on 1H, 4H and 1D timeframes.
I haven't done any extensive backtesting on this, but it looks like it gives pretty good signals:

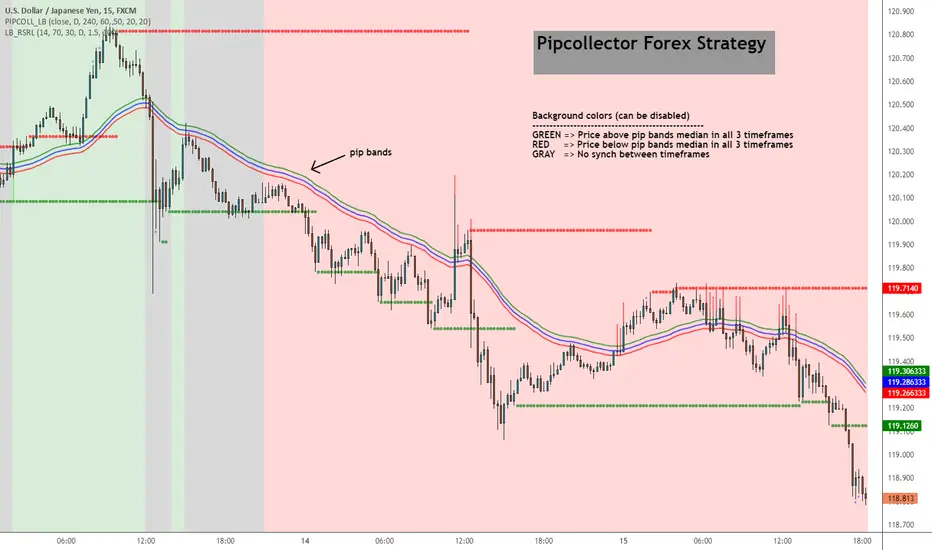
Pip collector [LazyBear]A simple but effective Forex strategy requested by user @pipcollector.
Suggested chart timeframe is 5mins.
Indicator marks potential long/short entries based on the following conditions:
LONG
------
Price above pip median ema on daily, 4 hour and 1 hour timeframe. These 3 timeframes and median EMA lengths are configurable.
Background color is set to GREEN (if option is enabled).
As soon as price touches or crosses the median ema, a GREEN arrow is shown to mark potential long.
SHORT
------
Price below pip median ema on daily, 4 hour and 1 hour timeframe. These 3 timeframes and median EMA lengths are configurable.
Background color is set to RED (if option is enabled).
As soon as price touches or crosses the median ema, a RED arrow is shown to mark potential short.
NO SETUP
-----------
Moving averages do not align on the 3 timeframes.
Background color is set to GRAY (if option is enabled)
I have noticed that this works well on other instruments too (anything trending), also on higher time frames. Feel free to leave any questions/comments on this below.
List of my public indicators: bit.ly
List of my app-store indicators: blog.tradingview.com
UCS_S_Stochastic Pop and Drop StrategyMy Contribution to Jake Bernstein Educational Series, Initiated by Chris Moody.
The Stochastic Pop was developed by Jake Bernstein and modified by David Steckler. Bernstein's original Stochastic Pop is a trading strategy that identifies price pops when the Stochastic Oscillator surges above 80. Steckler modified this strategy by adding conditional filters using the Average Directional Index (ADX) and the weekly Stochastic Oscillator.
Modifications
1. Weekly Stochastic Oscillator for Trading Bias = 5* Daily Stochastic
2. Optional Volume Confirmation, Custom Average Volume Length
Future Plans
1. Adding Triggers for Entry, Stops and Target. - This will be release when we have ability to code the complete Strategy. Although it can be done with the current pinescript options, it would be far more easier if we have strategy ability.
Link for Educational Purpose
stockcharts.com
-
Good Luck Trading
UCSgears

UCS_S_Steve Primo - Strategy #8Hello Fellas,
Hope you are trading fantastic and fine. Here is another setup from Steve Primo (Stocks) Setups. He claims this can be applied on any market, and you can. Primarily focused on Stocks and Futures market.
NOTE : I DID CODE THE BOTTOM INDICATOR, NOT PUBLISHING IT, ITS JUST RSI(5)
What did I change, ofcourse I don't publish what I find, There is a bit of me in the codes.....
1. Setup only shows up at meaningful levels, Stringent Filter
Myself and tradearcher will keep this upto date. As he has volenteered to help with the track record of steve primo strategies.
docs.google.com
This is more like catching a freight train after a mini pullback.
AGAIN, This is not a holy grail, but this fits my personality of trading, Buying pullbacks on stronger stocks. Because it is harder to get a UCS_momo_Oscillator to signal a setup, primarily because of the smoothing, you can use this as an alternative to catch the excitement trade.
Do not sit on it for more than T+4 days, Unless another setup triggered in your way.
Rule - Buy/Sell the candle breakout next day after the setup - in the direction it is setting up
- Close the Position @ 100% candle extension or RSI Oversold.
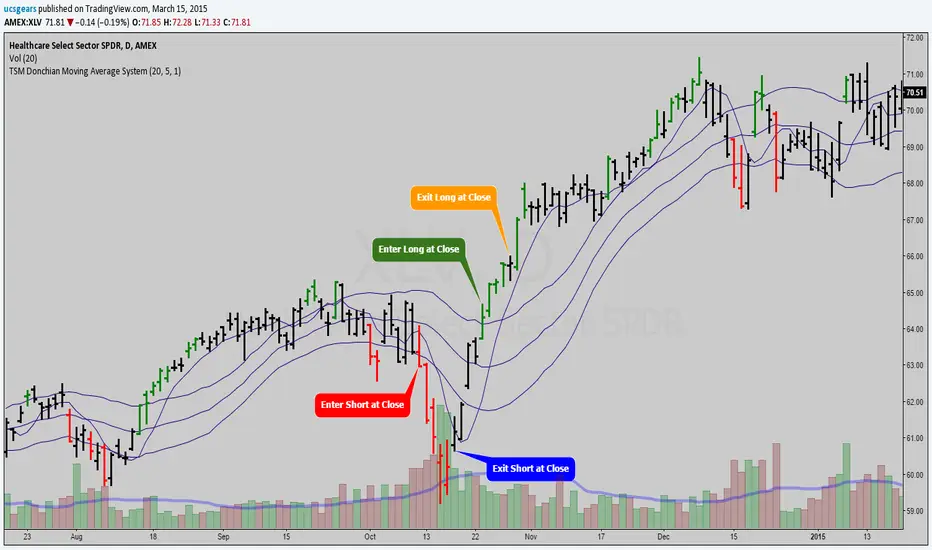
TSM Donchian Moving Average System_by_ucsgearsThis is just the raw code for the system / strategies.
Will Complete this when I get more time.
Green - Setup Long
Red - Setup Short
BL_MTF River Strategy with TP/SL by Beller
Anyone remember the "Frogger" game where a frog must pass a river ?
This strategy is like a game.
Immagine you that the cyan lines are a River, any time the price can cross up or down this river, you must buy or sell only when the bar are dry..
BUY at highest price of the first bar that is completely dry over the river
SELL at the lowest price of the first bar that is completely dry under the river
Stoploss is placed at the river bands, take profit is placed at 1:1 and 1:2 ratio, a risk money management must be applied.
This strategy can be used with multiple time frame, i'm testing it in 15min,180m and daily base applyed to EURJPY.
It's a game but can produce some money... ;-)

UCS_S_Steve Primo - Strategy #5 (FOREX Only)Here we have another Steve Primo Strategy ( #5)
This is a short term, trend continuation strategy, Recommend using this on 30 Mins + time frames.
I have added few things.
1. PET-D filter, to identify the trend along with the SMA 50. ----> Setup in line with PET-D (EMA,15) trend confirmation.
2. Option for Harami Candle identification (may not be Steve Primo Setup), There is no evidence on any of the videos listed below for Harami or other candlesticks pattern.
Future - Planned to add other candle patterns.
Videos from Youtube
1. www.youtube.com -
2. www.youtube.com - Hints disclosed on this video.
3. www.youtube.com - Claims this is his GO TO strategy for FOREX.
4. www.youtube.com - Complete Free Lesson.
Note - I did not buy this Strategy, I do not own in any way shape or form of this strategy as presented in the videos, The Strategy I am posting is my interpretation based on Steve Primo's videos listed above and few more on youtube.
Good Luck folks.

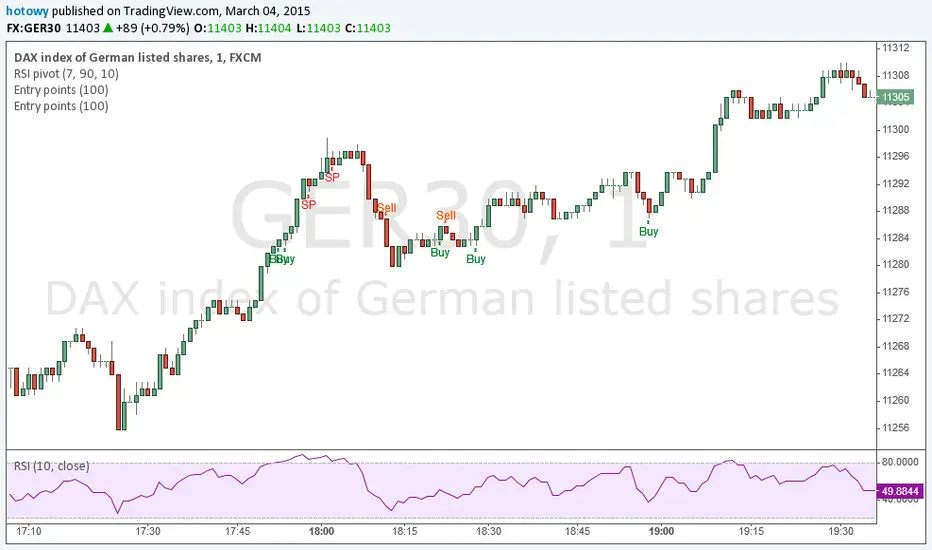
Entry pointsThis great and simple indicator based on EMA generates information about entry points at close of the candle. First signal is the best entry point but you can re-enter at the next. IMPORTANT: this script does not generate exit signals and those shoud be find using money management rules or else. Perfectly catches long runs in trends at all underlayings (forex, stocks, indexes, commodities) at all timeframes. Period=100 works best independently on timeframe but I encourage you to try other. Lower period gives more incorrect signals and shorter runs, higher period gives you late entry and less. Ofcourse it gives false signals from time to time but fortunately it makes a correction very fast. Try it! Good luck and good traiding!
Extracting The Trend Strategy The related article is copyrighted material from Stocks & Commodities Mar 2010
You can use in the xPrice any series: Open, High, Low, Close, HL2, HLC3, OHLC4 and ect...

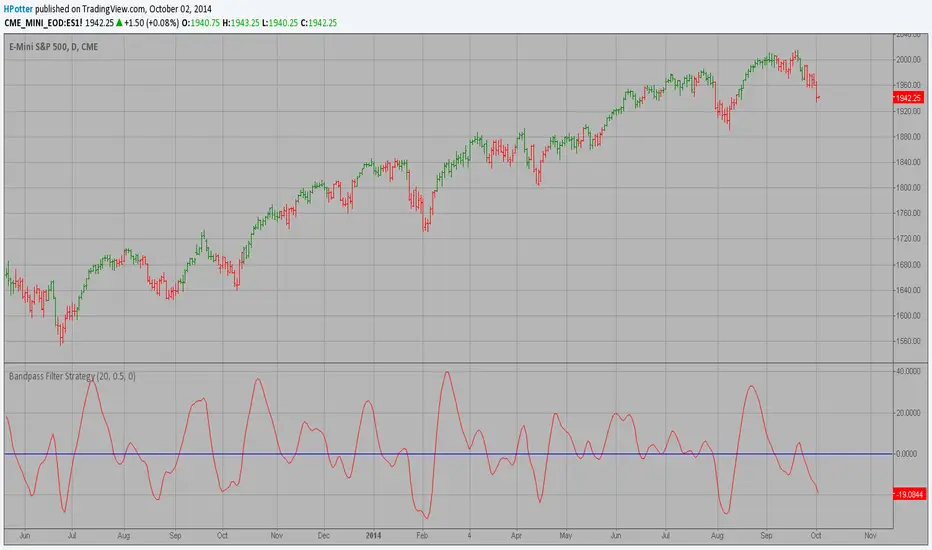
Bandpass Filter Strategy The related article is copyrighted material from
Stocks & Commodities Mar 2010
You can use in the xPrice any series: Open, High, Low, Close, HL2, HLC3, OHLC4 and ect...
CM RSI-2 Strategy - Upper Indicators.RSI-2 Strategy
***At the bottom of the page is a link where you can download the PDF of the Backtesting Results.
This year I am focusing on learning from two of the best mentors in the Industry with outstanding track records for Creating Systems, and learning the what methods actually work as far as back testing.
I came across the RSI-2 system that Larry Connors developed. Larry has become famous for his technical indicators, but his RSI-2 system is what actually put him “On The Map” per se. At first glance I didn’t think it would work well, but I decided to code it and ran backtests on the S&P 100 In Down Trending Markets, Up Trending Markets, and both combined. I was shocked by the results. So I thought I would provide them for you. I also ran a test on the Major forex Pairs (12) for the last 5 years, and All Forex Pairs (80) from 11/28/2007 - 6/09/2014, impressive results also.
The RSI-2 Strategy is designed to use on Daily Bars, however it is a short term trading strategy. The average length of time in a trade is just over 2 days. But the results CRUSH the general market averages.
Detailed Description of Indicators, Rules Below:
Link For PDF of Detailed Trade Results
d.pr
Original Post

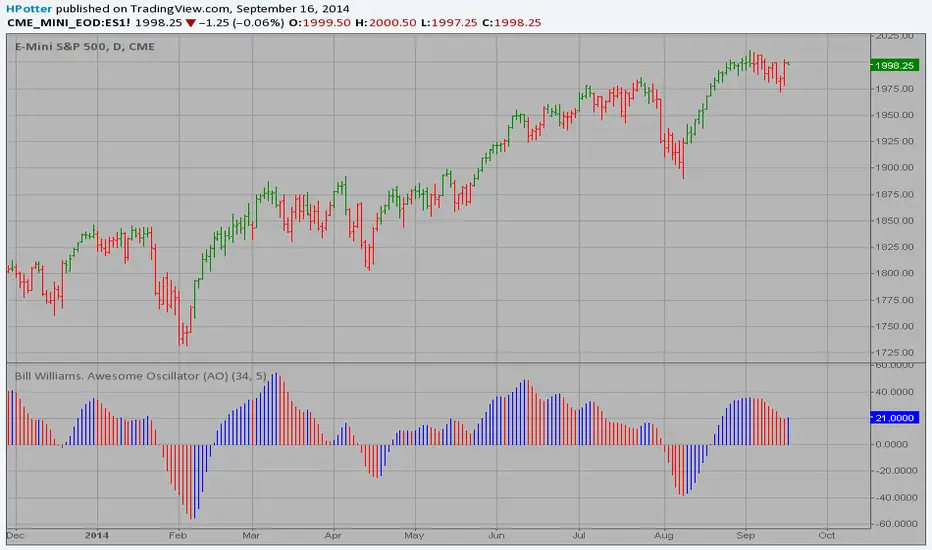
Strategy Bill Williams. Awesome Oscillator (AO) This indicator is based on Bill Williams` recommendations from his book
"New Trading Dimensions". We recommend this book to you as most useful reading.
The wisdom, technical expertise, and skillful teaching style of Williams make
it a truly revolutionary-level source. A must-have new book for stock and
commodity traders.
The 1st 2 chapters are somewhat of ramble where the author describes the
"metaphysics" of trading. Still some good ideas are offered. The book references
chaos theory, and leaves it up to the reader to believe whether "supercomputers"
were used in formulating the various trading methods (the author wants to come across
as an applied mathemetician, but he sure looks like a stock trader). There isn't any
obvious connection with Chaos Theory - despite of the weak link between the title and
content, the trading methodologies do work. Most readers think the author's systems to
be a perfect filter and trigger for a short term trading system. He states a goal of
10%/month, but when these filters & axioms are correctly combined with a good momentum
system, much more is a probable result.
There's better written & more informative books out there for less money, but this author
does have the "Holy Grail" of stock trading. A set of filters, axioms, and methods which are
the "missing link" for any trading system which is based upon conventional indicators.
This indicator plots the oscillator as a histogram where periods fit for buying are marked
as blue, and periods fit for selling as red. If the current value of AC (Awesome Oscillator)
is over the previous, the period is deemed fit for buying and the indicator is marked blue.
If the AC values is not over the previous, the period is deemed fir for selling and the indicator
is marked red.
Bill Williams. Awesome Oscillator (AC) Strategy This indicator plots the oscillator as a histogram where blue denotes
periods suited for buying and red . for selling. If the current value
of AO (Awesome Oscillator) is above previous, the period is considered
suited for buying and the period is marked blue. If the AO value is not
above previous, the period is considered suited for selling and the
indicator marks it as red.

Average True Range Trailing Stops Strategy Average True Range Trailing Stops Strategy, by Sylvain Vervoort
The related article is copyrighted material from Stocks & Commodities Jun 2009
