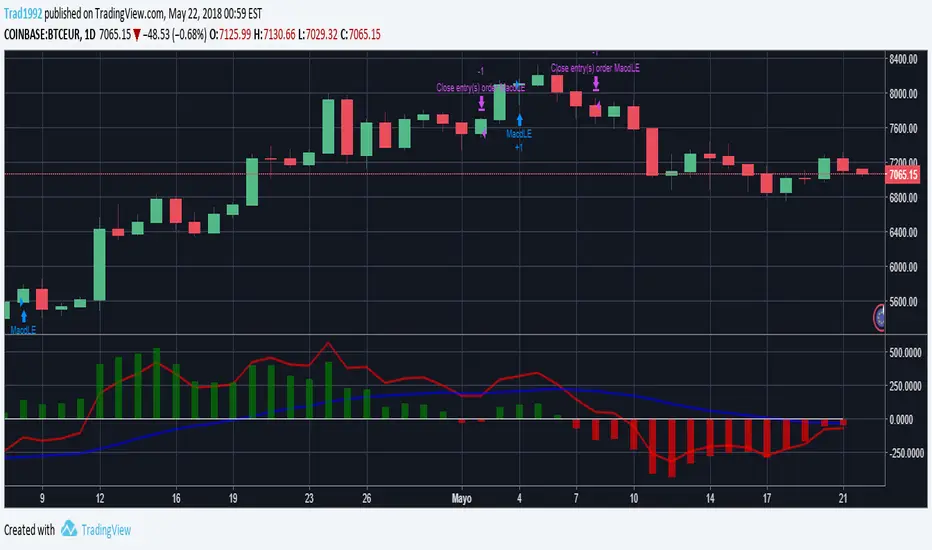
MACD Strategy custom for cryptosIt is a MACD with strategy simulation implemented to "tune" the MACD parameters for cryptos, it only use long and close strategy, not shortСтратегия Pine Script®от Trad199252
Try to go long at a moving averageA simple experimental strategy that tries to go long at a moving average bounce / support level, and looks for upside.Стратегия Pine Script®от TraderHalaiОбновлено 114
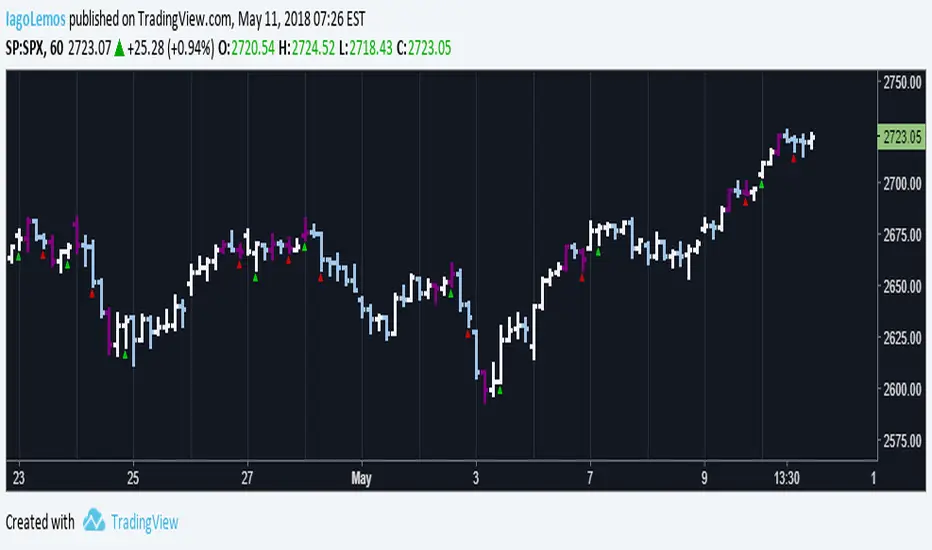
John Carter's Buy/Sell Scalper V2After a couple adjustments, double signals are now being ignore. Here's how this script works: Based entirely on a John Carter scalping setup, a candle will be painted purple if the next two closes are in a opposite direction of the past trend. Green triangles indicates that the reversal is bullish, red triangles indicates that the reversal is bearish. Both are entry/exit points if you want to follow this set up. Personally, I find this setup to work best in trending days, but it does a great job on choppy days if you use it as a confirmation.Индикатор Pine Script®от IagoLemos33572
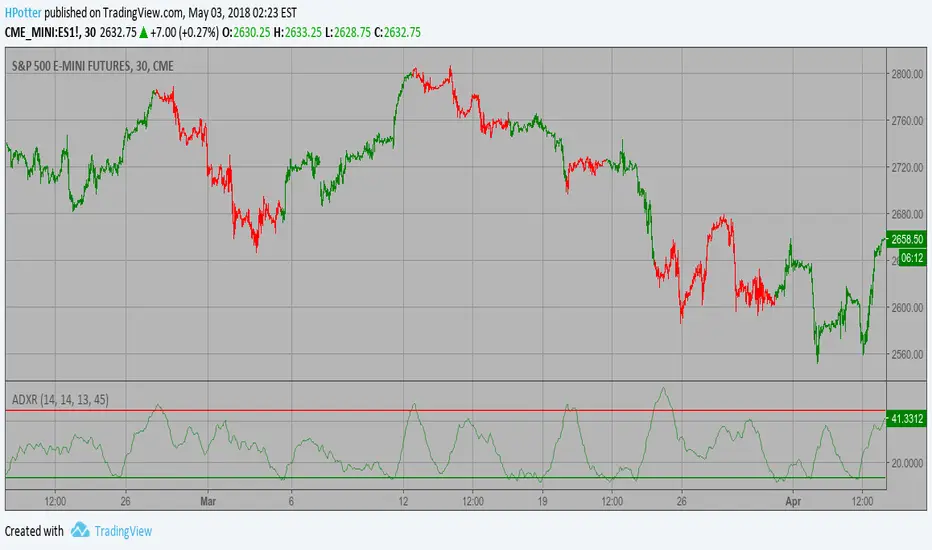
Average Directional Movement Index Rating Backtest The Average Directional Movement Index Rating (ADXR) measures the strength of the Average Directional Movement Index (ADX). It's calculated by taking the average of the current ADX and the ADX from one time period before (time periods can vary, but the most typical period used is 14 days). Like the ADX, the ADXR ranges from values of 0 to 100 and reflects strengthening and weakening trends. However, because it represents an average of ADX, values don't fluctuate as dramatically and some analysts believe the indicator helps better display trends in volatile markets. You can change long to short in the Input Settings WARNING: - For purpose educate only - This script to change bars colors.Стратегия Pine Script®от HPotter170
Average Directional Movement Index Rating Strategy The Average Directional Movement Index Rating (ADXR) measures the strength of the Average Directional Movement Index (ADX). It's calculated by taking the average of the current ADX and the ADX from one time period before (time periods can vary, but the most typical period used is 14 days). Like the ADX, the ADXR ranges from values of 0 to 100 and reflects strengthening and weakening trends. However, because it represents an average of ADX, values don't fluctuate as dramatically and some analysts believe the indicator helps better display trends in volatile markets. WARNING: - This script to change bars colors.Индикатор Pine Script®от HPotter122
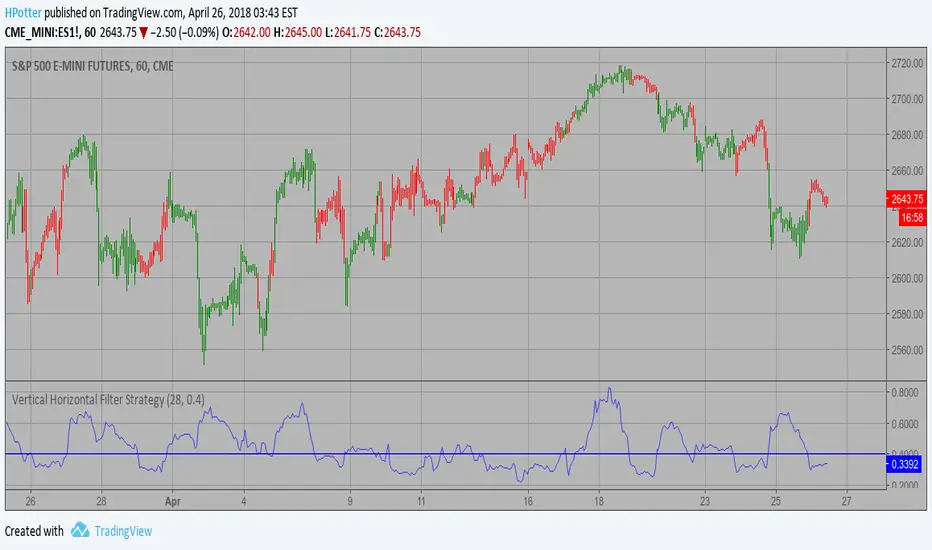
Vertical Horizontal Filter BacktestVertical Horizontal Filter was initiated by Adam White. It was first published in a magazine called “Issues of Futures” in August, 1991. The Vertical Horizontal Filter (VHF) is a very common Indicator used by traders to find out the Phase of a Price Trend. Normally, a price trend can be in a Trending Phase or a Congestion Phase/Choppy Movement Phase. Adam White created this particular Technical Indicator to determine whether prices are trending in a particular direction or are they going through a transitional period. He used it to measure the range of Futures available in the market. You can change long to short in the Input Settings WARNING: - For purpose educate only - This script to change bars colors.Стратегия Pine Script®от HPotter1180
Vertical Horizontal Filter Strategy Vertical Horizontal Filter was initiated by Adam White. It was first published in a magazine called “Issues of Futures” in August, 1991. The Vertical Horizontal Filter (VHF) is a very common Indicator used by traders to find out the Phase of a Price Trend. Normally, a price trend can be in a Trending Phase or a Congestion Phase/Choppy Movement Phase. Adam White created this particular Technical Indicator to determine whether prices are trending in a particular direction or are they going through a transitional period. He used it to measure the range of Futures available in the market. WARNING: - This script to change bars colors.Индикатор Pine Script®от HPotter68
STARC Bands Backtest A type of technical indicator that is created by plotting two bands around a short-term simple moving average (SMA) of an underlying asset's price. The upper band is created by adding a value of the average true range (ATR) - a popular indicator used by technical traders - to the moving average. The lower band is created by subtracting a value of the ATR from the SMA. STARC is an acronym for Stoller Average Range Channels. The indicator is named after its creator, Manning Stoller. You can change long to short in the Input Settings WARNING: - For purpose educate only - This script to change bars colors.Стратегия Pine Script®от HPotter22124
STARC Bands Strategy A type of technical indicator that is created by plotting two bands around a short-term simple moving average (SMA) of an underlying asset's price. The upper band is created by adding a value of the average true range (ATR) - a popular indicator used by technical traders - to the moving average. The lower band is created by subtracting a value of the ATR from the SMA. STARC is an acronym for Stoller Average Range Channels. The indicator is named after its creator, Manning Stoller. WARNING: - This script to change bars colors.Индикатор Pine Script®от HPotter80
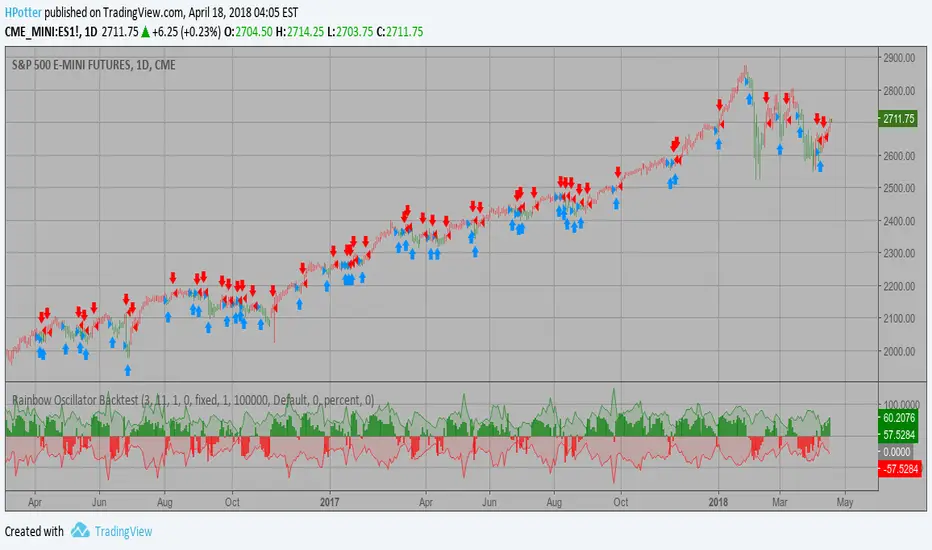
Rainbow Oscillator Backtest Ever since the people concluded that stock market price movements are not random or chaotic, but follow specific trends that can be forecasted, they tried to develop different tools or procedures that could help them identify those trends. And one of those financial indicators is the Rainbow Oscillator Indicator. The Rainbow Oscillator Indicator is relatively new, originally introduced in 1997, and it is used to forecast the changes of trend direction. As market prices go up and down, the oscillator appears as a direction of the trend, but also as the safety of the market and the depth of that trend. As the rainbow grows in width, the current trend gives signs of continuity, and if the value of the oscillator goes beyond 80, the market becomes more and more unstable, being prone to a sudden reversal. When prices move towards the rainbow and the oscillator becomes more and more flat, the market tends to remain more stable and the bandwidth decreases. Still, if the oscillator value goes below 20, the market is again, prone to sudden reversals. The safest bandwidth value where the market is stable is between 20 and 80, in the Rainbow Oscillator indicator value. The depth a certain price has on a chart and into the rainbow can be used to judge the strength of the move. You can change long to short in the Input Settings WARNING: - For purpose educate only - This script to change bars colors.Стратегия Pine Script®от HPotter22103
Rainbow Oscillator Strategy Ever since the people concluded that stock market price movements are not random or chaotic, but follow specific trends that can be forecasted, they tried to develop different tools or procedures that could help them identify those trends. And one of those financial indicators is the Rainbow Oscillator Indicator. The Rainbow Oscillator Indicator is relatively new, originally introduced in 1997, and it is used to forecast the changes of trend direction. As market prices go up and down, the oscillator appears as a direction of the trend, but also as the safety of the market and the depth of that trend. As the rainbow grows in width, the current trend gives signs of continuity, and if the value of the oscillator goes beyond 80, the market becomes more and more unstable, being prone to a sudden reversal. When prices move towards the rainbow and the oscillator becomes more and more flat, the market tends to remain more stable and the bandwidth decreases. Still, if the oscillator value goes below 20, the market is again, prone to sudden reversals. The safest bandwidth value where the market is stable is between 20 and 80, in the Rainbow Oscillator indicator value. The depth a certain price has on a chart and into the rainbow can be used to judge the strength of the move. WARNING: - This script to change bars colors.Индикатор Pine Script®от HPotter70
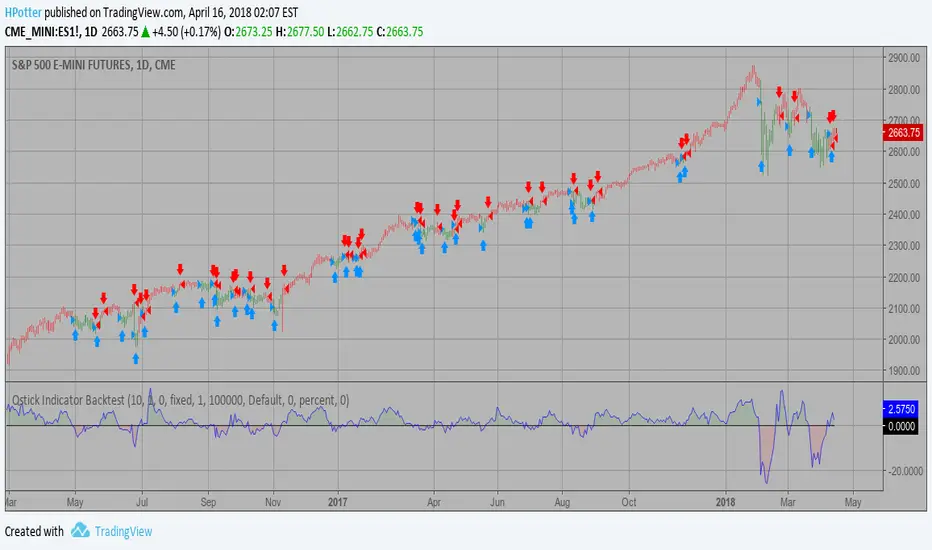
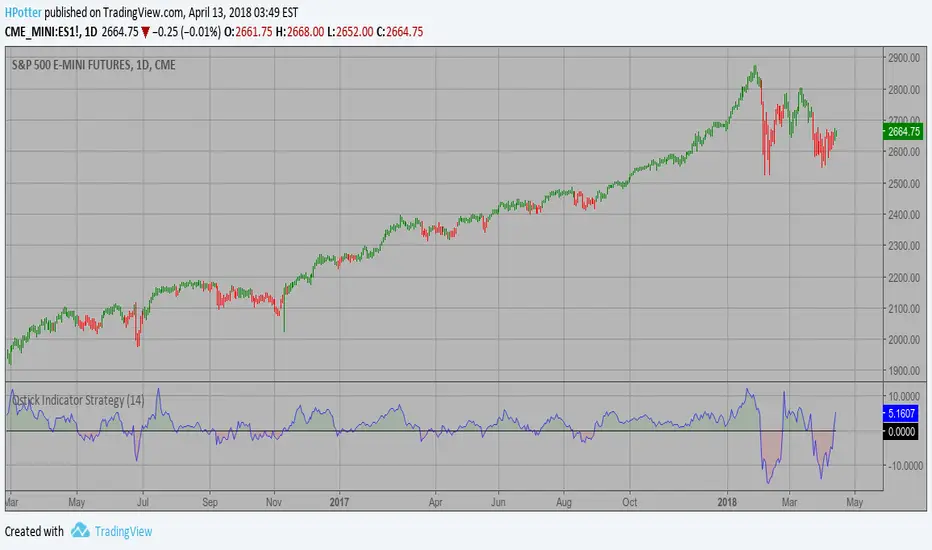
Qstick Indicator Backtest A technical indicator developed by Tushar Chande to numerically identify trends in candlestick charting. It is calculated by taking an 'n' period moving average of the difference between the open and closing prices. A Qstick value greater than zero means that the majority of the last 'n' days have been up, indicating that buying pressure has been increasing. Transaction signals come from when the Qstick indicator crosses through the zero line. Crossing above zero is used as the entry signal because it is indicating that buying pressure is increasing, while sell signals come from the indicator crossing down through zero. In addition, an 'n' period moving average of the Qstick values can be drawn to act as a signal line. Transaction signals are then generated when the Qstick value crosses through the trigger line. You can change long to short in the Input Settings WARNING: - For purpose educate only - This script to change bars colors.Стратегия Pine Script®от HPotter79
Qstick Indicator Strategy A technical indicator developed by Tushar Chande to numerically identify trends in candlestick charting. It is calculated by taking an 'n' period moving average of the difference between the open and closing prices. A Qstick value greater than zero means that the majority of the last 'n' days have been up, indicating that buying pressure has been increasing. Transaction signals come from when the Qstick indicator crosses through the zero line. Crossing above zero is used as the entry signal because it is indicating that buying pressure is increasing, while sell signals come from the indicator crossing down through zero. In addition, an 'n' period moving average of the Qstick values can be drawn to act as a signal line. Transaction signals are then generated when the Qstick value crosses through the trigger line. WARNING: - This script to change bars colors.Индикатор Pine Script®от HPotter90
LSX: Mystery BTC strategy with 100% hit rateI said in the main crypto chat, that it was easy to create a BS strategy with a 100% profit rate, so here's the proof. Looks awesome right? I can promise you, if you trade with this, it will sooner or later blow your account. Keeping the inner workings of it a secret, just like the scammers do. Why am I publishing this? To show why investing in these 'mystery strategies' is a terrible idea. That's also why I've hidden the code, so it looks more attractive than it really is. Say safe, don't get scammed. Don't get rekt. Стратегия Pine Script®от lvturnerОбновлено 33122
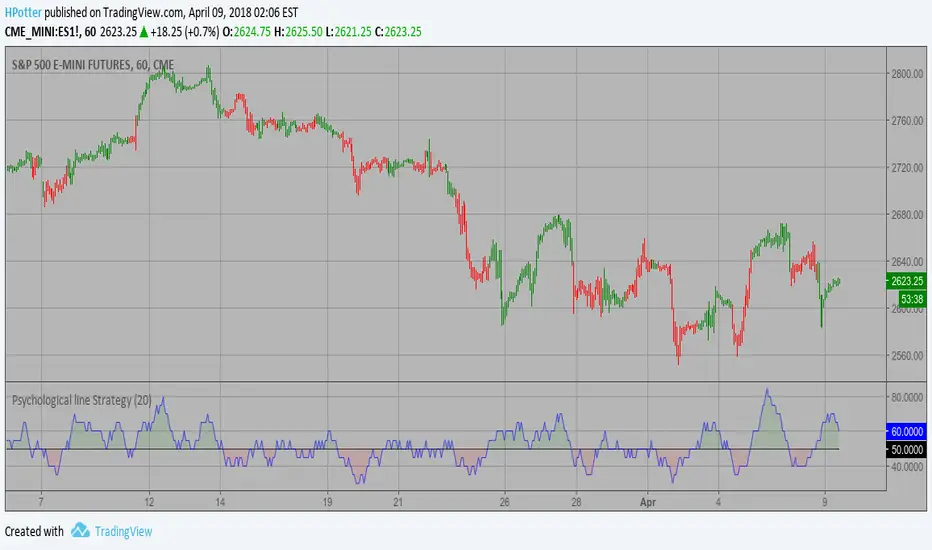
Psychological line Backtest Psychological line (PSY), as an indicator, is the ratio of the number of rising periods over the total number of periods. It reflects the buying power in relation to the selling power. If PSY is above 50%, it indicates that buyers are in control. Likewise, if it is below 50%, it indicates the sellers are in control. If the PSY moves along the 50% area, it indicates balance between the buyers and sellers and therefore there is no direction movement for the market. You can change long to short in the Input Settings WARNING: - For purpose educate only - This script to change bars colors.Стратегия Pine Script®от HPotter22110
Psychological line Strategy Psychological line (PSY), as an indicator, is the ratio of the number of rising periods over the total number of periods. It reflects the buying power in relation to the selling power. If PSY is above 50%, it indicates that buyers are in control. Likewise, if it is below 50%, it indicates the sellers are in control. If the PSY moves along the 50% area, it indicates balance between the buyers and sellers and therefore there is no direction movement for the market. WARNING: - This script to change bars colors.Индикатор Pine Script®от HPotter151
C320up Strategy Tester Start TimeC320up Strategy Tester Start Time This is a little snippet you can paste into your Strategy to set the testing start date and time. It is not a Strategy per se, though is an example with the timestamp script included. Instructions are fairly straight forward, and are listed in the script. If for some reason you also wanted an end date, that too is possible. Just leave a note in the comments. Disclaimer: We searched for a similar script on TV, and could not find anything at this point in time. You can set your preferred date and time in the input section of the settings. Enjoy!Стратегия Pine Script®от C320upОбновлено 5598
inside_bar (by cilivan)Simple script for coloring inside bars to spot them easier (color can be adjusted)Индикатор Pine Script®от cilivan11130
Ichimoku Cloud strategy for gold marketThis strategy is based on main ichimoku features (Leading span , conversion line and base line) compared to cloud conditions. I indicated all possibilities in this indicator and strategy decision is based on crossing factors of each main line through two other line confirmations.Стратегия Pine Script®от issrezaОбновлено 3382
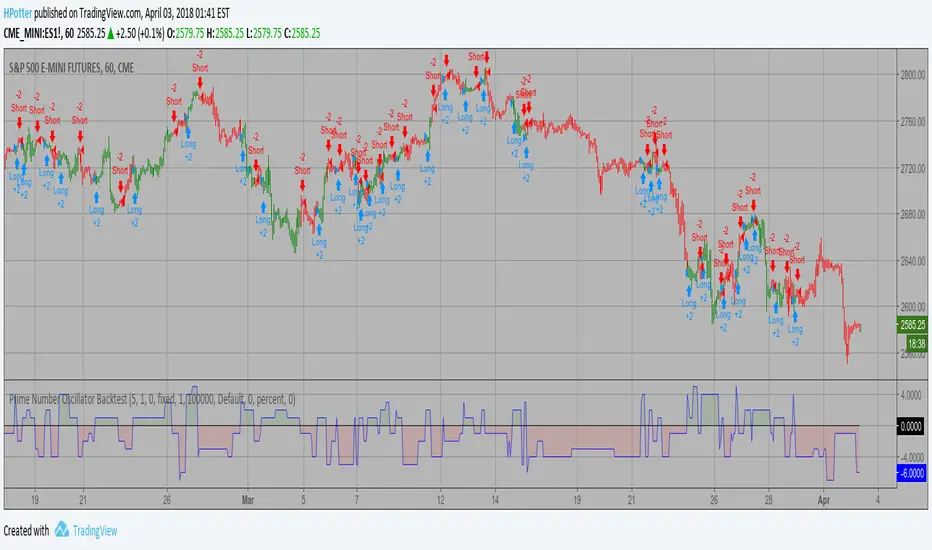
Prime Number Oscillator Backtest Determining market trends has become a science even though a high number or people still believe it’s a gambling game. Mathematicians, technicians, brokers and investors have worked together in developing quite several indicators to help them better understand and forecast market movements. Developed by Modulus Financial Engineering Inc., the prime number oscillator indicates the nearest prime number, be it at the top or the bottom of the series, and outlines the difference between that prime number and the respective series. You can change long to short in the Input Settings WARNING: - For purpose educate only - This script to change bars colors.Стратегия Pine Script®от HPotter31
Prime Number Oscillator Strategy Determining market trends has become a science even though a high number or people still believe it’s a gambling game. Mathematicians, technicians, brokers and investors have worked together in developing quite several indicators to help them better understand and forecast market movements. Developed by Modulus Financial Engineering Inc., the prime number oscillator indicates the nearest prime number, be it at the top or the bottom of the series, and outlines the difference between that prime number and the respective series. WARNING: - This script to change bars colors.Индикатор Pine Script®от HPotter33
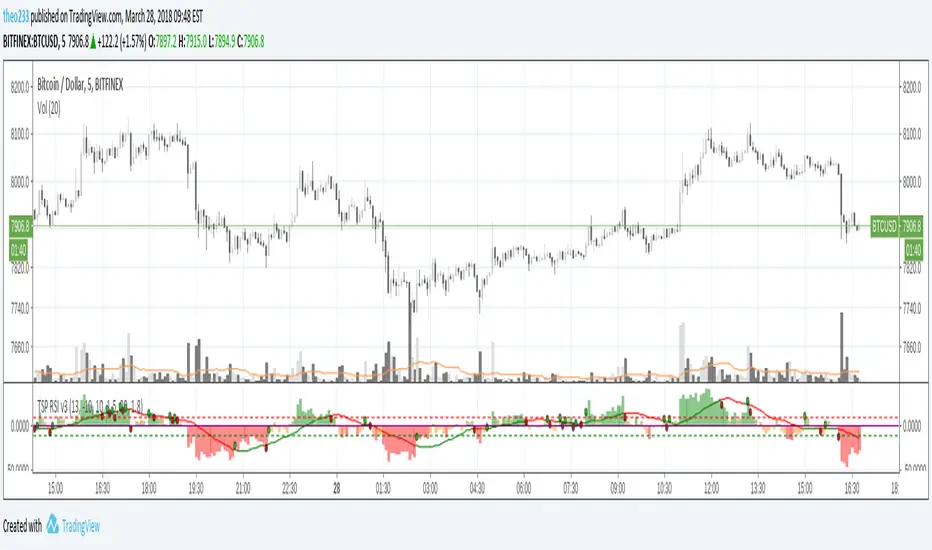
TSP Sexy RSIThe Sexiest RSI in Town ! - Range zone are indicated with lower colors - MA 10 cross signals Индикатор Pine Script®от theo233Обновлено 33118
Prime Number Bands Backtest Determining market trends has become a science even though a high number or people still believe it’s a gambling game. Mathematicians, technicians, brokers and investors have worked together in developing quite several indicators to help them better understand and forecast market movements. The Prime Number Bands indicator was developed by Modulus Financial Engineering Inc. This indicator is charted by indentifying the highest and lowest prime number in the neighborhood and plotting the two series as a band. You can change long to short in the Input Settings WARNING: - For purpose educate only - This script to change bars colors.Стратегия Pine Script®от HPotter2299