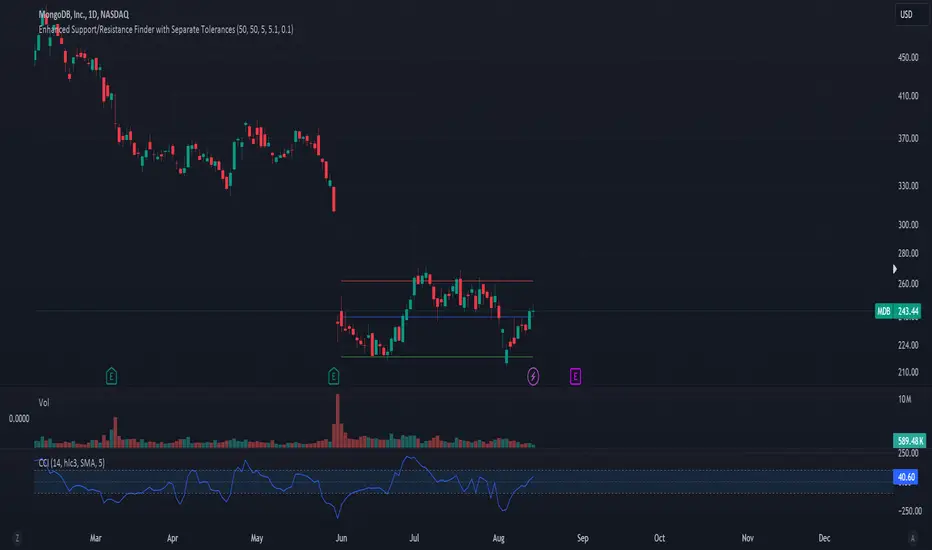
Configurable Level Trading StrategyThe Dynamic Level Reversal Strategy is a trading approach designed to capitalize on price movements between key support and resistance levels. This strategy leverages configurable levels the trader determines, allowing for flexibility and adaptation to different market conditions.
Key Features:
Configurable Levels:
The strategy uses three key levels: Level 1 (Support), Level 2 (Middle), and Level 3 (Resistance). These levels can be adjusted directly within the script settings, making the strategy adaptable to various trading scenarios.
Buy and Sell Signals:
A buy signal is triggered when the price touches Level 1 and shows signs of reversal. The trader enters a position and sets an initial stop-loss just below Level 1.
As the price moves upward, the stop-loss is dynamically adjusted to just below Level 2 and Level 3, locking in profits while managing risk.
A sell signal is generated if the price reverses and crosses below the current stop-loss level, ensuring the trader exits the position with minimized losses.
Iterative Process:
The strategy allows for iterative trades, where the trader re-enters positions at Level 1 or Level 2 if the price revisits these levels, continually adjusting stop-losses and take-profit targets as the price oscillates between the defined levels.
Ideal Use Cases:
Range-Bound Markets: The strategy is particularly effective in markets where the price tends to oscillate between well-defined support and resistance levels.
Volatile Markets: The dynamic adjustment of stop-loss levels helps protect against sudden price reversals, making it suitable for volatile market conditions.
How to Use:
Set the desired levels (Level 1, Level 2, Level 3) based on your market analysis.
The script will automatically generate buy and sell signals, and adjust stop-loss levels as the price moves through the levels.
Monitor the signals and execute trades according to the strategy's guidelines.
Technical_analysis
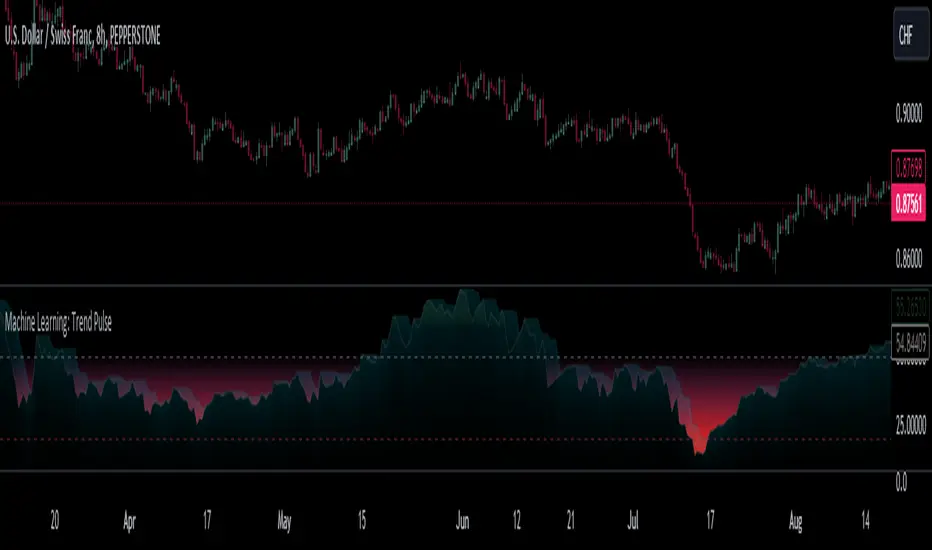
Machine Learning: Trend Pulse⚠️❗ Important Limitations: Due to the way this script is designed, it operates specifically under certain conditions:
Stocks & Forex : Only compatible with timeframes of 8 hours and above ⏰
Crypto : Only works with timeframes starting from 4 hours and higher ⏰
❗Please note that the script will not work on lower timeframes.❗
Feature Extraction : It begins by identifying a window of past price changes. Think of this as capturing the "mood" of the market over a certain period.
Distance Calculation : For each historical data point, it computes a distance to the current window. This distance measures how similar past and present market conditions are. The smaller the distance, the more similar they are.
Neighbor Selection : From these, it selects 'k' closest neighbors. The variable 'k' is a user-defined parameter indicating how many of the closest historical points to consider.
Price Estimation : It then takes the average price of these 'k' neighbors to generate a forecast for the next stock price.
Z-Score Scaling: Lastly, this forecast is normalized using the Z-score to make it more robust and comparable over time.
Inputs:
histCap (Historical Cap) : histCap limits the number of past bars the script will consider. Think of it as setting the "memory" of model—how far back in time it should look.
sampleSpeed (Sampling Rate) : sampleSpeed is like a time-saving shortcut, allowing the script to skip bars and only sample data points at certain intervals. This makes the process faster but could potentially miss some nuances in the data.
winSpan (Window Size) : This is the size of the "snapshot" of market data the script will look at each time. The window size sets how many bars the algorithm will include when it's measuring how "similar" the current market conditions are to past conditions.
All these variables help to simplify and streamline the k-NN model, making it workable within limitations. You could see them as tuning knobs, letting you balance between computational efficiency and predictive accuracy.
SmartVPSGTitle: Identifying Volume Spikes, Price Movements and Gap Ups: A TradingView Script
Introduction:
In the world of trading, identifying volume spikes and price movements can provide valuable insights into market trends and potential trading opportunities. In this article, we'll explore a TradingView script that helps traders visualize volume spikes, price up moves with volume spikes, and gap-up days on their charts.
Detecting Price Up Moves:
The script starts by calculating price up moves. It compares the current day's closing price with the previous day's closing price and checks if it has increased by 3% or more. This helps traders spot significant upward price movements.
Detecting Volume Spurts:
Next, the script focuses on detecting volume spikes, which are often associated with increased market activity and potential trading opportunities. It compares the current day's volume with the highest volume of the previous nine sessions. If the current volume exceeds all the volumes of the previous nine sessions, it is considered a volume spurt.
Example:
Let's consider a hypothetical scenario where we have the following volume data for a stock:
Day 1: 100,000
Day 2: 80,000
Day 3: 120,000
Day 4: 150,000
Day 5: 200,000
Day 6: 90,000
Day 7: 110,000
Day 8: 130,000
Day 9: 140,000
Day 10: 250,000 (current day)
To determine if there is a volume spurt on Day 10, the script compares the current day's volume (250,000) with the highest volume of the previous nine sessions. In this case, the highest volume among the previous nine sessions is 200,000 (on Day 5). Since the current day's volume (250,000) exceeds the highest volume of the previous nine sessions (200,000), it is considered a volume spurt.
Identifying Gap-Up Days:
Gap-up days occur when the market opens significantly higher than the previous day's close. To identify these days, the script compares the current day's low price with the previous day's high price. If the low price is greater than the previous day's high, it is marked as a gap-up day.
Visualizing the Findings:
To provide a clear visual representation of the identified patterns, the script uses different shapes and colors. First, it plots small red dots above the candles whenever a volume spurt is detected. These dots help traders quickly identify periods of increased volume activity.
For price up moves with volume spikes, the script utilizes blue triangular shapes below the candles. This allows traders to pinpoint instances where both price and volume are showing positive signs, indicating potential bullish movements.
Additionally, the script incorporates green candles to represent gap-up days. These candles help traders recognize days when the market opens with a significant upward gap, suggesting a potential shift in market sentiment.
Conclusion:
The TradingView script discussed in this article provides traders with a visual representation of volume spikes , price up moves with volume spikes , and gap-up days . By incorporating these visual cues into their analysis, traders can gain valuable insights into market trends and potential trading opportunities.
Remember, this script should be used for educational and informational purposes only and does not serve as financial advice or recommendations. Traders are encouraged to customize and modify the script according to their specific trading strategies and risk tolerance.
Share this script with other traders on TradingView to enhance their chart analysis and trading decisions.
PS: This TradingView script is designed to work specifically on the daily timeframe (daily candles). It calculates and identifies volume spurts based on the volume data of the daily timeframe. Since it is designed for the daily timeframe, it may not produce accurate results or work as intended on other timeframes.

Stoch RSI 15 min - multi time frame tableABOUT THIS INDICATOR
This indicator calculates the Stochastic RSI for the time frames 15 min, 30 min, 1h, 4h, and 12h. However, the 15 min time frame should always be the default time frame for your chart.
IMPORTANT
* NOTE! It's extremely important that the chosen time frame for your chart is 15 min. Otherwise the Stochastic RSI for the longer time frames won’t be correctly calculated.
* Stochastic RSI will be calculated and displayed in a table for the time frames: 15 min, 30 min, 1h, 4h, 12h.
* All time frames are based on closed bars except the "15minR" that are realtime updated values calculated on a 15 min time frame.
ABOUT STOCHASTIC RSI
The Stochastic RSI (StochRSI) is a momentum indicator that ranges between 0 and 100. A Stochastic RSI value above 80 is considered overbought and below 20 is considered oversold.
By using different time frames you can get a better idea of what direction the trade could take in a "longer" perspective.
SETTINGS
1.) Length RSI = 14 (default period)
2.) Smoothing parameter of Stochastic RSI (Length Moving Average = 3) . Moving average of stochastic RSI
* By default the displayed Stochastic RSI values are smoothed values of the actual Stochastic RSI. The smoothnes is formed by a calculated moving average of with the length of 3 by default.
If you want Stochastic RSI with a sharper signal (higher risk for "false alarms" being more sensitive) change the Length Moving Average to = 1 (no smoothness at all)
You can see the selected "Length RSI" and "Length Moving Average" on top of the Stochastic RSI table.
Next version of this script will be updated with more a more flexible solution for different time frames.
* NOTE, Tradingview comes with a inbuilt Stochastic RSI. See the the chart below. The blue line in the Stochastic-RSI chart represents (K value = 3) the same value as the script calculate/display in the table.

Up & Down Trend following trading strategy for BTC/USDT 3hThis strategy is based on multi time frame technical indicators such as;
1. RSI (10,50,100)
2. MFI (10,50,100)
3. RVI (10,50,100)
4. BOP (10,50,100)
5. Super Trend
6. SAR indicator
7. Higher highs and lower lows
8. SMA (9,500)
9. EMA (9,200)
After evaluating different parameters provided by those indicators, script is in a possition to determine optimul positions to enter in to market as well as exit from the market. In some cases stratergy will exit fully or partially depends on the situation. Other than that, this strategy is in a possition to calculate and specify the quantity you need to buy or sell depending on market situation. You can specify amount available for investment and how many times you are going to average (if downtrend). Parameters are optimised to BTC/USDT, 3h standerd candlestic chart.
goodluck

Brick Count Indicator Friends, "Brick Count indicator" works on very easy calculations. We had to develop this indicator on the trading view. This indicator was not available elsewhere. This indicator counts bullish and bearish candles at the default settings of the last 40 periods. Which shows us the trend of the market. If the bullish candle is high then it means in the market uptrend and if the bearish candle is high then it shows that the market is bearish.

PorcupineDisplays "spike days" by colouring the bars (Default: yellow for a Spike High and blue for a Spike Low)
Spike Day's definition taken from Jack D Schwager's Book: A Complete Guide to the Futures Market: Technical Analysis, Trading Systems, Fundamental Analysis, Options, Spreads, and Trading Principles
A spike is:
A wide difference between the spike high and the highs of the preceding and succeeding days.
A close near the low of the day's range.
A substantial price advance preceding the spike's formation.
The more extreme each of these conditions, the greater the likelihood that a spike high will prove to be an important relative high or even a major top.
(inverse is true for lows, basically)
Enjoy!

Kovach OBVThe Kovach OBV measures sustained buying pressure. It features advanced signal processing algorithms to minimize lag and filter the effects of volatility. Consider using it with the Kovach Chande indicator and Kovach Momentum indicator.

MA PostureA simple script I wrote that allows you to look at the posture of a moving average. Rates of change can be useful to understanding momentum. Additionally, I have included a signal line so you can see if the posture is more or less than average.
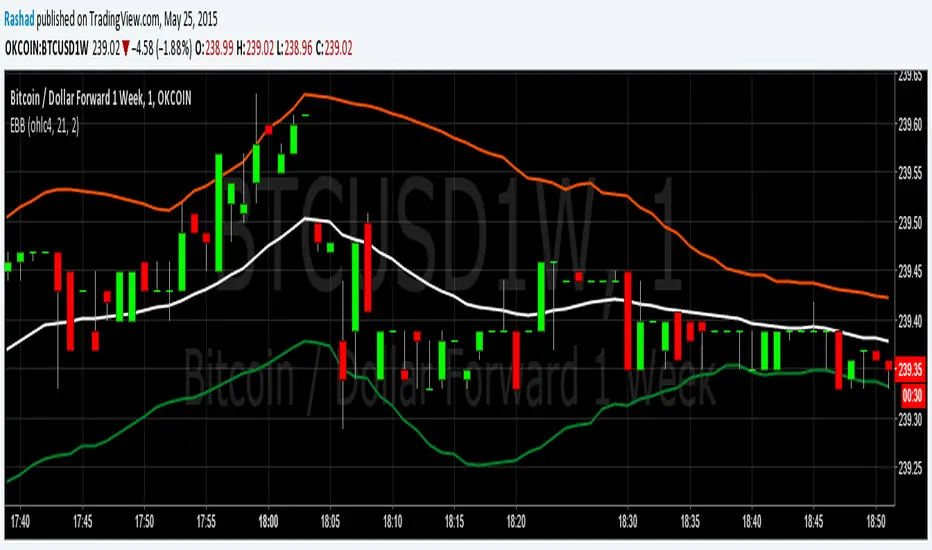
Exponential Bollinger BandsThese Bollinger Bands are exponential because the variance is calculated using the exponential moving average, rather than just adding the normal standard deviation to the ema. This may be more useful because the exponential standard deviation should be more sensitive to near term increases or decreases in volatility.
Please do not forget that Bollinger Bands should always be combined with another method of analysis. Bollinger Bands just provide an easy way to gauge where the price could range in. At 2 standard deviations of a continuously random variable, more than 98% of data points are in this range. I am however going to test this in excel to get the average number of data points that stay in the range for Bitcoin. I will upload my findings when I complete that. Please monitor this description if your interested.
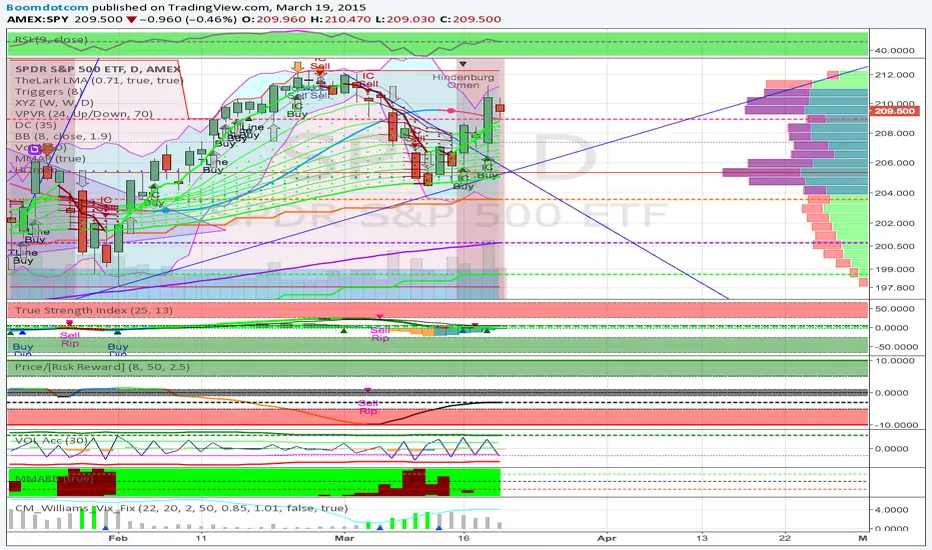
Hindenburg Omen - CleanThe Hindenburg Omen, is market breadth signal that marks when a critical set of market factors that can create the necessary conditions for a stock market crash.
Based on Technical Breadth Indicators of the NYSE, a broad equity market index.
More information on the conditions of the Hindenburg Omen can be found here,
en.wikipedia.org
www.investopedia.com
Please use at your own discretion.
If you find my work useful, my BTC tip jar is @ 1JSKKkqWCArgyqsZUQEdVYEYBbTGhw8sDp
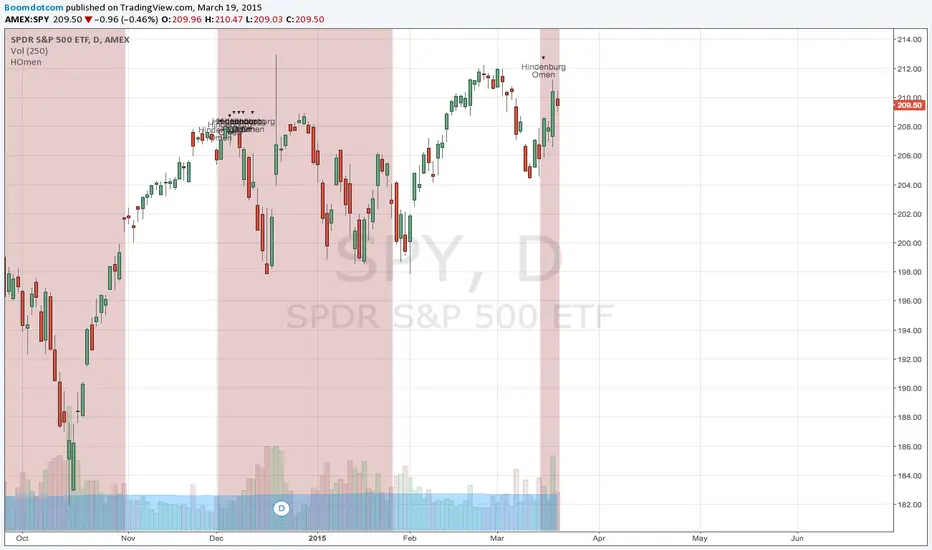
Hindenburg OmenThe Hindenburg Omen, is market breadth signal that marks when a critical set of market factors that can create the necessary conditions for a stock market crash.
Based on Technical Breadth Indicators of the NYSE, a broad equity market index.
More information on the conditions of the Hindenburg Omen can be found here,
en.wikipedia.org
www.investopedia.com
Please use at your own discretion.
If you find my work useful, my BTC tip jar is @ 1JSKKkqWCArgyqsZUQEdVYEYBbTGhw8sDp
Vortex Indicator with Thresholds DefinedA problem I noticed with the built in Vortex indicator was that it didn't include any defined thresholds that are important to understanding how to read the vortex indicator. So I modified the vortex indicator in order to have the thresholds built in so you don't have to draw horizontal lines on your chart.
