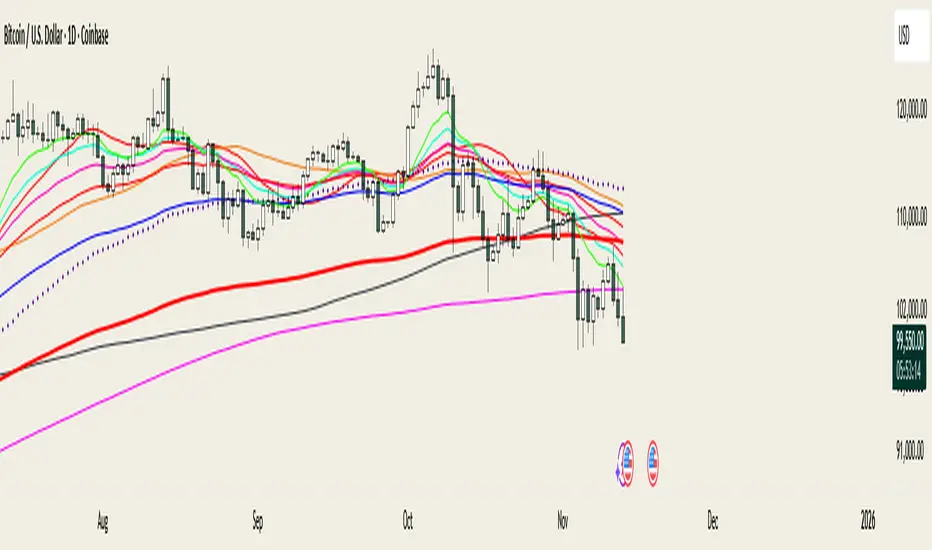
@MO_XBT - EMA/MA ToolkitClean set of EMAs & MAs I use for trend tracking, momentum shifts, and cross signals
If you found this useful, follow me on X: @mo_xbt
Technicalindicator
Impulse Volume Oscillator [Alpha Extract]Impulse Volume Oscillator
A sophisticated indicator designed to identify market impulse moves and volume-based momentum shifts, helping traders capture significant price movements with precision.
Combining price deviations with volume analysis, this oscillator dynamically measures market strength and weakness, providing clear signals for potential trend continuations and reversals.
🔶 Volume-Adjusted Normalization
Utilizes a unique normalization technique that incorporates volume impact to enhance signal quality. This approach ensures the indicator responds more strongly to high-volume price movements while filtering out low-volume noise.
vol_ratio = ta.rsi(volume, 14) / 50
vol_factor = vol_impact > 0 ? 1 + (vol_ratio - 1) * vol_impact : 1
raw_normalized = dev / (ta.stdev(source, bars) * mult)
vol_adjusted = raw_normalized * vol_factor
normalized = ta.sma(vol_adjusted, smooth)
🔶 Adaptive Regime Detection
Incorporates threshold-based regime identification that clearly distinguishes between trending and mean-reverting market conditions. The customizable threshold system allows traders to adapt to different market volatilities and timeframes.
🔶 Customizable Parameters
Fine-tune detection sensitivity with adjustable inputs for lookback period, standard deviation multiplier, volume impact, and signal smoothing. These parameters enable traders to optimize the indicator for various trading styles and market conditions.
❓How It Works
🔶 Impulse Calculation
The oscillator measures price deviation from a moving average baseline, normalized by standard deviation, and then adjusts the signal based on relative volume strength. This creates a responsive yet stable indicator that accurately reflects market momentum.
// Calculate the basis using the selected MA
basis = get_ma(source, bars)
// Calculate the normalized value with volume impact
dev = source - basis
🔶 Dynamic Visualization
The histogram changes color based on signal strength, providing instant visual cues about market conditions. Green bars indicate positive momentum while red bars represent negative momentum, with color intensity reflecting signal strength.
🔶 Trend Confirmation
Built-in trend direction analysis provides confluence with the primary signal, helping traders distinguish between counter-trend bounces and genuine trend reversals. This dual-confirmation approach significantly reduces false signals.
🔶 Visual Alerts & Boundary Tracking
Monitors signal extremes and dynamically adjusts visualization transparency based on signal strength. The indicator highlights particularly strong impulse moves with background shading, making potential trading opportunities immediately apparent.
🔶 Custom Candle Coloring
Optional candle coloring applies the same color logic as the histogram directly to price candles, providing a unified visual framework that helps traders correlate indicator signals with price action.
🔶 Momentum Shift Detection
Automatically identifies important zero-line crossovers that often signify the beginning of new impulse moves. These transition points frequently offer favorable risk/reward entry opportunities.
🔶 Snapshot samples
1 Week
1 Day
15 Min
🔶 Why Choose AE - Impulse Volume Oscillator?
This indicator provides a comprehensive approach to identifying significant market moves by combining volume analysis with price momentum. By offering clear visual signals for both trend continuation and reversal scenarios, it empowers traders to make more informed decisions across various market conditions and timeframes.

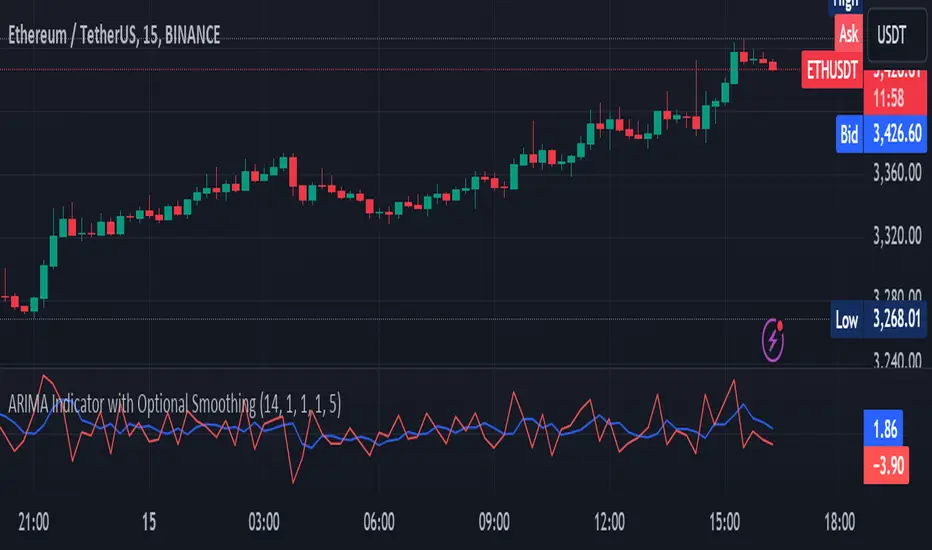
ARIMA Indicator with Optional SmoothingOverview
The ARIMA (AutoRegressive Integrated Moving Average) Indicator is a powerful tool used to forecast future price movements by combining differencing, autoregressive, and moving average components. This indicator is designed to help traders identify trends and potential reversal points by analyzing the historical price data.
Key Features
AutoRegressive Component (AR): Utilizes past values to predict future prices.
Moving Average Component (MA): Averages past price differences to smooth out noise.
Differencing: Reduces non-stationarity in the time series data.
Optional Smoothing: Applies EMA to the ARIMA output for a smoother signal.
Customizable Parameters: Allows users to adjust AR and MA orders, differencing periods, and smoothing lengths.
Concepts Underlying the Calculations
Differencing: Subtracts previous prices from current prices to remove trends and seasonality, making the data stationary.
AutoRegressive Component (AR): Predicts future prices based on a linear combination of past values.
Moving Average Component (MA): Uses past forecast errors to refine future predictions.
Exponential Moving Average (EMA): Applies more weight to recent prices, providing a smoother and more responsive signal.
How It Works
The ARIMA Indicator first calculates the differenced series to achieve stationarity. Then, it computes the simple moving average (SMA) of this differenced series. The indicator uses the AR and MA components to adjust the SMA, creating an approximation of the ARIMA model. Finally, an optional smoothing step using EMA can be applied to the ARIMA approximation to produce a smoother signal.
How Traders Can Use It
Traders can use the ARIMA Indicator to:
Identify Trends: Detect emerging trends by observing the direction of the ARIMA line.
Spot Reversals: Look for divergences between the ARIMA line and the price to identify potential reversal points.
Generate Trading Signals: Use crossovers between the ARIMA line and the price to generate buy or sell signals.
Filter Noise: Enable the optional smoothing to filter out market noise and focus on significant price movements.
Example Usage Instructions
Add the ARIMA Indicator to your chart.
Adjust the input parameters to suit your trading strategy:
Set the SMA Length (e.g., 14).
Choose the Differencing Period (e.g., 1).
Define the AR Order (p) and MA Order (q) (e.g., 1).
Configure the Smoothing Length if smoothing is desired (e.g., 5).
Enable or disable smoothing as needed.
Observe the ARIMA line (blue) and compare it to the price chart.
Use the ARIMA line to identify trends and potential reversals.
Implement trading decisions based on the ARIMA line’s behavior relative to the price.
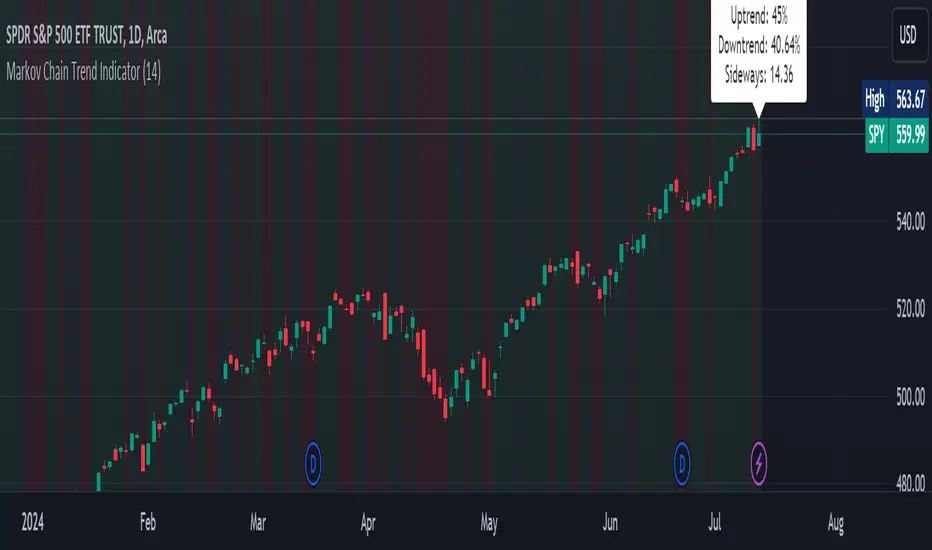
Markov Chain Trend IndicatorOverview
The Markov Chain Trend Indicator utilizes the principles of Markov Chain processes to analyze stock price movements and predict future trends. By calculating the probabilities of transitioning between different market states (Uptrend, Downtrend, and Sideways), this indicator provides traders with valuable insights into market dynamics.
Key Features
State Identification: Differentiates between Uptrend, Downtrend, and Sideways states based on price movements.
Transition Probability Calculation: Calculates the probability of transitioning from one state to another using historical data.
Real-time Dashboard: Displays the probabilities of each state on the chart, helping traders make informed decisions.
Background Color Coding: Visually represents the current market state with background colors for easy interpretation.
Concepts Underlying the Calculations
Markov Chains: A stochastic process where the probability of moving to the next state depends only on the current state, not on the sequence of events that preceded it.
Logarithmic Returns: Used to normalize price changes and identify states based on significant movements.
Transition Matrices: Utilized to store and calculate the probabilities of moving from one state to another.
How It Works
The indicator first calculates the logarithmic returns of the stock price to identify significant movements. Based on these returns, it determines the current state (Uptrend, Downtrend, or Sideways). It then updates the transition matrices to keep track of how often the price moves from one state to another. Using these matrices, the indicator calculates the probabilities of transitioning to each state and displays this information on the chart.
How Traders Can Use It
Traders can use the Markov Chain Trend Indicator to:
Identify Market Trends: Quickly determine if the market is in an uptrend, downtrend, or sideways state.
Predict Future Movements: Use the transition probabilities to forecast potential market movements and make informed trading decisions.
Enhance Trading Strategies: Combine with other technical indicators to refine entry and exit points based on predicted trends.
Example Usage Instructions
Add the Markov Chain Trend Indicator to your TradingView chart.
Observe the background color to quickly identify the current market state:
Green for Uptrend, Red for Downtrend, Gray for Sideways
Check the dashboard label to see the probabilities of transitioning to each state.
Use these probabilities to anticipate market movements and adjust your trading strategy accordingly.
Combine the indicator with other technical analysis tools for more robust decision-making.
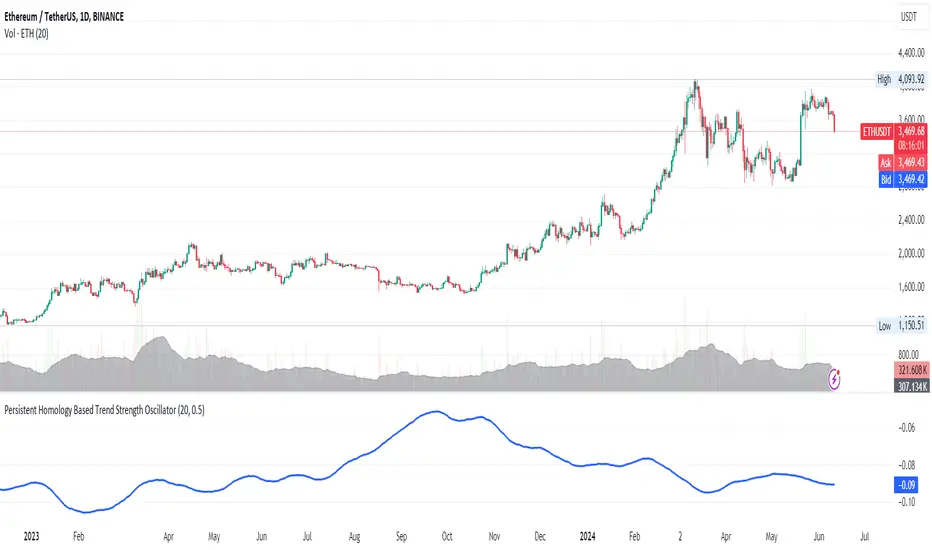
Persistent Homology Based Trend Strength OscillatorPersistent Homology Based Trend Strength Oscillator
The Persistent Homology Based Trend Strength Oscillator is a unique and powerful tool designed to measure the persistence of market trends over a specified rolling window. By applying the principles of persistent homology, this indicator provides traders with valuable insights into the strength and stability of uptrends and downtrends, helping to inform better trading decisions.
What Makes This Indicator Original?
This indicator's originality lies in its application of persistent homology , a method from topological data analysis, to financial markets. Persistent homology examines the shape and features of data across multiple scales, identifying patterns that persist as the scale changes. By adapting this concept, the oscillator tracks the persistence of uptrends and downtrends in price data, offering a novel approach to trend analysis.
Concepts Underlying the Calculations:
Persistent Homology: This method identifies features such as clusters, holes, and voids that persist as the scale changes. In the context of this indicator, it tracks the duration and stability of price trends.
Rolling Window Analysis: The oscillator uses a specified window size to calculate the average length of uptrends and downtrends, providing a dynamic view of trend persistence over time.
Threshold-Based Trend Identification: It differentiates between uptrends and downtrends based on specified thresholds for price changes, ensuring precision in trend detection.
How It Works:
The oscillator monitors consecutive changes in closing prices to identify uptrends and downtrends.
An uptrend is detected when the closing price increase exceeds a specified positive threshold.
A downtrend is detected when the closing price decrease exceeds a specified negative threshold.
The lengths of these trends are recorded and averaged over the chosen window size.
The Trend Persistence Index is calculated as the difference between the average uptrend length and the average downtrend length, providing a measure of trend persistence.
How Traders Can Use It:
Identify Trend Strength: The Trend Persistence Index offers a clear measure of the strength and stability of uptrends and downtrends. A higher value indicates stronger and more persistent uptrends, while a lower value suggests stronger and more persistent downtrends.
Spot Trend Reversals: Significant shifts in the Trend Persistence Index can signal potential trend reversals. For instance, a transition from positive to negative values might indicate a shift from an uptrend to a downtrend.
Confirm Trends: Use the Trend Persistence Index alongside other technical indicators to confirm the strength and duration of trends, enhancing the accuracy of your trading signals.
Manage Risk: Understanding trend persistence can help traders manage risk by identifying periods of high trend stability versus periods of potential volatility. This can be crucial for timing entries and exits.
Example Usage:
Default Settings: Start with the default settings to get a feel for the oscillator’s behavior. Observe how the Trend Persistence Index reacts to different market conditions.
Adjust Thresholds: Fine-tune the positive and negative thresholds based on the asset's volatility to improve trend detection accuracy.
Combine with Other Indicators: Use the Persistent Homology Based Trend Strength Oscillator in conjunction with other technical indicators such as moving averages, RSI, or MACD for a comprehensive analysis.
Backtesting: Conduct backtesting to see how the oscillator would have performed in past market conditions, helping you to refine your trading strategy.
Opening Range with Infinite Price TargetsOpening Range with Infinite Price Targets is an ORB indicator that automatically generates price targets into infinity based on a user-defined % of range.
This indicator includes many nice-to-have features missing from other indicators. Such as:
Price Target Labels with Price tooltip, want to know exactly what price pt3 is at? Hover over it and see.
Custom Defined Range time, Set your Range Start and end time to whatever you need, Doesn't have to be pinned to opening range!. Note: Time is in chart time.
Historical View (Default off), Tired of your chart looking messy with a ton of lines from historical data? No problem! You can choose to view or not view historical data.
Alerts for Range Breaks, First Range Breaks, and Discovery Price Target hits. As well as Exported Values for Range High, Low, and Mean to set your own alerts from custom sources.
Custom Price Targets, set your price targets to a % of the range based on your own strategy.
Last but not Least, Infinitely Generating Price Targets. They just keep building. New Targets will be generated when the price closes above/below the current farthest target.
Enjoy!

Divergence Energy Pro (DE Pro) MI05Divergence Energy Pro acts as an trend & volatility indicator calculated by combination of Moving Average data.
The Green bar indicates bullish energy, while the Red bar indicates bearish energy.
The length of the colour (red/green) bar indicates the energy's strength/momentum.
When the fisrt or second Green bar above the Zero Axis 💚 and MA line represents a strong bullish energy,
whereas the first or second Red bar below the Zero Axis ❤️ and MA line represents a strong bearish energy.
Apart from tracking the bullish/bearish trend in the market, it may be used to monitor the divergence/convergence between price and technical indicator.
Divergence occurs when the price moves in the opposite direction of a technical indicator, potentially leading a price shift.
Disclaimer:
This script indicator is solely for the purpose of education / opinion sharing only, and should not be construed as investment advice or recommendations to buy or sell any security.
Get your trade advise from a legit broker, you are responsible on your own trade.
Thank you.

Trend Indicator with BUY SELL signalsThe Script can be used to identify the main trend and take BUY/SELL decisions in the lower time frames.
The tool can be applied as follows
1) Apply the tool your favorite chart
2) Select the main trend.
3) Go to lower time frames to check the BUY/SELL signals. Example: If the selected main trend is 4 hrs then go to time frames below 4 hrs to find the entry and exit positions.
Feel free to reach out to me if you need any further information

Strategy Builder Crypto V6Hello everyone
This indicator is the result of 7 years of trading (including 3 years of analyzing day and night how crypto assets behave).
I made it fully customizable but I wouldn't recommend changing the default values as they're the most optimal ones for now. Might change in the future but I'm very happy with the signals so far and I hope you'll be as well :)
Without further due, let's dig into it...
0 - Algo trading and Why
In the crypto trading, there is a lot of useless noise (we can probably thank Crypto Twitter for that :p) and a lot of useless data with the sole purpose is to lure you (who said Bitfinex Long/Short ratio or CME gaps ??)
I wanted to remove all the useless and only focus on Technical Analysis (TA) because I was deeply convinced that TA includes by design Fundamental Analysis (FA) and Pumponomics Analysis (PA) - PA being for instance when your favorite twitter guru will pump and dump on you
I heard that so many people got REKT from the previous bear market and I wanted to give back to the community - who helped me so much a few years back.
I worked hard to design the method and make it simple for the public and for FREE (so far as I want to collect feedbacks from the community and improving the indicator)
THIS IS MY GIFT TO YOU
1 - Input values
I'll explain later on through a medium article what each parameter means and how to set them up. For now, please used the optimized and recommended values already set in the indicator
2 - The method
This method works for intraday trading for timeframes between m5 and H1. Any timeframe above could work but would give signals too late - in this case, I would recommend changing the inputs with smaller values to adjust
I see a trend being composed of a main trend, and mini sub trends. In other words, for instance, a weekly bullish trend is made of smaller H4 bullish trends. Hope it makes sense so far
Let's call the weekly trend the MAIN trend and the H4 smaller trends the SECONDARY trends
That's exactly what this indicator is about
It will catch the best MAIN trend and all the SECONDARY trends in the same direction of the MAIN trend.
It's up to you if you want to take all the SECONDARY trends or only the first one in the sequence.
3 - Invalidation signal
A signal invalidation is used to make you exiting your position with a small loss before your stop loss will get hit. Very powerful way to save your capital and limit your losses.
You'll find the indicator here on tradingview for free under the name Trend signal with Alert (made by myself)
Trend signal with Alert
to invalidate entries. You'll need to request an invite
Briefly, let's assume we get a BUY signal. I would exit the position either if I'm getting a DOWN trend signal. It means, if the oblique/logarithmic trendline is broken, then it's better to exit the position and wait for the indicator to give another BUY signal later hopefully
Best case, it will limit your loss in case the asset will dump.
Worst case, this strict management strategy will make you exiting your position for no reason and you'll re-enter later (with a signal) at almost the same price or a bit higher
In the long run, this method will prevent you from having big losses
4 - Stop Loss and Take profits levels
It's really up to you. It depends of your capital and psychology
This indicator is made to give big moves but that's not 100% guaranteed. You can draw some trendlines or use moving averages in big timeframes to set your take profit and stop loss levels.
I personally use this also, along with fibonacci on the weekly/monthly timeframes for my take profit levels
As I'm a nice person, I'm linking the Fibonacci indicator that I use here
Automatic Multi-timeframes fibonacci zones
. You'll also need to request an invite for that one
4-bis - Trailing stop
Not financial advice but I use a supertrend and I have a software that will trail my stop according to that supertrend level
For LONG positions, we could set the trailing below the supertrend.
For SHORT positions, we could set the trailing above the supertrend.
You'll find the indicator here on tradingview for free under the name Supertrend V1.0 - Buy or Sell Signal
5 - Which assets
It's working with the default values on major/mid/small caps and for ALTS/BTC, ALTS/USD and ALTS/ETH pairing
YES, THIS IS MOST AWESOME THING OF THE ENTIRE UNIVERSE !!!
6 - Best setup
m15 timeframe is my preferred one for this method. Best Risk/Reward/Invalidations ratio among all other timeframes
I strongly recommend to use the Trend Signal with the input value 14 for the invalidations
If you enter on a BUY signal, and get a RED trend signal, exit immediately the position without waiting for any other confirmation/pullback or anything else
If you enter on a SELL signal, and get a BLUE trend signal, exit immediately the position without waiting for any other confirmation/pullback or anything else
For the trailing stop/Supertrend value, it depends of your capital and how big your stop loss should be. I personally use the settings in the Supertrend indicator
7 - Alerts
You can setup alerts for the primary and secondary signals in Tradingview so that you won't have to stare at the charts all day long. You mental healthy is my priority above everything else :)
8 - More to come
I personally use the alerts from this indicator coupled with a system to take the trades given by the tradingview alerts. I'll publish it later on if I feel the indicator collects enough interest from you guys
