Standalone MA Crossover Matrix & Tickercrossover very useful for trade confirmation please use with other indicator Индикатор Pine Script®от mahendrabgavali11
Nova Statistical Filtering Oscillator [Pineify]Nova Statistical Filtering Oscillator - Advanced Mean Reversion Trading Tool A sophisticated statistical oscillator that identifies overbought and oversold market conditions using Z-Score normalization and dynamic volatility bands The Nova Statistical Filtering Oscillator (NSFO) is an advanced technical analysis tool designed to help traders identify potential mean reversion opportunities in financial markets. By combining statistical price normalization with adaptive smoothing techniques, this indicator provides a unique approach to detecting extreme price conditions and anticipating momentum reversals. Z-Score based statistical analysis Triple Exponential Moving Average (TEMA) smoothing Dynamic volatility bands Automatic mean reversion signal generation Gradient color visualization Customizable parameters Statistical overbought/oversold detection Noise reduction through TEMA smoothing Adaptive bands that adjust to market volatility Clear buy and sell signal indicators Visual gradient coloring for quick analysis Configurable alert conditions The NSFO operates through a sophisticated three-step statistical process that transforms raw price data into actionable trading signals. Step 1: Z-Score Calculation The indicator first calculates the Z-Score, which measures how many standard deviations the current price is from its historical mean. This statistical normalization allows traders to objectively identify when price has moved to statistically extreme levels. The formula uses a configurable lookback period (default 20 bars) to compute both the simple moving average (mean) and standard deviation. A Z-Score greater than +2 or less than -2 indicates statistically rare extreme conditions, occurring approximately only 5% of the time. Step 2: TEMA Smoothing Raw Z-Score values can be volatile and produce choppy signals. The NSFO applies Triple Exponential Moving Average (TEMA) smoothing to reduce market noise while maintaining responsiveness. TEMA combines three successive EMAs using the formula: 3×EMA1 - 3×EMA2 + EMA3, achieving smoother results with less lag compared to traditional moving averages. Step 3: Dynamic Volatility Bands Unlike static overbought/oversold levels, the NSFO creates adaptive bands based on the volatility of the smoothed oscillator itself. This self-referential approach automatically adjusts to changing market conditions - becoming wider during volatile markets and narrower during calm periods. The bands are calculated using the standard deviation of the smoothed oscillator multiplied by a configurable factor (default 2.0). The NSFO is built on the fundamental principle of mean reversion - the statistical observation that prices tend to return to their average over time. This concept has been validated through decades of market research and forms the basis of many successful trading strategies. Statistical Extremes as Trade Setups : When the oscillator reaches the upper or lower bands, it indicates the price has moved to a statistically extreme level. These conditions often precede reversals as the market corrects itself back toward the mean. Momentum Confirmation : The gradient coloring system provides instant visual feedback on current momentum. When the oscillator transitions from extreme levels toward the center, it confirms that momentum is shifting and the reversal may be gaining strength. Time Frame Flexibility : The NSFO performs well across various time frames, from intraday charts to weekly frames. Shorter time frames generate more signals but require tighter risk management, while longer time frames produce fewer but potentially more reliable signals. The NSFO uniquely combines three distinct technical concepts into a cohesive system: Statistical Analysis (Z-Score) : Provides the mathematical foundation for identifying extreme price conditions using probability theory. This transforms subjective "overbought" or "oversold" labels into quantifiable statistical measurements. Moving Average Smoothing (TEMA) : Reduces the inherent noise in raw statistical values while maintaining sensitivity to genuine price movements. The triple-layer EMA approach minimizes lag that typically affects simple moving averages. Volatility-Based Bands : Creates adaptive thresholds that automatically adjust to current market conditions. This dynamic approach outperforms fixed-level indicators by accounting for the reality that market volatility changes over time. The synergy between these three components creates a robust system where each element addresses a weakness in the others. The Z-Score provides statistical rigor, TEMA adds smoothness for actionable signals, and dynamic bands ensure the indicator remains effective across varying market conditions. The Nova Statistical Filtering Oscillator offers several distinctive features that set it apart from traditional technical indicators: Self-Referential Adaptation : The volatility bands are calculated from the oscillator's own standard deviation, creating a truly adaptive system that automatically adjusts to current market conditions without manual parameter changes. Gradient Visualization : The color gradient provides at-a-glance understanding of current market position relative to statistical extremes, making it easy to identify both extreme conditions and transitions. Zero Baseline Clarity : The central baseline at zero represents the statistical mean, providing an immediate visual reference point for understanding whether price is above or below its historical average. Clean Signal Generation : Buy and sell signals are generated only when the oscillator crosses back from extreme levels, filtering out premature entries and focusing on confirmed reversals. Using the NSFO effectively requires understanding both its signals and its limitations. Here's how to integrate it into your trading strategy: Identifying Overbought Conditions : When the oscillator crosses below the upper band (red line), it indicates the price has extended statistically above its average. This suggests a potential selling opportunity as the market may revert toward the mean. Identifying Oversold Conditions : When the oscillator crosses above the lower band (green line), it indicates the price has dropped statistically below its average. This suggests a potential buying opportunity as the price may bounce back toward the mean. Signal Confirmation : Wait for the oscillator to cross back toward the center (zero line) before entering a trade. This confirms the reversal is underway rather than just touching the extreme level. Trend Context : Always consider the broader trend direction. In strong trending markets, the oscillator may remain at extreme levels for extended periods. Use additional trend indicators for confirmation. Important Note: No indicator guarantees profitable trades. Always use proper risk management and consider combining NSFO with other technical or fundamental analysis tools for better decision-making. The NSFO provides several customizable parameters to suit different trading styles and market conditions: Statistical Window (default: 20) : Controls the lookback period for calculating mean and standard deviation. Higher values produce more stable readings but respond slower to price changes. Lower values are more responsive but may generate more false signals. Smoothing Length (default: 10) : TEMA period for reducing noise in the Z-Score. Higher values create smoother lines with more lag, while lower values are more responsive but potentially noisier. Bands Multiplier (default: 2.0) : Controls the width of dynamic bands in standard deviations. Higher values create wider bands, reducing false signals but potentially missing some opportunities. Lower values generate more signals but with increased noise. Color Customization : Traders can customize bullish (green) and bearish (red) colors to match their visual preferences or other indicators in their chart setup. The Nova Statistical Filtering Oscillator represents a sophisticated approach to identifying statistical extremes in financial markets. By combining Z-Score normalization with TEMA smoothing and dynamic volatility bands, it provides traders with a powerful tool for detecting potential mean reversion opportunities. Its adaptive nature ensures effectiveness across various market conditions, while the clear visual signals make it accessible to traders of all experience levels. Whether used as a primary trading system or as a confirmation tool alongside other indicators, the NSFO offers a unique perspective on market dynamics that can enhance your trading decisions. Remember to always test any new indicator thoroughly on historical data before using it with real capital, and maintain disciplined risk management practices regardless of the signals generated. This indicator is provided for educational and informational purposes only. Past performance does not guarantee future results. Trading financial markets involves substantial risk, and you should only trade with capital you can afford to lose. Always conduct your own research and consider your financial situation before making any trading decisions. Индикатор Pine Script®от Pineify38
Ultimate MA Angle Matrix (5x5)Have all Moving average to imrpove trade confirmationИндикатор Pine Script®от mahendrabgavali8
NYX08green bar color when market breaks above 13 ,25 and 30 ema red bar color when market breaks below 13 ,25 and 30 ema updated signal has to be above / below EMA200 ,SMA100 AND SMA300 with alerts requested script feel free to make requests Индикатор Pine Script®от Wickedfg887
FX 30m Full-Stack EMA ORDER FLIP (Chart + Scanner)scans 16 pairs on 30 min. alerts on 30 min tema reversal. Индикатор Pine Script®от mwkothmann110
TEMA_1h_1D_1W_1MTEMA_1h_1D_1W_1M (Multi-Timeframe Triple Exponential Moving Average) indicator on TradingView. Title: TEMA Multi-Timeframe (1h/1D/1W/1M) - Low Lag Trend Short Description: Plots TEMA (Triple Exponential Moving Average) from 1h, Daily, Weekly, and Monthly timeframes onto your current chart for instant, low-lag trend context. Detailed Description: Overview The TEMA_1h_1D_1W_1M indicator is a comprehensive, multi-timeframe (MTF) analysis tool designed to visualize the Triple Exponential Moving Average (TEMA) from higher timeframes (HTF) directly on your current trading chart. By using TEMA instead of a standard EMA, this indicator significantly reduces lag, allowing you to identify trend changes faster without sacrificing trend smoothing. Key Features Four Timeframe Integration: Plots TEMA lines for 1-Hour (1h), Daily (1D), Weekly (1W), and Monthly (1M) timeframes. Multi-Timeframe Compatibility: Displays higher timeframe TEMA lines on lower timeframe charts (e.g., 5m, 15m) without "stair-stepping" artifacts. Low Lag, High Smoothness: TEMA provides a more responsive trendline than traditional EMAs, aiding in earlier trend detection. Customizable Lengths: Fully adjustable TEMA lengths for each timeframe (default usually 20, 50, or 200). Visual Clarity: Each timeframe's TEMA can be colored and styled separately to identify trend alignment at a glance. Trading Applications Trend Alignment: Confirm the long-term trend (e.g., Monthly/Weekly TEMA) aligns with the short-term trend (e.g., Hourly TEMA) before entering trades. Dynamic Support/Resistance: Higher timeframe TEMAs act as robust, dynamic support and resistance levels. Breakout Confirmation: Use 1h TEMA to confirm trend reversals, while using 1D/1W TEMA to filter out false signals. Indicator Inputs TEMA Periods: Separately adjustable lengths for 1h, 1D, 1W, and 1M. Styling: Toggle visibility, colors, and line thickness for each timeframe. Disclaimer: Education purpose only. TEMA works best in trending markets and may produce false signals in choppy, ranging markets. Индикатор Pine Script®от pavanjayaram8
Triple EMA// Triple EMA indicator designed for TradingView free users. // Displays 3 standard EMAs in one indicator slot.Индикатор Pine Script®от rendi_surya12
3MA Alignment Ribbon [AlgoTraderPro]3MA Alignment Ribbon is a clean, visual trend-structure indicator based on the alignment of three moving averages. Instead of focusing on crossovers, it highlights trend quality and direction by dynamically coloring the moving averages and the ribbon between them. The goal is simple : See at a glance whether the market structure is bullish, bearish, or neutral. ⸻ How It Works The indicator plots three moving averages (Fast, Medium, Slow) and evaluates their alignment: Bullish → Fast > Medium > Slow Bearish → Fast < Medium < Slow Neutral → Any other configuration The moving averages and the filled ribbon between them are automatically colored based on this alignment, making trend conditions immediately visible. ⸻ Key Features ✅Multi-MA Support Choose between: EMA (default) SMA WMA VWMA RMA HMA ✅ Alignment Modes Strict: classic Fast > Medium > Slow logic Tolerant: requires a minimum percentage separation between averages to reduce noise in ranging markets ✅ Optional Slope Filter Filter signals by requiring the slow MA to be rising or falling, helping avoid false trend states during flat conditions. ✅ Higher Timeframe (HTF) Ribbon Overlay the same 3MA alignment logic from a higher timeframe on your current chart: Fully optional Correctly calculated on the HTF itself Option to use confirmed HTF bars only (reduces repaint confusion) ✅ Alerts & Visual Signals Alerts when alignment turns Bullish, Bearish, or Neutral Optional on-chart markers when the alignment flips ✅ Custom Styling Fully customizable colors and transparency Designed to remain readable without cluttering the chart ⸻ How to Use It This indicator works best as: A trend filter for discretionary trading A context tool for entries using other setups A market structure overlay for scalping, swing trading, or position trading It does not generate buy/sell signals by itself — instead, it helps you trade aligned with market structure. ⸻ Default Settings The default lengths (50 / 100 / 200 EMA) are suitable for most markets and timeframes, including crypto, forex, indices, and equities. Индикатор Pine Script®от algoTraderGTP17
Filtered TEMA CrossoverFiltered Dual TEMA Crossover This indicator is a trend-following tool based on the classic Dual Triple Exponential Moving Average (TEMA) Crossover strategy, enhanced with two robust filters: the Chop Index and the Average Directional Index (ADX). The TEMA is known for its low lag and high responsiveness, making the crossover an effective signal for trend reversals. However, trading TEMA crossovers during sideways, choppy markets often leads to false signals. This is where the filters come in. Key Features ▪️Dual TEMA Crossover: Plots two customizable TEMA lines (Fast and Slow) for clear visualization of the primary trend direction. ▪️Intelligent Signal Filtering: Buy and Sell signals are generated only when the market confirms it is in a trending state, thanks to two integrated filters: ➖Chop Index Filter: Blocks signals when the market is detected as sideways or consolidating (Chop Index reading above a user-defined threshold). ➖ADX Filter: Ensures signals are only taken when the trend strength is sufficient (ADX reading above a user-defined minimum threshold). ▪️Customizable Signals: Full control over the signal shapes (Arrows, Triangles, etc.), colors, text, and size. How to Use It Use the Filtered Dual TEMA Crossover to enter positions on trend continuation or reversal while dramatically reducing exposure to low-quality, whipsawing signals common in non-trending environments. Before the filters: After the filters: Minimize Noise. Maximize Clarity. Trade the Trend.Индикатор Pine Script®от ZAUTECОбновлено 83
3x EMA Strategy (Weekly)Based on certain conditions between multiple Exponential Moving Averages on a weekly timeframe, the chart is highlighted in either red/green.Индикатор Pine Script®от Hermitp9121
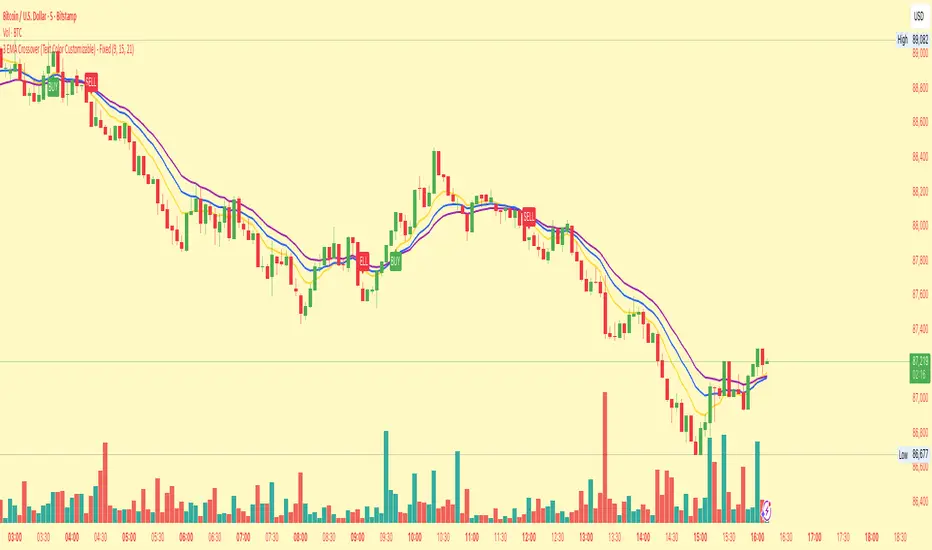
3 EMA Crossover (Text Color Customizable) - Fixed3 Ema crossover 9/15/21 it will generate buy and sell signal on crossover.Индикатор Pine Script®от reyuu1nu19
Force DashboardScalping Dashboard - Complete User Guide Overview This scalping system consists of two complementary TradingView indicators designed for intraday trading with no overnight holds: Force Dashboard - Single-row table showing real-time market bias and entry signals Large Order Detection - Visual diamonds showing institutional order flow Together, they provide a complete at-a-glance view of market conditions optimized for quick entries and exits. Recommended Timeframes Primary Scalping Timeframes 1-minute chart: Ultra-fast scalps (30 seconds - 3 minutes hold time) 2-minute chart: Quick scalps (2-5 minutes hold time) 5-minute chart: Standard scalps (5-15 minutes hold time) Best Practices Use 1-2 minute for highly liquid instruments (ES, NQ, major forex pairs) Use 5-minute for less liquid markets or if you prefer fewer signals Never hold past the last hour of trading to avoid overnight risk Set hard stop times (e.g., exit all positions by 3:45 PM EST) Dashboard Components Explained Core Indicators (Circles ●) MACD (5/13/5) Green ● = Bullish momentum (MACD histogram positive) Red ● = Bearish momentum (MACD histogram negative) Gray ● = No clear momentum Use: Confirms trend direction and momentum shifts EMA (9/20/50) Green ● = Price > EMA9 > EMA20 (uptrend) Red ● = Price < EMA9 < EMA20 (downtrend) Gray ● = Choppy/sideways Use: Identifies the immediate micro-trend Stoch (5-period Stochastic) Green ● = Oversold (<20) - potential reversal up Red ● = Overbought (>80) - potential reversal down Gray ● = Neutral zone (20-80) Use: Spots reversal opportunities at extremes RSI (7-period) Green ● = Oversold (<30) Red ● = Overbought (>70) Gray ● = Neutral Use: Confirms overbought/oversold conditions CVD (Cumulative Volume Delta) Green ● = CVD above its moving average (buying pressure) Red ● = CVD below its moving average (selling pressure) Gray ● = Neutral Use: Shows overall buying vs selling pressure ΔCVD (Delta CVD - Rate of Change) Green ● = CVD accelerating upward (buying acceleration) Red ● = CVD accelerating downward (selling acceleration) Gray ● = No acceleration Use: Detects momentum shifts in order flow Imbal (Order Flow Imbalance) Green ● = Buy pressure >2x sell pressure Red ● = Sell pressure >2x buy pressure Gray ● = Balanced Use: Identifies extreme one-sided order flow Vol (Volume Strength) Green ● = Volume >1.5x average (strong interest) Red ● = Volume <0.7x average (low interest) Gray ● = Normal volume Yellow background = Volume surge (>2x average) - BIG MOVE ALERT Use: Confirms conviction behind price moves Tape (Tape Speed) Green ● = Fast order flow (>1.3x normal) Red ● = Slow order flow (<0.7x normal) Gray ● = Normal speed Yellow background = Very fast tape (>1.5x) - RAPID EXECUTION ALERT Use: Measures urgency and speed of orders Key Levels Support (Supp) Shows the nearest high-volume support level below current price Bright Green background = Price is AT support (within 0.3%) - BOUNCE ZONE Green background = Price above support (healthy) Red background = Price below support (broken support, now resistance) Resistance (Res) Shows the nearest high-volume resistance level above current price Bright Orange background = Price is AT resistance (within 0.3%) - REJECTION ZONE Red background = Price below resistance (facing overhead supply) Green background = Price above resistance (breakout) These levels update automatically every 3 bars based on volume profile Entry Signal Components Score Displays format: "6L" (6 long indicators) or "4S" (4 short indicators) Bright Green = 6-7 indicators aligned for long Light Green = 5 indicators aligned for long Yellow = 4 indicators aligned (weaker setup) Gray = No alignment Red/Orange colors = Same scale for short setups Score of 5+ indicates high-probability setup SCALP (Main Entry Signal) BRIGHT GREEN "LONG" = High-quality long scalp (Score 5+) Green "LONG" = Decent long scalp (Score 4) BRIGHT ORANGE "SHORT" = High-quality short scalp (Score 5+) Red "SHORT" = Decent short scalp (Score 4) Gray "WAIT" = No clear setup - STAY OUT Entry Strategies Strategy 1: High-Probability Scalps (Conservative) When to Enter: SCALP column shows BRIGHT GREEN "LONG" or BRIGHT ORANGE "SHORT" Score is 5 or higher Vol or Tape has yellow background (volume surge) Example Long Setup: SCALP = BRIGHT GREEN "LONG" Score = 6L Vol = Yellow background Price AT Support (bright green Supp cell) EMA, MACD, CVD, ΔCVD, Imbal all green Entry: Enter immediately on next candle Target: 0.5-1% move or resistance level Stop: Below support or -0.3% Hold Time: 2-10 minutes Strategy 2: Momentum Scalps (Aggressive) When to Enter: Tape has yellow background (fast tape) Vol has yellow background (volume surge) ΔCVD is green (for longs) or red (for shorts) Imbal shows strong imbalance in your direction Score is 4+ Example Short Setup: Tape & Vol = Yellow backgrounds ΔCVD = Red, Imbal = Red Price AT Resistance (bright orange) Score = 5S Entry: Enter immediately Target: Quick 0.3-0.7% move Stop: Tight -0.2% Hold Time: 1-5 minutes Strategy 3: Reversal Scalps (Mean Reversion) When to Enter: Stoch shows oversold (green) or overbought (red) RSI confirms the extreme Price is AT Support (for longs) or AT Resistance (for shorts) ΔCVD and Imbal start reversing direction Score is 4+ Example Long Setup: Stoch = Green (oversold) RSI = Green (oversold) Supp = Bright green (at support) ΔCVD turns green Imbal turns green Score = 4L or 5L Entry: Wait for confirmation candle Target: Move back to EMA9 or mid-range Stop: Below the low Hold Time: 3-8 minutes Large Order Detection Usage Diamond Signals Green diamonds below bar = Large buy orders (institutional buying) Red diamonds above bar = Large sell orders (institutional selling) Size matters: Larger diamonds = larger order flow How to Use with Dashboard Confirmation Entries Dashboard shows "LONG" signal Green diamond appears Enter immediately - institutions are buying Divergence Alerts (CAUTION) Dashboard shows "LONG" signal RED diamond appears (institutions selling) DO NOT ENTER - conflicting order flow Cluster Patterns Multiple green diamonds in row = Strong accumulation, stay long Multiple red diamonds in row = Strong distribution, stay short Alternating colors = Chop, avoid trading Risk Management Rules Position Sizing Risk 0.5-1% of account per scalp Maximum 3 concurrent positions Reduce size after 2 consecutive losses Stop Loss Guidelines Tight stops: 0.2-0.3% for 1-2 min charts Standard stops: 0.3-0.5% for 5 min charts Always use stop loss - no exceptions Place stops below support (longs) or above resistance (shorts) Take Profit Targets Target 1: 0.3-0.5% (take 50% off) Target 2: 0.7-1% (take remaining 50%) Move stop to breakeven after Target 1 hit Trail stop if Score remains high Time-Based Exits Exit immediately if: SCALP changes from LONG/SHORT to WAIT Score drops below 3 Large diamond appears in opposite direction Maximum hold time: 15 minutes (even if profitable) Hard exit time: 30 minutes before market close Trading Sessions Best Times to Scalp High-Liquidity Sessions 9:30-11:00 AM EST (Market open, highest volume) 2:00-3:30 PM EST (Afternoon session, good moves) Avoid 11:30 AM-1:30 PM EST (Lunch, low volume) Last 30 minutes (unpredictable, don't initiate new trades) News releases (wait 5 minutes for volatility to settle) Common Patterns & Setups The Perfect Storm (Highest Probability) Score = 6L or 7L SCALP = BRIGHT GREEN Vol + Tape = Yellow backgrounds Green diamond appears Price AT Support Win rate: ~70-80% The Fade Setup (Counter-Trend) Price hits resistance (bright orange) Stoch + RSI overbought (red) Red diamond appears CVD starts turning red SCALP shows "SHORT" Win rate: ~60-70% The Breakout Continuation Price breaks resistance (Res turns green) EMA, MACD green Vol surge (yellow) Multiple green diamonds SCALP = "LONG" Win rate: ~65-75% Warning Signs - DO NOT TRADE Red Flags ❌ SCALP shows "WAIT" ❌ Score below 3 ❌ Vol and Tape both gray (no volume) ❌ Conflicting signals (dashboard says LONG but red diamonds appearing) ❌ Alternating green/red circles (choppy market) ❌ Support and Resistance very close together (tight range) Market Conditions to Avoid Low volume periods Major news releases (first 5 minutes after) First 2 minutes after market open Wide spreads Consecutive losing trades (take a break after 2 losses) Quick Reference Checklist Before Taking ANY Trade: ☑ SCALP shows LONG or SHORT (not WAIT) ☑ Score is 4 or higher ☑ Vol or Tape shows activity ☑ No conflicting diamond signals ☑ Stop loss level identified ☑ Target profit level identified ☑ Not in restricted time periods After Entering: ☑ Set stop loss immediately ☑ Set profit targets ☑ Watch SCALP column - exit if changes to WAIT ☑ Watch for opposite-colored diamonds ☑ Move stop to breakeven after first target ☑ Exit all by market close Advanced Tips Scalping Psychology Be patient: Wait for Score 5+ setups Be decisive: When signal appears, act immediately Be disciplined: Follow your stop loss always Be flexible: Exit quickly if dashboard reverses Optimization Backtest on your specific instrument Adjust RSI/Stoch levels for your market Fine-tune volume thresholds Keep a trade journal to track which setups work best Multi-Timeframe Confirmation Use 5-min dashboard as "trend filter" Take 1-min trades only in direction of 5-min SCALP signal Increases win rate by ~10-15% Troubleshooting Q: Dashboard shows WAIT most of the time Normal - scalping is about patience. Quality > Quantity 3-8 good setups per day is excellent Q: Too many false signals Increase minimum Score requirement to 5 or 6 Only trade with volume surge (yellow backgrounds) Add large order detection confirmation Q: Signals too slow You may be on too high a timeframe Try 1-minute chart for faster signals Ensure real-time data feed is active Q: Support/Resistance not updating Normal - updates every 3 bars If completely stuck, remove and re-add indicator Summary This scalping system works best when: ✅ Multiple indicators align (Score 5+) ✅ Volume and tape speed confirm the move ✅ Order flow (diamonds) confirms direction ✅ Price is at key levels (support/resistance) ✅ You manage risk strictly ✅ You exit before market close The golden rule: When SCALP says WAIT, you WAIT. Discipline beats frequency.Индикатор Pine Script®от jedijamezОбновлено 114
TEWMA Supertrend - [JTCAPITAL]TEWMA Supertrend - is a modified way to use Triple Exponential Weighted Moving Average (TEWMA) combined with ATR-based Supertrend logic for Trend-Following. The idea behind this indicator is to merge the smoothness and responsiveness of TEWMA with the robustness of ATR-based Supertrend volatility filtering. This results in a tool that not only reacts quickly to price changes but also adapts to market volatility, providing reliable trend detection with reduced noise. The indicator works by calculating in the following steps: Source Selection The user can select the price source (default is Close). This price series is the foundation of all calculations, and changing the source allows the indicator to adapt to different analytical perspectives, such as Open, High, Low, or HL2. TEWMA Calculation The script calculates a Weighted Moving Average (WMA) of the selected source, and then applies a Triple Exponential Moving Average (TEMA) smoothing on top of it. The result is what we call TEWMA. This hybrid method achieves two goals simultaneously: -WMA adds sensitivity by giving more weight to recent data. -TEMA reduces lag by combining multiple EMA calculations while keeping smoothness. ATR Volatility Measurement In parallel, the Average True Range (ATR) is calculated over the user-defined Supertrend length . ATR measures volatility and dynamically scales the upper and lower bands to adjust to different market conditions. Upper and Lower Band Construction The indicator builds two envelopes around the TEWMA: - Upper Band = TEWMA + (Multiplier × ATR) - Lower Band = TEWMA – (Multiplier × ATR) These bands expand and contract depending on volatility, creating a dynamic channel. Band Adjustment Logic To prevent false flips, the current upper/lower band values are compared to their previous values. If price has not broken above or below the prior band, the bands “stick” to their previous values, thereby filtering noise and avoiding unnecessary trend changes. Trend Detection -If price closes above the adjusted upper band, the direction is bullish. -If price closes below the adjusted lower band, the direction is bearish. -Otherwise, the trend direction continues from its prior state. The Trend line is then set to either the upper band (bearish) or lower band (bullish). Visual Representation -The TEWMA line itself is plotted and color-coded (blue for bullish, purple for bearish). -The active Supertrend line is plotted depending on trend direction. -Shaded regions are added around the lines for enhanced clarity, visually separating bullish and bearish phases. Buy and Sell Conditions : - Buy Signal : Triggered when price closes above the Supertrend line, confirming a bullish shift. - Sell Signal : Triggered when price closes below the Supertrend line, confirming a bearish shift. Features and Parameters : - TEWMA Source – Select the input price (Close, Open, High, Low, etc.). - TEWMA Length – Defines the lookback for the Weighted MA and subsequent TEMA smoothing. - Supertrend Length – Defines the ATR period used for volatility measurement. - Multiplier – Determines how far the Supertrend bands are placed from the TEWMA. Higher values mean wider bands and fewer trend flips, while lower values mean tighter bands and more frequent signals. Specifications : Weighted Moving Average (WMA) The WMA gives more importance to recent price points while still considering past values. This makes it more responsive to recent moves than a Simple Moving Average (SMA). Triple Exponential Moving Average (TEMA) TEMA reduces lag by combining multiple layers of EMA calculations. Unlike a simple EMA, which can be slow to react, TEMA anticipates changes faster, while still maintaining smoothness to avoid false signals. TEWMA (TEMA of WMA) By applying TEMA on top of WMA, we create a hybrid smoothing technique. This retains the responsiveness of WMA but reduces its lag via TEMA’s structure. The result is a highly adaptive moving average, ideal for fast trend detection. Average True Range (ATR) ATR measures the degree of volatility by looking at the full trading range of each candle. It ensures that the Supertrend bands expand in volatile markets and contract in calm markets, keeping signals relevant to current conditions. Supertrend Bands The upper and lower envelopes built around TEWMA act as dynamic support and resistance. Their adaptive nature reduces false trend shifts during choppy sideways markets. Band Adjustment Logic Instead of recalculating bands every candle, the script uses a memory mechanism (previous values) to prevent unnecessary trend switches. This stabilizes the indicator and avoids excessive noise. Trend Line The final output is a line that follows price in trending phases while holding steady during consolidations. Its placement above or below price clearly signals bullish or bearish market structure. Color Coding and Visuals The use of shaded fills and line coloring enhances readability. Traders can quickly distinguish trend direction and momentum without deep numerical analysis. Enjoy!Индикатор Pine Script®от JTCapitalNL22330
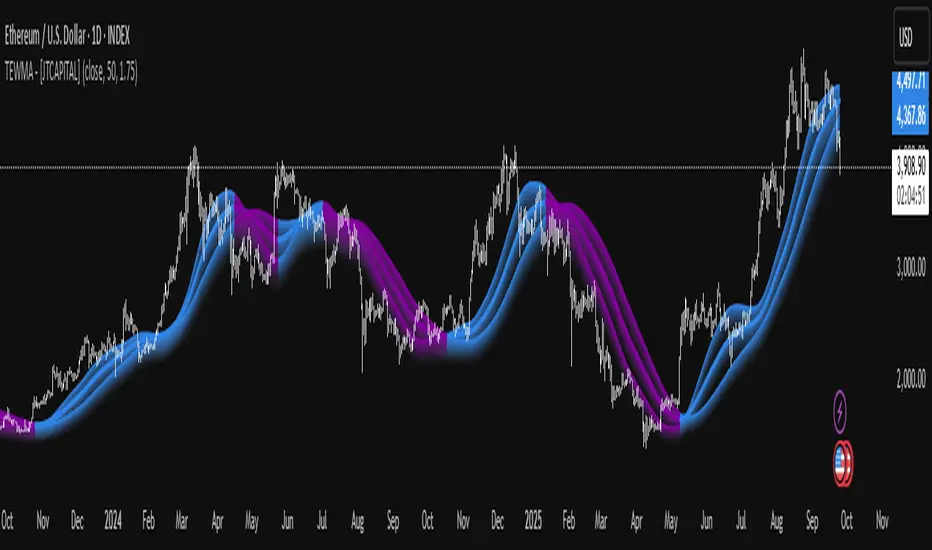
TEWMA - [JTCAPITAL]TEWMA - is a modified way to use Triple Exponential Moving Average (TEMA) combined with Weighted Moving Average (WMA) and adaptive multi-length averaging for Trend-Following. The indicator blends short- and extended-length smoothed signals into a single adaptive line, then assigns directional bias to highlight bullish or bearish phases more clearly. The indicator works by calculating in the following steps: Source Selection The script begins with a selectable price source (default: Close, but can be changed to Open, High, Low, HL2, etc.). This ensures flexibility depending on the user’s preferred market perspective. Dual-Length Calculation A base length ( len ) is chosen, and then multiplied by a factor ( multi , default 1.75). This produces a secondary, longer period ( len2 ) that adapts proportionally to the base. Weighted + Triple Exponential Smoothing -First, a WMA (Weighted Moving Average) is applied to the price source. -Then, the TEMA (Triple Exponential Moving Average) is applied to smooth the WMA even further. -This process is repeated for both len and len2 , producing TEWMA1 and TEWMA2 . Adaptive Averaging The final TEWMA line is calculated as the average of TEWMA1 and TEWMA2, creating a blend between the short-term and extended-term signals. This balances reactivity and stability, reducing lag while avoiding excessive noise. Trend Direction Detection -If TEWMA is greater than its previous value → Bullish . -If TEWMA is lower than its previous value → Bearish . -A Signal variable is used to store this directional bias, ensuring continuity between bars. Visual Plotting -The main TEWMA is plotted with bold coloring (Blue for bullish, Purple for bearish). -TEWMA1 and TEWMA2 are plotted as thinner supporting lines. -Each line is given a shadow-fill (between 100% and 90% of its value) for emphasis and visual clarity. Alerts Custom alerts are defined: - TEWMA Long → when bullish. - TEWMA Short → when bearish. -These alerts can be integrated into TradingView’s alerting system for automated notifications. Buy and Sell Conditions : - Buy : Triggered when TEWMA rises (bullish slope). The indicator colors the line blue and an alert can be fired. - Sell : Triggered when TEWMA declines (bearish slope). The line turns purple, signaling potential short or exit points. Features and Parameters : - Source → Selectable price input (Close, Open, HL2, etc.). - Length (len) → Base period for the WMA/TEMA calculation. - Multiplier (multi) → Scales the secondary length to create a longer-term smoothing. - Color-coded Trend Lines → Blue for bullish, Purple for bearish. - Shadow Fill Effects → Provides depth and easier visualization of trend direction. - Alert Conditions → Prebuilt alerts for both Long and Short scenarios. Specifications : Weighted Moving Average (WMA) The WMA assigns more weight to recent price values, making it more responsive than a Simple Moving Average (SMA). This enhances early detection of market turns while reducing lag compared to longer-term averages. Triple Exponential Moving Average (TEMA) TEMA is designed to minimize lag by combining multiple EMA layers (EMA of EMA of EMA). It is smoother and more adaptive than traditional EMAs, making it ideal for detecting true market direction without overreacting to small fluctuations. Multi-Length Averaging By calculating two versions of WMA → TEMA with different lengths and then averaging them, the indicator balances responsiveness (short-term sensitivity) and reliability (long-term confirmation). This prevents whipsawing while keeping signals timely. Adaptive Signal Assignment Instead of simply flipping signals at crossovers, the indicator checks slope direction of TEWMA. This ensures smoother trend-following behavior, reducing false positives in sideways conditions. Color-Coding & Visual Shading Visual clarity is achieved by coloring bullish periods differently from bearish ones, with shaded fills beneath each line. This allows traders to instantly identify trend conditions and compare short- vs long-term signals. Alert Conditions Trading decisions can be automated by attaching alerts to the TEWMA’s bullish and bearish states. This makes it practical for active trading, swing setups, or algorithmic strategies. Enjoy!Индикатор Pine Script®от JTCapitalNL22224
QTrade Golden, Bronze & Death, Bubonic Cross AlertsThis indicator highlights key EMA regime shifts with simple, color-coded triangles: - Golden / Death Cross — 50 EMA crossing above/below the 200 EMA. - Bronze / Bubonic Cross — 50 EMA crossing above/below the 100 EMA. - Early-Warning Proxy — tiny triangles for the 4 EMA vs. 200 EMA (4↑200 and 4↓200). These often fire before the 50/100 and 50/200 crosses. No text clutter on the chart—just triangles. Colors: gold (50↑200), red (50↓200), darker-yellow bronze (50↑100), burgundy (50↓100), turquoise (4↑200), purple (4↓200). What it tells you (in order of warning → confirmation) - First warning: 4 EMA crosses the 200 EMA (proxy for price shifting around the 200 line). - Second warning: 50 EMA crosses the 100 EMA (Bronze/Bubonic). - Confirmation: 50 EMA crosses the 200 EMA (Golden/Death). Alerts included - Golden Cross (50↑200) and Death Cross (50↓200) - Bronze Cross (50↑100) and Bubonic Cross (50↓100) - 4 EMA vs. 200 EMA crosses (up & down) — early-warning proxy - Price–100 EMA events (touch/cross, if enabled in settings)Индикатор Pine Script®от gbeckettОбновлено 28
Triple-EMA Cloud (3× configurable EMAs + timeframe + fill)About This Script Name: Triple-EMA Cloud (3× configurable EMAs + timeframe + fill) What it does: The script plots three Exponential Moving Averages (EMAs) on your chart. You can set each EMA’s length (how many bars or days it averages over), source (for example, closing price, opening price, or the midpoint of high + low), and timeframe (you can have one EMA use daily data, another hourly data, etc.). The indicator draws a “cloud” or channel by shading the area between the outermost two EMAs of the three. This lets you see a band or zone that the price is moving in, defined by those EMAs. You also get full control over how each of the three EMA‐lines looks: color, thickness, transparency, and plot style (solid line, steps, circles, etc.). How to Use It (for Beginners) Here’s how a trader who’s new to charts can use this tool, especially when looking for pullbacks or undercut price action. Key Concepts Trend: Imagine the market price is generally going up or down. EMAs are a way to smooth out price movements so you can see the trend more clearly. Pullback: When a price has been going up (an uptrend), sometimes it dips down a little before going up again. That dip is the pullback. It’s a chance to enter or add to a position at a “better price.” Undercut: This is when price drops below an important level (for example an EMA) and then comes back up. It looks like it broke below, but then it recovers. That may show reverse pressure or strength building. How the Script Helps With Pullbacks & Undercuts Marking Trend Zones with the Cloud The cloud between the outer EMA lines gives you a zone of expected support/resistance. If the price is above the cloud, that zone can act like a “floor” in uptrends; if it is below, the cloud might act like a “ceiling” in downtrends. Watching Price vs the EMAs If the price pulls back toward the cloud (or toward one of the EMAs) and then bounces back up, that’s a signal that the uptrend might continue. If the price undercuts (goes a bit below) one of the EMAs or the cloud and then returns above it, that can also be a signal. It suggests that even though there was a temporary drop, buyers stepped in. Using the Three EMAs for Confirmation Because the script uses three EMAs, you can see how tightly or loosely they are spaced. If all three EMAs are broadly aligned (for example, in an uptrend: shorter length above longer length, each pulling from reliable price source), that gives more confidence in trend strength. If the middle EMA (or different source/timeframe) is holding up as support while others are above, it strengthens signal. Entry & Exit Points Entry: For example, after a pullback toward the cloud or “mid‐EMA”, wait for price to show a bounce up. That could be a better entry than buying at the top. Stop Loss / Risk: You might place a stop loss just below the cloud or the lowest of your selected EMAs so that if price breaks through, the idea is invalidated. Profit Target: Could be a recent high, resistance level, or a fixed reward-risk multiple (for example aiming to make twice what you risked). Practical Steps for New Traders Set up the EMAs Choose simple lengths like 10, 21, 50. For example, EMA #1 = length 10, source Close, timeframe “current chart”; EMA #2 = length 21, source (H+L)/2; EMA #3 = length 50, maybe timeframe daily. Observe the Price Action When price moves up, then dips, see if it comes back near the shaded cloud or one of the EMAs. See if the dip touches the EMAs lightly (not a big drop) and then price starts climbing again. Look for undercuts If price briefly goes below a line (or below cloud) and then closes back above, that’s undercut + recovery. That bounce back is often meaningful. Manage risk Only put in money you can afford to lose. Use small position size until you get comfortable. Use stop-loss (as mentioned) in case the price doesn’t bounce as expected. Practice Put this indicator on charts (stocks you follow) in past time periods. See how price behaved with pullbacks / undercuts relative to the EMAs & cloud. This helps you learn to see signals. What It Doesn’t Do (and What to Be Careful Of) It doesn’t predict the future — it simply shows zones and trends. Price can still break down through the cloud. In a “choppy” market (i.e. when price is going up and down without a clear trend), signals from EMAs / clouds are less reliable. You’ll get more “false bounces.” Under / overshoots & big news events can break through clean levels, so always watch for confirmation (volume, price behavior) before putting big money in.Индикатор Pine Script®от Blk0ut17
Auto-Length Anchored Multiple EMA (Hour-Based)# Auto-Length Anchored Multiple EMA (Hour-Based) ## Overview This advanced EMA indicator automatically calculates Exponential Moving Average lengths based on the time elapsed since user-defined anchor dates. Unlike traditional fixed-length EMAs, this indicator dynamically adjusts EMA periods based on actual trading hours, making it ideal for event-based analysis and time-sensitive trading strategies. ## Key Features ### 🎯 **Dual Mode Operation** - **Auto Mode**: EMA length automatically calculated from anchor date to current time - **Manual Mode**: Traditional fixed-length EMA calculation - Switch between modes independently for each EMA ### 📊 **Multiple EMA Support** - Up to 4 independent EMAs with individual configurations - Each EMA can have its own anchor date and settings - Individual enable/disable controls for each EMA ### ⏰ **Smart Time Calculation** - Accounts for actual trading hours (customizable) - Weekend exclusion with Saturday trading option (for markets like NSE/BSE) - Hour multiplier for fine-tuning EMA sensitivity - Minimum EMA length protection to prevent calculation errors ### 🎨 **Visual Enhancements** - **Dynamic Fill Colors**: Fill between EMA1 and EMA3 changes color based on price position - **Customizable Colors**: Individual color settings for each EMA - **Anchor Visualization**: Optional vertical lines and labels at anchor dates - **Real-time Table**: Shows current EMA lengths, modes, and values ## Configuration Options ### Trading Session Settings - **Trading Hours Per Day**: Set your market's trading hours (1-24) - **Trading Days Per Week**: Configure for different markets (5 for Mon-Fri, 6 for Mon-Sat) - **Include Saturday**: Enable for markets that trade on Saturday - **Hour Multiplier**: Fine-tune EMA sensitivity (0.1x to 10x) ### EMA Configuration - **Anchor Dates**: Set specific start dates for each EMA calculation - **Manual Lengths**: Override with traditional fixed periods when needed - **Enable/Disable**: Individual control for each EMA - **Color Customization**: Personalize appearance for each EMA ### Visual Options - **Fill Settings**: Toggle and customize fill colors between EMAs - **Anchor Lines**: Show vertical lines at anchor dates - **Anchor Labels**: Display formatted anchor date information - **Length Table**: Real-time display of current EMA parameters ## Use Cases ### 📈 **Event-Based Analysis** - Anchor EMAs to earnings announcements, policy decisions, or market events - Track price behavior relative to specific time periods - Analyze momentum changes from key market catalysts ### 🕐 **Time-Sensitive Trading** - Perfect for intraday strategies where timing is crucial - Automatically adjusts to market hours and trading sessions - Eliminates manual EMA length recalculation ### 🌍 **Multi-Market Support** - Configurable for different global markets - Saturday trading support for Asian markets - Flexible trading hour settings ## Technical Details ### Calculation Method The indicator calculates trading bars elapsed since anchor date using: ``` Total Trading Bars = (Days Since Anchor × Trading Days Per Week ÷ 7) × Trading Hours Per Day × Hour Multiplier ``` ### EMA Formula Uses standard EMA calculation with dynamically calculated alpha: ``` Alpha = 2 ÷ (Current Length + 1) EMA = Alpha × Current Price + (1 - Alpha) × Previous EMA ``` ### Weekend Handling - Automatically excludes weekends from calculation - Optional Saturday inclusion for specific markets - Accurate trading day counting ## Installation & Setup 1. **Add to Chart**: Apply the indicator to your desired timeframe 2. **Set Anchor Dates**: Configure anchor dates for each EMA you want to use 3. **Adjust Trading Hours**: Set your market's trading session parameters 4. **Customize Appearance**: Choose colors and visual options 5. **Enable Features**: Turn on fills, anchor lines, and information table as needed ## Best Practices - **Anchor Selection**: Choose significant market events or technical breakouts as anchor points - **Multiple Timeframes**: Use different anchor dates for short, medium, and long-term analysis - **Hour Multiplier**: Start with 1.0 and adjust based on market volatility and your trading style - **Visual Clarity**: Use contrasting colors for different EMAs to improve readability ## Compatibility - **Pine Script Version**: v6 - **Chart Types**: All chart types supported - **Timeframes**: Works on all timeframes (optimal on intraday charts) - **Markets**: Suitable for stocks, forex, crypto, and commodities ## Notes - Indicator starts calculation from the anchor date forward - Minimum EMA length prevents calculation errors with very recent anchor dates - Table display updates in real-time showing current EMA parameters - Fill colors dynamically change based on price position relative to EMA1 --- *This indicator is perfect for traders who want to combine the power of EMAs with event-driven analysis and precise time-based calculations.*Индикатор Pine Script®от shivkumar50324416
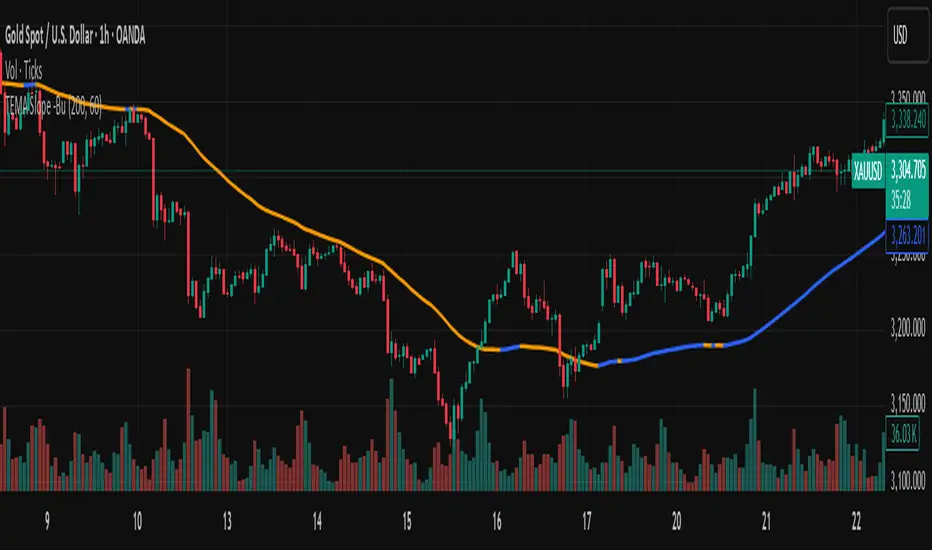
TEMA with Slope Color [MrBuCha]This TEMA indicator is particularly useful for trend following strategies. The key innovation here is using a higher timeframe (default 1-hour) to get a broader perspective on the trend direction, while the color-coding makes it immediately obvious whether the momentum is bullish (blue) or bearish (orange). The 200-period length makes this more suitable for swing trading rather than day trading, as it filters out short-term noise and focuses on significant trend movements. // What is TEMA and How Does It Work? TEMA (Triple Exponential Moving Average) is a technical indicator that builds upon the standard EMA to reduce lag and provide faster response to price changes. The calculation process is: EMA1 = EMA of closing price with specified length EMA2 = EMA of EMA1 with the same length EMA3 = EMA of EMA2 with the same length TEMA = 3 × (EMA1 - EMA2) + EMA3 This formula helps reduce the lag inherent in smoothing calculations, making TEMA more responsive to price movements compared to other moving averages. Default Values Length: 200 periods Timeframe: "60" (1 hour) Slope Colors Blue: When TEMA is trending upward (tema_current > tema_previous) Orange: When TEMA is trending downward (tema_current ≤ tema_previous) Pros and Cons Summary Advantages: Fast Response: Reduces lag better than SMA and regular EMA Easy to Use: Color-coded slope makes trend direction immediately visible Multi-timeframe Capability: Can display TEMA from higher timeframes Trend Following: Excellent for identifying trend direction Visual Clarity: Clear color signals help with quick decision making Disadvantages: False Signals: Prone to whipsaws in sideways/choppy markets Noise in Volatility: Frequent color changes during high volatility periods Not Suitable for Scalping: Length of 200 is quite long for short-term trading Still Lagging: Despite improvements, it remains a lagging indicator Requires Confirmation: Should be used with other indicators for better accuracy Best Use Cases: Medium to long-term trend following Identifying major trend changes Multi-timeframe analysis Combine with momentum oscillators for confirmation Trading Tips: Wait for color confirmation before entering trades Use higher timeframe TEMA for overall trend bias Combine with support/resistance levels Avoid trading during consolidation periodsИндикатор Pine Script®от mrbucha27
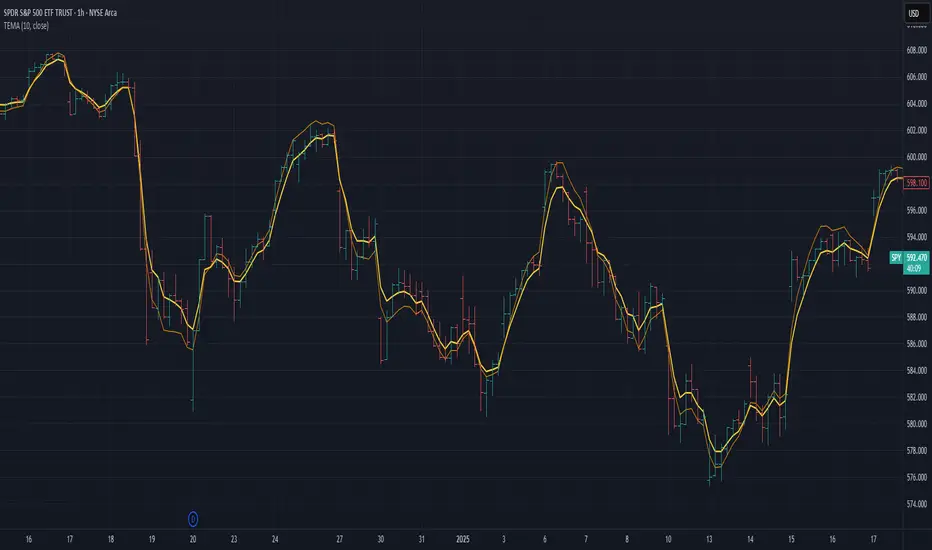
Triple Exponential Moving Average (TEMA)The Triple Exponential Moving Average (TEMA) is an advanced technical indicator designed to significantly reduce the lag inherent in traditional moving averages while maintaining signal quality. Developed by Patrick Mulloy in 1994 as an extension of his DEMA concept, TEMA employs a sophisticated triple-stage calculation process to provide exceptionally responsive market signals. TEMA's mathematical approach goes beyond standard smoothing techniques by using a triple-cascade architecture with optimized coefficients. This makes it particularly valuable for traders who need earlier identification of trend changes without sacrificing reliability. Since its introduction, TEMA has become a key component in many algorithmic trading systems and professional trading platforms. ▶️ **Core Concepts** Triple-stage lag reduction: TEMA uses a three-level EMA calculation with optimized coefficients (3, -3, 1) to dramatically minimize the delay in signal generation Enhanced responsiveness: Provides significantly faster reaction to price changes than standard EMA or even DEMA, while maintaining reasonable smoothness Strategic signal processing: Employs mathematical techniques to extract the underlying trend while filtering random price fluctuations Timeframe effectiveness: Performs well across multiple timeframes, though particularly valued in short to medium-term trading TEMA achieves its enhanced responsiveness through an innovative triple-cascade architecture that strategically combines three levels of exponential moving averages. This approach effectively removes the lag component inherent in EMA calculations while preserving the essential smoothing benefits. ▶️ **Common Settings and Parameters** Length: Default: 12 | Controls sensitivity/smoothness | When to Adjust: Increase in choppy markets, decrease in strongly trending markets Source: Default: Close | Data point used for calculation | When to Adjust: Change to HL2/HLC3 for more balanced price representation Corrected: Default: false | Adjusts internal EMA smoothing factors for potentially faster response | When to Adjust: Set to true for a modified TEMA that may react quicker to price changes. false uses standard TEMA calculation Visualization: Default: Line | Display format on charts | When to Adjust: Use filled cloud to see divergence from price more clearly Pro Tip: For optimal trade signals, many professional traders use two TEMAs (e.g., 8 and 21 periods) and look for crossovers, which often provide earlier signals than traditional moving average pairs. ▶️ **Calculation and Mathematical Foundation** Simplified explanation: TEMA calculates three levels of EMAs, then combines them using a special formula that amplifies recent price action while reducing lag. This triple-processing approach effectively eliminates much of the delay found in traditional moving averages. Technical formula: TEMA = 3 × EMA₁ - 3 × EMA₂ + EMA₃ Where: EMA₁ = EMA(source, α₁) EMA₂ = EMA(EMA₁, α₂) EMA₃ = EMA(EMA₂, α₃) The smoothing factors (α₁, α₂, α₃) are determined as follows: Let α_base = 2/(length + 1) α₁ = α_base If corrected is false: α₂ = α_base α₃ = α_base If corrected is true: Let r = (1/α_base)^(1/3) α₂ = α_base * r α₃ = α_base * r * r = α_base * r² The corrected = true option implements a variation that uses progressively smaller alpha values for the subsequent EMA calculations. This approach aims to optimize the filter's frequency response and phase lag. Alpha Calculation for corrected = true: α₁ (alpha_base) = 2/(length + 1) r = (1/α₁)^(1/3) (cube root relationship) α₂ = α₁ * r = α₁^(2/3) α₃ = α₂ * r = α₁^(1/3) Mathematical Rationale for Corrected Alphas: 1. Frequency Response Balance: The standard TEMA (where α₁ = α₂ = α₃) can lead to an uneven frequency response, potentially over-smoothing high frequencies or creating resonance artifacts. The geometric progression of alphas (α₁ > α₁^(2/3) > α₁^(1/3)) in the corrected version aims to create a more balanced filter cascade. Each stage contributes more proportionally to the overall frequency response. 2. Phase Lag Optimization: The cube root relationship between the alphas is designed to minimize cumulative phase lag while maintaining smoothing effectiveness. Each subsequent EMA stage has a progressively smaller impact on phase distortion. 3. Mathematical Stability: The geometric progression (α₁, α₁^(2/3), α₁^(1/3)) can enhance numerical stability due to constant ratios between consecutive alphas. This helps prevent the accumulation of rounding errors and maintains consistent convergence properties. Practical Impact of corrected = true: This modification aims to achieve: Potentially better lag reduction for a similar level of smoothing A more uniform frequency response across different market cycles Reduced overshoot or undershoot in trending conditions Improved signal-to-noise ratio preservation Essentially, the cube root relationship in the corrected TEMA attempts to optimize the trade-off between responsiveness and smoothness that can be a challenge with uniform alpha values. 🔍 Technical Note: Advanced implementations apply compensation techniques to all three EMA stages, ensuring TEMA values are valid from the first bar without requiring a warm-up period. This compensation corrects initialization bias and prevents calculation errors from compounding through the cascade. ▶️ **Interpretation Details** TEMA excels at identifying trend changes significantly earlier than traditional moving averages, making it valuable for both entry and exit signals: When price crosses above TEMA, it often signals the beginning of an uptrend When price crosses below TEMA, it often signals the beginning of a downtrend The slope of TEMA provides insight into trend strength and momentum TEMA crossovers with price tend to occur earlier than with standard EMAs When multiple-period TEMAs cross each other, they confirm significant trend shifts TEMA works exceptionally well as a dynamic support/resistance level in trending markets For optimal results, traders often use TEMA in combination with momentum indicators or volume analysis to confirm signals and reduce false positives. ▶️ **Limitations and Considerations** Market conditions: The high responsiveness can generate false signals during highly choppy, sideways markets Overshooting: More aggressive lag reduction leads to more pronounced overshooting during sharp reversals Parameter sensitivity: Changes in length have more dramatic effects than in simpler moving averages Calculation complexity: Triple cascaded EMAs make behavior less predictable and more resource-intensive Complementary tools: Should be used with confirmation tools like RSI, MACD or volume indicators ▶️ **References** Mulloy, P. (1994). "Smoothing Data with Less Lag," Technical Analysis of Stocks & Commodities . Mulloy, P. (1995). "Comparing Digital Filters," Technical Analysis of Stocks & Commodities .Индикатор Pine Script®от mihakralj36
[SM-042] EMA 5-8-13 with ADX FilterWhat is the strategy? The strategy combines three exponential moving averages (EMAs) — 5, 8, and 13 periods — with an optional ADX (Average Directional Index) filter. It is designed to enter long or short positions based on EMA crossovers and to exit positions when the price crosses a specific EMA. The ADX filter, if enabled, adds a condition that only allows trades when the ADX value is above a certain threshold, indicating trend strength. Who is it for? This strategy is for traders leveraging EMAs and trend strength indicators to make trade decisions. It can be used by anyone looking for a simple trend-following strategy, with the flexibility to adjust for trend strength using the ADX filter. When is it used? - **Long trades**: When the 5-period EMA crosses above the 8-period EMA, with an optional ADX condition (if enabled) that requires the ADX value to be above a specified threshold. - **Short trades**: When the 5-period EMA crosses below the 8-period EMA, with the ADX filter again optional. - **Exits**: The strategy exits a long position when the price falls below the 13-period EMA and exits a short position when the price rises above the 13-period EMA. Where is it applied? This strategy is applied on a chart with any asset on TradingView, with the EMAs and ADX plotted for visual reference. The strategy uses `strategy.entry` to open positions and `strategy.close` to close them based on the set conditions. Why is it useful? This strategy helps traders identify trending conditions and filter out potential false signals by using both EMAs (to capture short-term price movements) and the ADX (to confirm the strength of the trend). The ADX filter can be turned off if not desired, making the strategy flexible for both trending and range-bound markets. How does it work? - **EMA Crossover**: The strategy enters a long position when the 5-period EMA crosses above the 8-period EMA, and enters a short position when the 5-period EMA crosses below the 8-period EMA. - **ADX Filter**: If enabled, the strategy checks whether the ADX value is above a set threshold (default is 20) before allowing a trade. - **Exit Conditions**: Long positions are closed when the price falls below the 13-period EMA, and short positions are closed when the price rises above the 13-period EMA. - **Plotting**: The strategy plots the three EMAs and the ADX value on the chart for visualization. It also displays a horizontal line at the ADX threshold. This setup allows for clear decision-making based on the interaction between different time-frame EMAs and trend strength as indicated by ADX.Стратегия Pine Script®от sebamarghella39
Triple EMA + Volume/Price SignalsOverview This script merges three exponential moving averages (EMA) with adaptive volume thresholds to identify high-confidence trends. Unlike basic volume indicators, it triggers signals only when volume exceeds both a user-defined absolute value (e.g., 500k) and a percentage increase (e.g., 5%) – reducing noise in volatile markets. Key Features Triple EMA System: Short (9), Medium (21), and Long (50) EMAs for trend direction. Bullish Signal: Short EMA > Medium EMA > Long EMA. Bearish Signal: Short EMA < Medium EMA < Long EMA. Dual-Threshold Volume Confirmation: Absolute Volume: Highlight bars where volume exceeds X (e.g., 500,000). Percentage Increase: Highlight bars where volume rises by Y% (e.g., 5%) vs. prior bar. Users can enable/disable either threshold. Customizable Alerts: Trigger alerts only when both EMA alignment and volume conditions are met. How It Works Trend + Volume Synergy: A bullish EMA crossover alone might be a false breakout. This script requires additional volume confirmation (e.g., 500k volume + 5% spike) to validate the move. Flexibility: Adjust thresholds for different assets: Stocks: Higher absolute volume (e.g., 1M shares). Crypto: Smaller absolute volume but larger % spikes (e.g., 10%). Usage Examples Swing Trading: Set EMA lengths to 20/50/200 and volume thresholds to 500k + 5% on daily charts. Scalping: Use 5/13/21 EMAs with 100k volume + 3% spikes on 5-minute charts.Индикатор Pine Script®от rizemepsОбновлено 51
Dynamic Time Zone EMA with Candle Trend AnalysisCandleTrend TZ is a powerful analytical tool that integrates time zones, exponential moving averages (EMA), and custom candle coloring based on trend direction. This indicator is ideal for traders looking to analyze market trends within specific time sessions effectively. Key Features: Time Zones: Divides the chart into four distinct time intervals, each highlighted with a unique background color. Fully customizable start and end times for each interval, allowing for adaptation to various trading schedules. Exponential Moving Averages (EMA): Displays three EMAs with user-defined lengths: EMA 200 (blue) for long-term trends. EMA 50 (green) for medium-term trends. EMA 20 (red) for short-term trends. Helps identify trend direction and strength. Custom Candle Coloring: Utilizes smoothed Heiken Ashi and Triple EMA (TEMA) calculations for enhanced candle coloring: Green candles indicate an upward trend. Red candles signal a downward trend. Filters out market noise, providing a clear visual representation of market dynamics. Customization Options: Time Zones: Adjustable start and end times for each of the four sessions: Input hour and minute for start and end times (e.g., Interval 1 Start/End Hour/Minute). Background colors are pre-defined but can be modified in the code. EMAs: User-defined lengths for each EMA: EMA 200 Length (default: 200) EMA 50 Length (default: 50) EMA 20 Length (default: 20) TEMA Settings: Parameters for trend smoothing: TEMA Length (default: 55) EMA Length (default: 60) Use Cases: Intraday Session Analysis: Use time zones to differentiate between morning, afternoon, and evening market activity. The background colors make it easy to track session-specific trends. Trend Trading: Analyze EMA crossings and their slopes to confirm market direction. Green candles indicate buying opportunities, while red candles highlight selling signals. Noise Reduction: TEMA smoothing removes market noise, allowing you to focus on the primary market trend. Adaptation to Custom Strategies: By adjusting time intervals, you can tailor the indicator to specific trading styles or market conditions. Benefits: Versatility for both trending and sideways markets. Intuitive and user-friendly setup. Suitable for traders of all skill levels, from beginners to professionals. CandleTrend TZ is an indispensable tool for understanding market dynamics, enhancing your trading precision, and making well-informed decisions. 🚀Индикатор Pine Script®от shevtsov36031
Gauti Market Maker Killzone EMA1. Identifying the Trend Use Daily (1D) and Hourly (1H) Exponential Moving Averages (EMAs) to define the overall trend: Bullish Trend: Both 1D and 1H EMAs are upward sloping, and the price is above these EMAs. Bearish Trend: Both 1D and 1H EMAs are downward sloping, and the price is below these EMAs. 2. Confirmation with Higher Timeframes Bullish Conditions: Check 1D and 4H charts for price action above the EMA bands. Look for price forming higher highs and higher lows or respecting support at the EMA bands. Bearish Conditions: Check 1D and 4H charts for price action below the EMA bands. Look for price forming lower highs and lower lows or respecting resistance at the EMA bands. Note: Crossover of EMAs on higher timeframes is an optional extra confirmation, but not mandatory for entry. 3. Entry Strategy Use the 15-Minute (15M) timeframe for entries. Entries are taken only during Killzones: Killzones: London Open, New York Open, or other intraday key trading sessions. (Define the time ranges for these zones based on your trading hours.) Wait for the price to touch or pull back to the EMA band during the Killzones in the direction of the overall trend: In a bullish trend, enter long when the price touches the EMA band and shows signs of rejection or reversal. In a bearish trend, enter short when the price touches the EMA band and shows signs of rejection or reversal. 4. Checklist for Entry Confirm the following before entering: 1D Trend aligns with the 1H Trend. Price Action in 1D and 4H supports the trend. Killzone session is active. Price is reacting to the EMA band on the 15M chart in the trend direction.Индикатор Pine Script®от SmartRiskTrader53