SPY 200SMA +4% Entry -3% Exit TQQQ/QLD/GLDM THREE PHASE STRATEGYWanted to take a look at all of the individual trades and provide a series of options to balance performance and risk. This post is expanding on my previous one - www.reddit.com
Here is the data and the backtesting splitting the strategy into three primary phases with multiple options and exact trade dates to help people easily backtest other combinations - docs.google.com (Three Tabs with the three phases)
If you just want my personal recommendations this would be what I will be using -
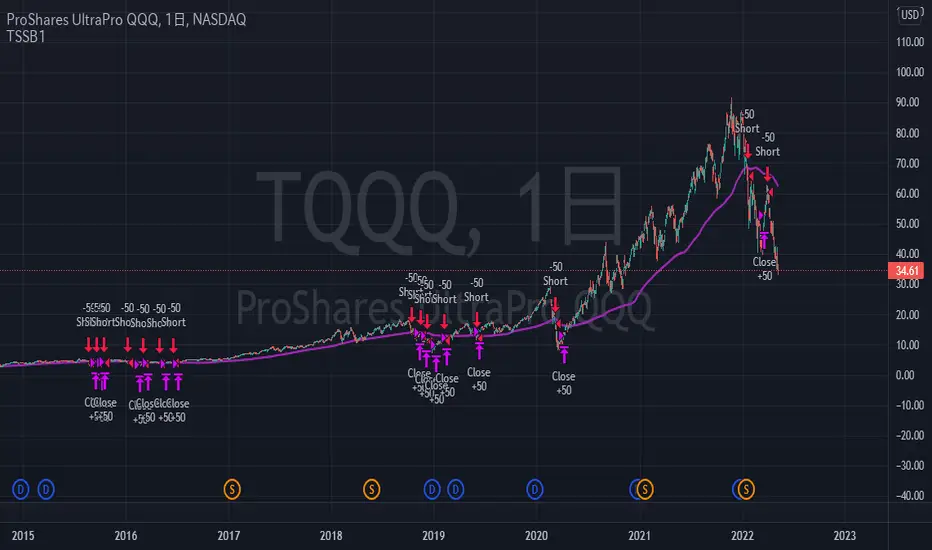
PHASE 1 (Strategy BUY signal triggers when SPY price crosses +4% over the SPY 200SMA) = 100% TQQQ
If trade lasts 366 days (Long Term Cap Gains) go to PHASE 2
If SPY price crosses below -3% SPY 200SMA go to PHASE 3
PHASE 2 (PHASE 1 lasts 366 days) = Deleverage and diversify into 50% QLD & 50% GLDM
PHASE 3 (Strategy SELL signal triggers when SPY price crosses -3% below the SPY 200SMA) = Defensive posture with 50% SGOV & 50% GLDM
As market degrades start selling SGOV and buying QQQ until 50% QQQ & 50% GLDM
TradingView Script for the THREE PHASE STRATEGY (imgur.com):
//
@version=
5
strategy("SPY 200SMA +4% Entry -3% Exit Strategy",
overlay=true,
default_qty_type=strategy.percent_of_equity,
default_qty_value=100)
// === Inputs ===
smaLength = input.int(200, title="SMA Period", minval=1)
entryThreshold = input.float(0.04, title="Entry Threshold (%)", step=0.01)
exitThreshold = input.float(0.03, title="Exit Threshold (%)", step=0.01)
startYear = input.int(1995, "Start Year")
startMonth = input.int(1, "Start Month")
startDay = input.int(1, "Start Day")
// === Time filter ===
startTime = timestamp(startYear, startMonth, startDay, 0, 0)
isAfterStart = time >= startTime
// === Calculations ===
sma200 = ta.sma(close, smaLength)
upperThreshold = sma200 * (1 + entryThreshold)
lowerThreshold = sma200 * (1 - exitThreshold)
// === Strategy Logic ===
enterLong = close > upperThreshold
exitLong = close < lowerThreshold
if isAfterStart
if enterLong and strategy.position_size == 0
strategy.entry("Buy", strategy.long)
if exitLong and strategy.position_size > 0
strategy.close("Buy")
// === 366-Day Marker Logic (Uninterrupted) ===
var
int
targetTime = na
// 1. Capture entry time only when a brand new position starts
if strategy.position_size > 0 and strategy.position_size == 0
targetTime := time + (366 * 24 * 60 * 60 * 1000)
// 2. IMPORTANT: If position is closed or a sell signal hits, reset the timer to "na"
if strategy.position_size == 0
targetTime := na
// 3. Trigger only if we are still in the trade and hit the timestamp
isAnniversary = not na(targetTime) and time >= targetTime and time < targetTime
// === Visuals ===
p_sma = plot(sma200, title="200 SMA", color=color.rgb(255, 0, 242))
p_upper = plot(upperThreshold, title="Entry Threshold (+4%)", color=color.rgb(0, 200, 0))
p_lower = plot(lowerThreshold, title="Exit Threshold (-3%)", color=color.rgb(255, 0, 0))
fill(p_sma, p_upper, color=color.new(color.green, 80), title="Entry Zone")
// Draw marker only if 366 days passed without a sell
if isAnniversary
label.new(bar_index, high, "366 DAYS - PHASE 2", style=label.style_label_down, color=color.yellow, textcolor=color.black, size=size.small)
// === Entry/Exit Labels ===
newOpen = strategy.position_size > 0 and strategy.position_size == 0
newClose = strategy.position_size == 0 and strategy.position_size > 0
if newOpen
label.new(x=bar_index, y=low * 0.97, text="BUY - PHASE 1", xloc=xloc.bar_index, yloc=yloc.price, color=color.lime, style=label.style_label_up, textcolor=color.black, size=size.small)
if newClose
label.new(x=bar_index, y=high * 1.03, text="SELL - PHASE 3", xloc=xloc.bar_index, yloc=yloc.price, color=color.red, style=label.style_label_down, textcolor=color.white, size=size.small)
200 SMA SPY Trading Range Bands Script:
//
@version=
5
indicator("200 SMA SPY Trading Range Bands", overlay=true)
// === Settings ===
smaLength = input.int(200, title="SMA Length")
mult1 = input.float(1.09, title="Multiplier 1 (9% Over)")
mult2 = input.float(1.15, title="Multiplier 2 (15% Over)")
// === Calculations ===
smaValue = ta.sma(close, smaLength)
line9Over = smaValue * mult1
line15Over = smaValue * mult2
// === Plotting ===
plot(smaValue, title="200 SMA", color=color.gray, linewidth=1, style=plot.style_linebr)
plot(line9Over, title="9% Over 200 SMA", color=color.rgb(255, 145, 0), linewidth=1)
plot(line15Over, title="15% Over 200 SMA", color=color.rgb(38, 1, 1), linewidth=2)
Стратегия Pine Script®