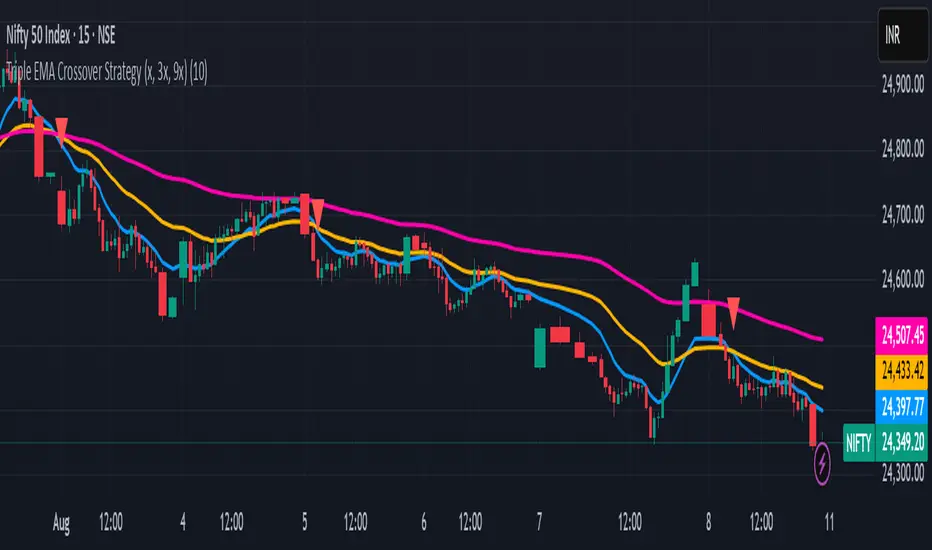
1 Triple EMA Crossover Strategy (x, 3x, 9x)An excellent EMA strategy.
x, 3x, and 9x: These represent the periods of the EMAs. For example, if 'x' is 10, then you would have a 10-day EMA, a 30-day EMA, and a 90-day EMA.
Crossover: The strategy relies on identifying when the price or the shorter-term EMAs cross above or below the longer-term EMAs, signaling potential buy or sell opportunities.
How the Strategy Works:
1. Trend Identification:
The relationship between the three EMAs indicates the overall trend. If the 3x EMA is above the 9x EMA, and the x EMA is above both, it suggests an uptrend. Conversely, if the 3x EMA is below the 9x EMA, and the x EMA is below both, it indicates a downtrend.
2. Buy Signals:
A buy signal might be generated when the shortest EMA (x) crosses above the medium EMA (3x) and then both cross above the longest EMA (9x), suggesting a potential breakout.
3. Sell Signals:
A sell signal might be generated when the shortest EMA (x) crosses below the medium EMA (3x) and then both cross below the longest EMA (9x), suggesting a potential breakdown.
---------------------------------------------------------------------------------------------------------
Unlocking Trends with the Triple EMA Crossover Strategy (x, 3x, 9x)
Welcome to an intuitive yet powerful trend-following strategy designed for clarity and actionable signals: the Triple EMA Crossover. This Pine Script® indicator leverages the Exponential Moving Average (EMA) to help traders identify prevailing trends, potential breakouts, and breakdowns with enhanced precision. Built on a simple, scalable 'x, 3x, 9x' methodology, it provides a dynamic framework for navigating market movements.
Understanding the x, 3x, 9x EMA Foundation
At its core, this strategy utilizes three Exponential Moving Averages, each acting as a distinct lens on price action. Unlike Simple Moving Averages (SMAs) which give equal weight to all data points, EMAs place a greater emphasis on recent prices, making them more responsive to current market conditions—a crucial advantage in fast-paced environments like intraday trading.
The "x, 3x, 9x" nomenclature is elegantly simple:
x EMA (Fast EMA): This is your shortest-period EMA, highly sensitive to immediate price changes. It acts as the leading indicator, quickly reacting to shifts in momentum.
3x EMA (Medium EMA): Calculated with three times the 'x' period, this EMA provides a smoother, yet still responsive, view of the short-to-medium term trend. It often acts as dynamic support or resistance.
9x EMA (Slow EMA): Representing nine times the 'x' period, this is your longest EMA. It filters out much of the market noise, giving you a clear picture of the underlying dominant trend.
The beauty of this setup lies in its adaptability. By simply adjusting the Base EMA Period (x) input in the script settings, you can automatically calibrate all three EMAs to suit different instruments, volatility levels, or even your preferred trading style. A common starting point for 'x' in intraday trading on a 5-minute chart is 10, which translates to 10, 30, and 90-period EMAs.
How the Strategy Works: Signals and Trend Identification
The power of the Triple EMA Crossover lies in the interplay and alignment of these three moving averages.
1. Trend Identification
The relative positioning of the EMAs paints a clear picture of the market's trend:
Uptrend (Bullish): When the emaX (fast) is above the ema3X (medium), and the ema3X is, in turn, above the ema9X (slow), it indicates a strong bullish trend. This "stacked" alignment suggests robust upward momentum.
Downtrend (Bearish): Conversely, if the emaX (fast) is below the ema3X (medium), and the ema3X is below the ema9X (slow), it signals a clear bearish trend.
2. Buy Signals 🟢
A buy signal is generated when the swift emaX crosses above the ema3X, AND simultaneously, the ema3X is already above the ema9X. This combined condition ensures that the shorter-term momentum is shifting upward while the underlying medium-term trend remains strong and aligned with the longer-term direction. This reduces false signals often seen with simple two-EMA crossovers, aiming to capture high-probability upward moves. The script will plot a green upward-pointing triangle below the candle to visually alert you to this entry.
3. Sell Signals 🔴
A sell signal occurs when the quick emaX crosses below the ema3X, AND the ema3X is already below the ema9X. This indicates that the short-term momentum is shifting downwards, confirming a bearish bias within the broader downtrend. This comprehensive confirmation helps identify potential breakdowns and exit points for long positions or entry points for short trades. A red downward-pointing triangle will appear above the candle to mark this signal.
The strategy also includes an intuitive exit mechanism: if a buy signal is active and a sell condition is met, the long position will be closed, and vice-versa for short positions. This ensures you're always aligned with the most recent confirmed trend direction.
Key Advantages for Traders
Clarity: Provides visually clear trend direction and momentum shifts.
Responsiveness: EMAs react faster to price changes compared to SMAs, making them ideal for dynamic markets.
Confirmation: The three-EMA alignment significantly reduces false signals, leading to higher-conviction trades.
Adaptability: The x input allows you to fine-tune the strategy for various assets and market conditions.
Simplicity: Despite its effectiveness, the logic remains straightforward and easy to understand.
Important Considerations for Day Trading
For optimal performance in intraday trading, it's highly recommended to apply this strategy on a 5-minute chart. This timeframe strikes the perfect balance between capturing rapid price action and filtering out excessive market noise, allowing the EMA crossovers to provide meaningful signals. Always combine this technical analysis with sound risk management, including stop-loss orders, and consider other indicators or fundamental analysis for further confirmation.
Customization and Disclaimer
Feel free to experiment with the Base EMA Period (x) input to find the optimal settings that resonate with your trading style and the specific instruments you trade. Remember, no single strategy guarantees profits, and past performance is not indicative of future results. This script is provided for educational and illustrative purposes. Always conduct your own research and risk assessment before trading with real capital. Happy Trading!
Трендовый анализ
POCTraderX Pro— Structure & Precision Algorithm POCTraderX Pro is a market analysis system designed to accurately identify key interest zones and price turning points. It combines advanced Price Action reading with a dynamic filtering process that adapts signals according to market volatility and internal structure.
Methodology
The algorithm analyzes the sequence of relevant highs and lows (HH, HL, LL, LH) along with the price location in relation to Point of Control levels and consolidation ranges.
It uses multi–timeframe confirmations to filter out false breakouts and optimize trade entries.
In high–volatility conditions, it automatically adjusts validation levels to maintain a favorable risk/reward ratio.
Configuration
Recommended timeframes: from 1–minute to daily, depending on the trading style.
Applicable markets: indices, forex, commodities, and cryptocurrencies.
Adjustable parameters:
Structure detection sensitivity.
Enable/disable volatility filters.
Show/hide control zones and previous ranges.
Purpose
Provide a clear reading of market structure and critical zones to help traders execute trades with greater consistency and avoid entries in low–probability areas.
Important Notes
This script is closed–source to protect its internal methodology, but it is based on an original combination of structural analysis and zone validation not available in free indicators.
It does not produce automatic buy or sell signals without context; it is intended to be integrated into a complete trading strategy.
4H RSI + EMA (Fib optional) with 3:1 R:R + Hybrid ExitAs above.
RSI + 50 EMA & 200MA
3:1 R:R
Exit based on RSI extreme or 200MA Opposition or 3:1 R:R

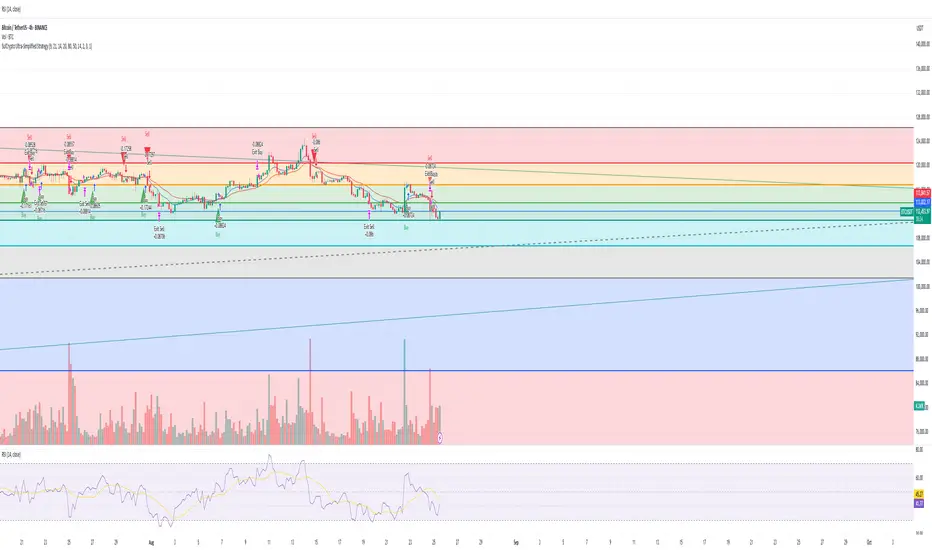
SulCryptoversity_4H_BuySell_CryptoIndicatorThis strategy is designed specifically for the 4-hour timeframe on trading charts. It works primarily for Bitcoin (BTC) but can also be applied to other high-market-cap cryptocurrencies such as Ethereum (ETH), Solana (SOL), Ripple (XRP), Sui (SUI), and even various other coins.
Please note that this is not financial advice—trading involves significant risk, and you should only proceed at your own discretion. We are not liable for any losses incurred from following these signals.
This strategy may be more effective in leverage trading to maximize gains, but leverage trading is highly risky and only recommended for highly skilled traders, as you could lose all your money. For regular purposes, use spot trading.
To use it effectively, focus on the "Buy" and "Sell" signals for your entry and exit points. While an "Exit Buy" signal may appear, rely solely on the main Buy and Sell indicators for decision-making.
-SulCryptoversity aka yo4Q
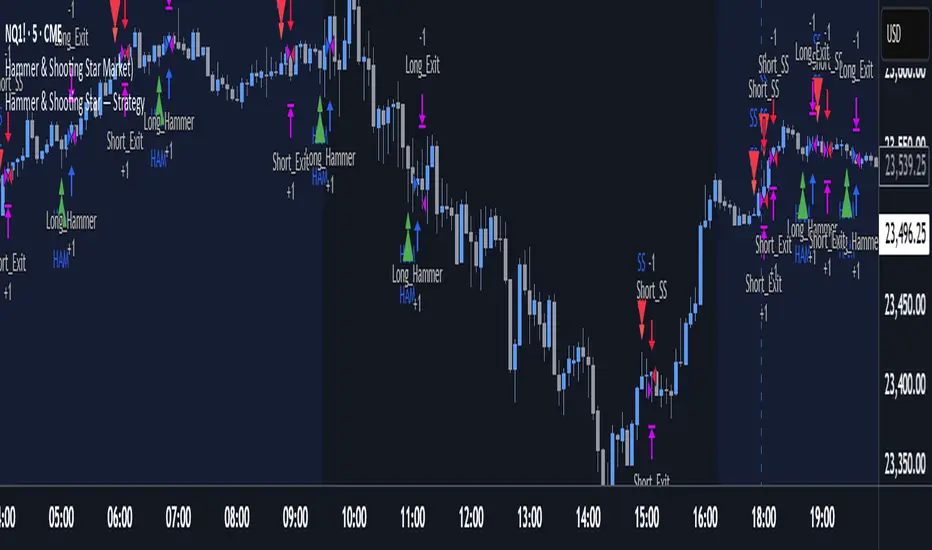
Hammer & Shooting Star — StrategyHammer & Shooting Star Strategy for Intraday Trading
This strategy identifies two candlestick patterns commonly used in technical analysis:
Hammer Candles (a bullish reversal signal):
A hammer candle has a small body at the top with a long lower wick. The strategy goes long on the next bar open when a hammer is detected, with a stop loss at the low of the hammer bar and a target at the high.
Shooting Star Candles (a bearish reversal signal):
A shooting star candle has a small body at the bottom with a long upper wick. The strategy goes short on the next bar open when a shooting star is detected, with a stop loss at the high of the shooting star bar and a target at the low.
RSI-Adaptive T3 [ChartPrime] — Strategy (Long Only, 1D)This trade has been successfully converted from an individual setup to a full strategy, and the results are truly outstanding. I’m currently testing this for Tesla options trading on the 1-day chart, and it appears to be working extremely well.
A special thanks to ChartPrime for creating such a beautifully designed indicator — it’s performing impressively in these tests.
If anyone would like to try it out, feel free to download and see the results for yourself. Thank you!

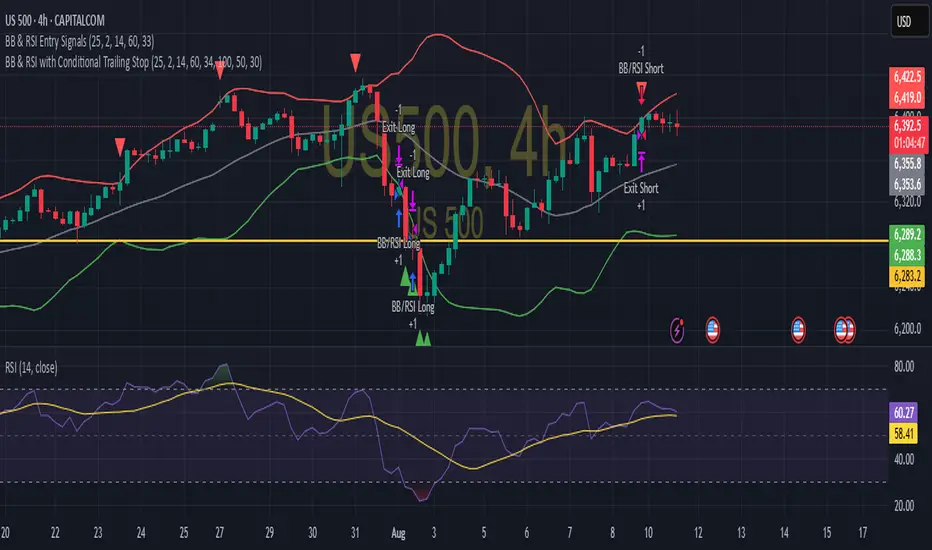
BB & RSI Trailing Stop StrategySimple BB & RSI generated using AI, gets 60% on S&P 500 with the right settings
Gemini Trend Following SystemStrategy Description: The Gemini Trend Following System
Core Philosophy
This is a long-term trend-following system designed for a position trader or a patient swing trader, not a day trader. The fundamental goal is to capture the majority of a stock's major, multi-month or even multi-year uptrend.
The core principle is: "Buy weakness in a confirmed uptrend, and sell only when the uptrend's structure is fundamentally broken."
It operates on the belief that it's more profitable to ride a durable trend than to chase short-term breakouts or worry about daily price fluctuations. It prioritizes staying in a winning trade over frequent trading.
The Three Pillars of the Strategy
The script's logic is built on three distinct pillars, processed in order:
1. The Regime Filter: "Is This Stock in a Healthy Uptrend?"
Before even considering a trade, the script acts as a strict gatekeeper. It will only "watch" a stock if it meets all the criteria of a healthy, long-term uptrend. This is the most important part of the strategy as it filters out weak or speculative stocks.
A stock passes this filter if:
The 50-day Simple Moving Average (SMA) is above the 200-day SMA. This is the classic definition of a "Golden Cross" state, indicating the medium-term trend is stronger than the long-term trend—a hallmark of a bull market for the stock.
The stock's performance over the last year is positive. The Rate of Change (ROC) must be above a minimum threshold (e.g., 15%). This ensures we are only looking at stocks that have already demonstrated significant strength.
The 200-day SMA itself is rising. This is a crucial check to ensure the very foundation of the trend is solid and not flattening out or beginning to decline.
If a stock doesn't meet these conditions, the script ignores it completely.
2. The Entry Trigger: "When to Buy the Dip"
Once a stock is confirmed to be in a healthy uptrend, the script does not buy immediately. Instead, it patiently waits for a point of lower risk and higher potential reward—a pullback.
The entry trigger is a specific, two-step sequence:
The stock price first dips and closes below its 50-day SMA. This signifies a period of temporary weakness or profit-taking.
The price then recovers and closes back above the 50-day SMA within a short period (10 bars).
This sequence is a powerful signal. It suggests that institutional buyers view the 50-day SMA as a key support level and have stepped in to defend it, overpowering the sellers. The entry occurs at this point of confirmed support, marking the likely resumption of the uptrend. On the chart, this event is highlighted with a teal background.
3. The Exit Strategy: "When is the Trend Over?"
The exit logic is designed to keep you in the trade as long as possible and only sell when the trend's character has fundamentally changed. It uses a dual-exit system:
Primary Exit (Trend Failure): The main reason to sell is a "Death Cross"—when the 50-day SMA crosses below the 200-day SMA. This is a robust, albeit lagging, signal that the long-term uptrend is over and a bearish market structure is taking hold. This exit condition is designed to ignore normal market corrections and only trigger when the underlying trend has truly broken. On the chart, this is highlighted with a maroon background.
Safety-Net Exit (Catastrophic Stop-Loss): To protect against a sudden market crash or a company-specific disaster, a "safety-net" stop-loss is placed at the time of entry. This stop is set far below the entry price, typically underneath the 200-day SMA. It is a "just-in-case" measure that should only be triggered in a severe and rapid decline, protecting your capital from an unexpected black swan event.
Who is This Strategy For?
Position Traders: Investors who are comfortable holding a stock for many months to over a year.
Patient Swing Traders: Traders who want to capture large price swings over weeks and months, not days.
Investors using a Rules-Based Approach: Anyone looking to apply a disciplined, non-emotional system to their long-term portfolio.
Ideal Market Conditions
This strategy excels in markets with clear, durable trends. It performs best on strong, leading stocks during a sustained bull market. It will underperform significantly or generate losses in choppy, sideways, or range-bound markets, where the moving averages will frequently cross back and forth, leading to "whipsaw" trades.

SMC Breaker+Liquidity + HTF EMA — v61️⃣ Core Idea
This is a Smart Money Concept (SMC)
It looks for liquidity sweeps followed by price moving back in the opposite direction (breaker block behavior), while trading only in the direction of the higher timeframe (HTF) trend.
2️⃣ Components
A. Higher Timeframe EMA Bias
We take an EMA (default length: 50) from a higher timeframe (default: 4H).
If price is above that EMA → bias is bullish (we only take longs).
If price is below that EMA → bias is bearish (we only take shorts).
This keeps trades aligned with the bigger picture trend
B. Liquidity Sweep Detection
We find the highest high and lowest low over the past 5 bars
A sweep high happens when:
Price breaks above a recent high (liquidity grab), but
Closes back below it (false breakout).
A sweep low happens when:
Price breaks below a recent low, but
Closes back above it.
This indicates stop hunting — whales often trigger these before reversing price.
C. Breaker Block Logic
If a sweep low occurs and bias is bullish → BUY.
If a sweep high occurs and bias is bearish → SELL.
D. Optional ADX Filter
ADX checks market strength (trendiness).
If enabled, it only trades when ADX > threshold (default 20).
This avoids ranging/choppy markets.
3️⃣ Risk Management
Stop Loss (SL):
For longs → ATR(14) below the entry candle low.
For shorts → ATR(14) above the entry candle high.
Take Profit (TP):
SL distance × Risk:Reward ratio (default 3:1).
This means every win can be 3x bigger than a loss.

SY_Quant_AI_YJ✅ English Description (Safe Minimal Version)
SY_Quant_AI_YJ— Multi-Factor Trend Analysis Toolkit
This indicator combines trend detection, structure recognition, and visual overlays to assist traders in analyzing market dynamics.
It integrates common techniques in a simplified form for research and chart-based strategy development.
[DrIntensiveCare17] Zero-Lag ScalpingThe Zero-Lag Scalping strategy is a short-term trading system designed for high-precision entries based on the relationship between a Zero-Lag Moving Average (ZLMA) and a standard Exponential Moving Average (EMA). It incorporates lateral market filtering, risk management with stop loss (SL) and take profit (TP), breakeven logic, visual trade markers, and a performance statistics table.
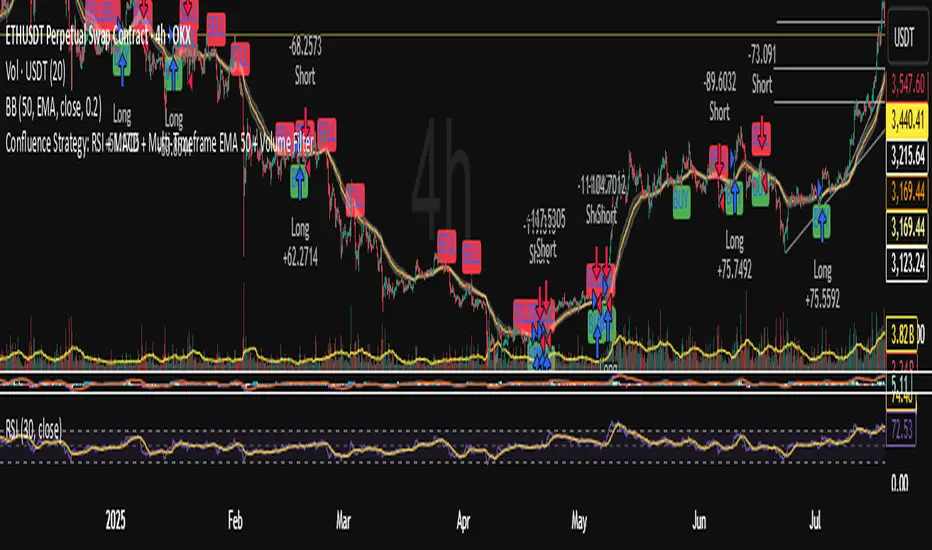
Intraday set up - RSI +MACDIntraday setup using RSI + MACD + Multi-Timeframe EMA 50 + Volume as confluence
MACD Alt Peaks & Valleys + SL + BB V6MACD Alt Peaks & Valleys + SL + BB
This strategy uses a custom MACD peak and valley confirmation system to identify high-probability trade signals. It dynamically manages entries, stop losses, and exits with the help of Bollinger Bands to adapt to changing market volatility.
The Barking Rat ReversionsMean Reversion with Multi-Layered Precision
The Barking Rat Reversions is a short-term mean reversion strategy tailored for high-volatility markets. It combines several well-established technical tools in a configuration to identify overextended price movements likely to revert toward equilibrium. The goal is to isolate high-quality, short-term reversal opportunities while filtering out low-conviction setups.
At its core, our strategy triggers off Fair Value Gaps (FVGs) that occur a considerable distance away from a dynamically defined equilibrium band. It then validates these gaps by checking proximity to recent support and resistance drawn from swing extremes.
Additional confirmation comes from momentum filters and wick-rejection patterns, ensuring each entry aligns with both price structure and stretched momentum. Exits use volatility-adjusted profit targets. Keeping the approach disciplined and adaptive.
🧠Core Logic: Selectivity & Structure
This strategy is intentionally very selective. We have designed it to filter out roughly 95% of all market noise, highlighting only setups that pass multiple validation layers outlined below.
Fair Value Gaps (FVGs) as the Primary Trigger
FVGs identify imbalance zones where price historically retraces. These inefficient zones often become magnets for reversion as the market seeks to rebalance.
Dynamic Equilibrium Band + S/R
Defines a fair value zone with a long-term moving average and combines it with shorter-term swing pivots to establish support/resistance. Only FVGs that occur outside the band and near recent pivots are considered, ensuring reversals are sufficiently distanced and not taken too close to the mean.
Proximity to Support/Resistance
Setup validity depends on location. The strategy filters for FVGs near well-defined structural levels — areas where price has previously turned (i.e., recent swing highs or lows). This increases the likelihood that reversals are occurring at legitimate zones of confluence.
Wick-Rejection Confirmation
Confirms potential exhaustion through characteristic candle wick patterns beyond the equilibrium region. This acts as another filter to improve signal accuracy.
Sequential Filtered Signals
Custom logic ensures that a new signal in any direction must improve upon the previous one, preventing repetitive or suboptimal entries.
Multi-Step Confirmation
All validation layers must coincide on the same bar before a signal triggers, dramatically reducing false positives.
📈Chart Visuals: Designed for Clarity
To ensure transparency and easy interpretation, the script overlays intuitive visuals:
Green “▲” below a candle: Indicates a potential long entry
Red “▼” above a candle: Indicates a potential short entry
Green “✔️”: Marks exit from a trade when ATR target is met
Background shading (green/red): Indicates trade direction while active
Support/Resistance lines: Auto-plotted from recent swing levels
🔔Alerts: Stay Notified Without Watching
The strategy supports real-time alerts on candle close, ensuring that signals are only triggered once fully confirmed.
You must manually set up alerts within your TradingView account. Once configured, you’ll be able to set up one alert per instrument. This one alert covers all relevant signals and exits — ideal for hands-free monitoring.
⚙️Strategy report properties
Position size: 25% equity per trade
Initial capital: 10,000.00 USDT
Pyramiding: 10 entries per direction
Slippage: 2 ticks
Commission: 0.055% per side
Backtest timeframe: 1-minute
Backtest instrument: HYPEUSDT
Backtesting range: Jul 21, 2025 — Aug 7, 2025
Note on Sample Size:
You’ll notice the report displays fewer than the ideal 100 trades in the strategy report above. This is intentional. The goal of the script is to isolate high-quality, short-term reversal opportunities while filtering out low-conviction setups. This means that the Barking Rat Reversions strategy is ultra-selective, filtering out over 95% of market noise by enforcing multiple validation layers. The brief timeframe shown in the strategy report here illustrates its filtering logic over a short window — not its full capabilities. As a result, even on lower timeframes like the 1-minute chart, signals are deliberately sparse — each one must pass all criteria before triggering.
We conducted a broader backtest covering the period from December 5, 2024 to July 31, 2025, during which the strategy identified 968 high-probability setups on the same instrument and timeframe as the strategy report.
For a larger dataset:
Once the strategy is applied to your chart, users are encouraged to expand the lookback range or apply the strategy to other volatile pairs to view a full sample.
💡Why 25% Equity Per Trade?
While it's always best to size positions based on personal risk tolerance, we defaulted to 25% equity per trade in the backtesting data — and here’s why:
Backtests using this sizing show manageable drawdowns even under volatile periods
The strategy generates a sizeable number of trades, reducing reliance on a single outcome
Combined with conservative filters, the 25% setting offers a balance between aggression and control
Users are strongly encouraged to customize this to suit their risk profile.
🔍What Makes This Strategy Unique?
Multi-factor confirmation using FVGs, EMA deviation, RSI, wick rejection, and S/R
Clean, Intuitive Chart Experience
Real-time alerts triggered only on confirmation
Variables monitor prior reversal points, guaranteeing each new signal offers an improved entry
Tracks active positions and resets filters upon exit.

Strategy Designer
**Strategy Designer**
This script is a highly modular, multi-indicator strategy framework that allows users to enable or disable a wide range of signals for precision trading control. Key components include:
* **AlphaTrend**: A dynamic trailing filter built using ATR volatility combined with directional input from RSI or MFI. It helps define bullish or bearish regimes more responsively than fixed moving averages.
* **Inverse Fisher Transformed Indicators**: The script normalizes and transforms traditional oscillators (CCI, RSI, Stochastic, MFI) using the inverse Fisher transform. This boosts signal clarity by compressing values between -1 and +1, making crossovers and trend thresholds more defined.
* **Composite Indicators**: RSI + MFI and CCI + Stoch are averaged to produce smoother, noise-reduced momentum signals. These are ideal for filtering or confirming entries across multiple timeframes or asset types.
* **Volatility & Trend Filters**:
* **ATR Trend Filter**: Confirms trades only when short-term ATR exceeds its smoothed average, indicating rising volatility or breakout conditions.
* **ADX Filter**: Includes two types of filters—ADX vs its MA and ADX vs threshold—to ensure trade entries only happen during clear trend strength.
* **Moving Averages**: Multiple MA types (SMA, EMA, HMA, WMA, DEMA, TEMA, T3, VWMA) are available for crossover and trend conditions. The structure supports general trend, long-trend, and short-trend configurations independently.
* **Volume Filter**: An optional condition to confirm that volume exceeds a moving average, helping avoid trades in low-liquidity periods.
---
**Exit Logic & Risk Management**
This strategy offers powerful and flexible exit controls to suit various risk profiles:
* **Fixed TP/SL**: You can activate classic percentage-based take profit and stop loss levels.
* **ATR-Based Floating Stop**: Dynamically calculates trailing stops based on recent volatility using a smoothed ATR, offering better adaptability in trending environments.
* **Signal-Based Exits**: Includes the ability to exit trades when the original entry conditions reverse (e.g. AlphaTrend flips, Fisher crosses back, MA cross reverses, etc.).
* **Modular Exit Triggers**: Each indicator (CCI, RSI, MFI, Stoch, AlphaTrend, Composite Indicators) can independently trigger an exit based on reversal signals or loss of trend strength.
* **Multi-Layered Protection**: Combine multiple exits (e.g. ATR + AlphaTrend + RSI reversal) to minimize drawdowns and prevent false breakouts.
---
This tool is designed for advanced traders and strategy developers who want granular control over both entries and exits. Every module is toggleable, allowing for endless backtest scenarios and tailored setups to match different market conditions or asset classes. Whether you're trend-following or counter-trading reversals, this strategy adapts.

VWAP-RSI Scalper FINAL v1Description
This script implements a robust, battle-tested intraday scalping strategy designed for prop firm challenges, funded trader programs, and serious futures scalpers.
It combines VWAP, RSI, EMA trend, and ATR-based risk management to capture high-probability mean reversion and momentum moves during the most liquid hours of the trading day.
Core Logic
RSI (Relative Strength Index):
Trades are triggered when the RSI is either oversold or overbought using a short lookback (default: 3). This ensures only the strongest intraday reversals or exhaustion moves are considered.
VWAP Filter:
Longs are only taken above VWAP, shorts only below VWAP, aligning trades with the session’s dominant bias.
EMA Filter:
Additional trend quality filter—longs require price above EMA, shorts below EMA.
Session Control:
Only trades between user-defined session hours (default: US cash session), eliminating overnight/illiquid action.
ATR-based Dynamic Stops & Targets:
Every trade uses a stop loss at 1x ATR and a take profit at 2x ATR for a positive risk/reward ratio.
Max Trades Per Day:
Prevents overtrading and controls risk exposure (default: 3).
Performance (Sample Backtest)
Profit Factor: 1.37+ (prop-firm quality)
Drawdown: <1% (very conservative risk)
Win Rate: 37–48% (RR > 1, so high edge)
Consistency: Smooth, steady equity curve over hundreds of trades.
Best For:
ES/NQ/CL/GC intraday traders
Prop firm evaluation challenges (Tradeify, Topstep, Apex, etc.)
Anyone needing robust, no-nonsense systematic edge for futures or indices.
How to Use & Tune
Apply to 3min, 5min, or 15min charts of liquid futures or indices.
Change parameters in the settings panel to suit your asset, volatility, or session hours.
Use “Strategy Tester” to validate P&L, win rate, and drawdown.
How to Optimize
Raise/lower RSI length or bands to make signals more/less frequent.
Adjust stop/target multiples for your preferred risk/reward profile.
Change session hours to match your broker or market.
Disclaimer
This is not financial advice. Use on a demo or sim account first. Results will vary by market, slippage, and execution speed. Past performance does not guarantee future results.
If you find this useful, please give it a like, follow for more strategies, and comment your results or questions!
Good luck and safe trading!

Parabolic SAR with Early Buy & MA-Based Exit Strategy📝 Strategy Description (Max SEO Impact)
This advanced Parabolic SAR-based trading strategy is designed to capture early trend reversals and exit intelligently using a dynamic moving average filter. It enters long trades when a PSAR reversal occurs, and exits only when the PSAR moves above price and the price falls below the 11-period SMA, helping avoid premature exits during volatile swings.
📌 Features:
• Custom Parabolic SAR calculation for refined trend tracking
• Background highlights during buy zones (SAR below price)
• Exit signals only when trend weakens (PSAR above + price under SMA)
• Red flag plotted on chart at exit bars for clear visual identification
• Works on all timeframes and instruments
Ideal for swing traders, trend followers, and strategy testers looking for smart PSAR-based entries with smoother exits.

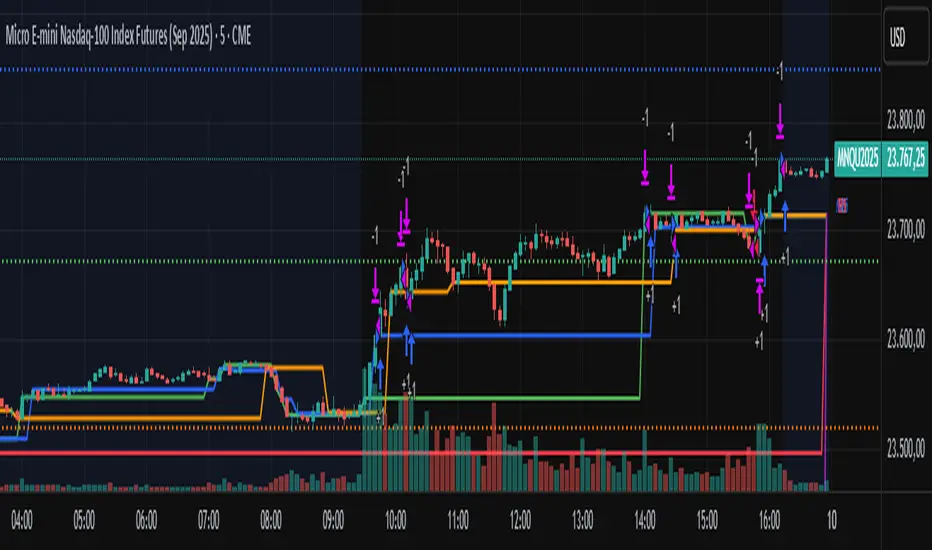
AM Range Sniper [jmaxxx]AM Range Sniper
Overview
AM Range Sniper is a sophisticated morning session trading strategy designed for Micro E-mini Nasdaq-100 Index Futures (MNQ). This strategy capitalizes on the critical 8:30-9:30 AM EST range formation period, implementing precise entry and exit mechanics with advanced risk management.
Key Features
🕐 Time-Based Range Analysis
Range Definition: Automatically identifies and tracks the 8:30-9:30 AM EST range
Trading Window: Active trading from 9:30 AM to 11:00 AM EST (extended for second chance trades)
Session Management: Daily reset ensures clean state for each trading session
🎯 Multiple Entry Patterns
Breakthrough/Retest: Captures price breakthroughs above range with retest opportunities
Long/Short Opportunities: Comprehensive coverage of both directional moves
Breakdown: Identifies bearish breakdowns below range support
Break Up: Detects bullish breakups above range resistance
Range Sweeps: Monitors for range high/low sweeps with reversal entries
⚡ Advanced Risk Management
Configurable Stop Losses: Tick-based stop losses for each trade type
Take Profit Targets: Automatic target calculations based on range size
Hard Close Protection: Automatic position closure at 4 PM EST
Second Chance Feature: Optional second trade opportunity if first trade loses
🔧 Professional Features
Visual Stop Loss Lines: Real-time stop loss visualization on chart
Debug Information Panel: Comprehensive status monitoring
Alert Integration: Customizable alert messages for entries/exits
Flexible Time Settings: Adjustable for different timezones
Strategy Logic
Range Formation (8:30-9:30 AM)
The strategy monitors the first hour of trading to establish the day's range. This range serves as the foundation for all subsequent trading decisions.
Entry Conditions
Breakthrough: Price breaks above range high with retest rejection
Breakdown: Price breaks below range low with confirmed bearish momentum
Break Up: Price breaks above range high with strong bullish confirmation
Sweep Entries: Range high/low sweeps followed by reversal signals
Risk Management
Stop Loss: Configurable tick-based stops for each trade type
Take Profit: 1.5x range size targets for breakdown/breakup trades
Position Sizing: Percentage-based position sizing
Session Limits: Maximum 2 trades per session (with second chance feature)
Settings & Customization
Core Parameters
Enable/disable individual entry patterns
Configurable stop loss levels (1-500 ticks)
Second chance feature toggle
Previous day level integration
Visual Customization
Customizable stop loss colors and widths
Debug panel visibility
Range line styling
Alert Configuration
Custom entry/exit alert messages
***** Automate With *****
APEX
NinjaTrader
Crosstrade.io ( promo code JMAXXX )
Performance & Reliability
Precision Focused: Waits for high-probability setups
Risk-Aware: Comprehensive stop loss and position management
Session-Based: Clean daily resets prevent carryover issues
Professional Grade: Designed for serious traders
Ideal For
Day Traders: Morning session specialists
Futures Traders: MNQ and similar instruments
Range Traders: Traders who capitalize on range breakouts
Risk-Conscious Traders: Those who prioritize risk management
Disclaimer
This strategy is for educational and informational purposes. Past performance does not guarantee future results. Always test thoroughly on historical data and paper trading before live implementation. Risk management is crucial - never risk more than you can afford to lose.
Created by jmaxxx - Professional trading strategy developer
For questions, feedback, or customization requests, please leave a comment below.

Medico Action Zone self adjust TF version 2to create buy sell signal with adjusted EMA and timeframe

NADY 45M ADX-RSI StrategyADX-RSI Scalping Strategy for Gold (XAUUSD) – Pine Script v5
This script is a powerful scalping & swing trading strategy that combines the strength of ADX (Average Directional Index) and RSI (Relative Strength Index), along with a Moving Average trend filter, designed specifically for XAUUSD (Gold/USD) but can be adapted to other assets.
Core Logic:
🔹 Trend Strength Filter (ADX):
Trades are allowed only when ADX > 20, ensuring signals occur during strong trends.
Custom-coded ADX calculation for precision (no lagging built-in functions).
🔹 RSI Overbought/Oversold Signals:
Buy when RSI is deeply oversold (<20).
Sell when RSI is overbought (>85).
Exit conditions are also governed by RSI reversals (RSI > 75 for closing longs, RSI < 25 for closing shorts).
🔹 Trend Confirmation with Moving Average (MA):
A 300-period SMA ensures only trades in the direction of the larger trend.
Avoids false signals during sideways markets.
🔹 Risk Filters:
No overtrading: Trades are allowed only when all three conditions (ADX, RSI, MA) align.
Session visual filter (background color highlights signal bars).
Features Included:
✅ Precise ADX Calculation
✅ Configurable RSI & MA lengths
✅ Clean Buy/Sell Entry & Exit logic
✅ Alerts Ready (Webhook-compatible for bots)
✅ Visuals: MA line, background highlights, ADX Threshold line.
Best Timeframes:
45M
Recommended Pairing:
XAUUSD (Gold/USD)
Works well with trending assets, can adapt to Forex Majors with slight tweaks.
Customization Parameters:
MA Length (default 300)
RSI Length (default 2)
ADX Length (default 14)
ADX Threshold (default 20)
Backtest Insights:
High accuracy during strong trends.
Works best during London & US sessions.
Filters out sideways, low-volatility zones effectively.

LeBlanc Strategy 2 -Inverted Fair Value Gap with Trend & 2.5 RRRThis is for recognizing the closed Inverted Fair Value Gaps (IFVG) to know when to enter a trade.
Detects true inverted FVGs only if the gap size is 3+ ticks.
Filters trades based on EMA50 vs SMA20 trend direction.
Uses ATR-based stop loss, and sets take-profit at a 2.5 risk-to-reward ratio.
Is fully backtestable in TradingView Strategy Tester.
Plots green/red boxes for FVGs.

Dynamic DCA Envelope – Beta V1.1Dynamic DCA Envelope-Beta V1.1 is a preview version of a Dollar-Cost Averaging (DCA) strategy designed for trending or volatile markets.
-Long Positions Only
-Intended for Cryptocurrency, but can be used in any market
-1 and 4 hour timeframe
-Average Commissions 0.1%-0.3% per trade (Cryptocurrency)
What it does:
This strategy identifies buying opportunities when price closes below a dynamic envelope (based on EMA). After 3 consecutive closes below the lower envelope, the system arms a buy condition. A DCA buy-in is triggered when price bounces by a configurable percentage from the trailing low. The strategy supports up to 3 buy-ins, each equally sized, and closes the entire position at a fixed take profit or stop loss.
How it works:
-Entry logic is based on price deviation from an EMA envelope
-Waits for 3 closes below the envelope to detect weakness
-Uses bounce percentage from the lowest point to trigger each buy
-Includes cooldown logic between buys to avoid clustering
-All positions are closed when TP or SL is hit
How to use it:
-Use on trending assets with volatility (e.g., crypto, tech stocks)
-Adjust inputs to match asset behavior:
-EMA Length
-Envelope Offset %
-Bounce % (Trailing DCA)
-Take Profit / Stop Loss
-View strategy performance in the Strategy Tester tab
What’s unique:
Unlike most DCA scripts that immediately average down, this version includes:
-Trigger logic requiring multiple closes below trend
-Bounce-based entry to avoid catching a falling knife
-Cooldown resets to prevent overtrading
-A true entry–wait–buy–reset loop mimicking disciplined execution
*This is a beta version intended as a preview. A full Pro version is in development, which includes:
-SmartScaling logic
-Trailing take profit
-Multi-symbol scanning
-Backtest range limits
-Risk-adjusted filtering

SuperTrend Strategy with Trend-Based Exits🟩 SuperTrend Strategy with Trend-Based Exits
This is a fully automated trend-following strategy based on the popular SuperTrend indicator, enhanced with a position sizing algorithm tied to stop-loss distance and dynamic entry/exit rules. The strategy is designed for futures trading with an emphasis on sustainable risk, realistic backtesting, and transparent logic.
🧠 Concept and Methodology
The strategy uses the SuperTrend indicator, which is derived from ATR (Average True Range) and is widely used to capture medium- to long-term market trends.
Key features:
✅ Entries are triggered only when the SuperTrend direction changes (trend reversal).
✅ Exits are performed using a dynamic stop-loss placed at the SuperTrend line.
✅ Position size is automatically calculated based on the trader’s fixed dollar risk per trade and the current distance to the stop-loss.
✅ Rounding logic is included to ensure quantity is valid for the exchange’s lot size.
This strategy does not use any take-profit or classic trailing stop — the position is only closed when the trend reverses or the stop is hit by touching the SuperTrend line.
⚙️ Default Parameters
ATR Length: 300
Factor: 7.5
Risk per trade: $90 (3% of the default $3,000 capital)
Lot step: 10
Commission: 0.05%
These default parameters are not universal. They were optimized specifically for STXUSDT swap at 15M timeframe at Bybit and may not produce viable results on other pairs and timeframes.
Users are encouraged to customize the settings according to specific asset’s volatility, timeframe and other characteristics.
❗ These default settings yield meaningful backtesting results on STXUSDT with a reasonable number of trades (105+) over 7-month period. If applied to other assets, results may vary significantly.
📈 Position Sizing Logic
The strategy uses a dynamic position sizing formula:
Pine Script®
position_size = floor((risk_per_trade / stop_loss_distance) / lot_step) * lot_step
This ensures the trader always risks a fixed dollar amount per trade and never exceeds a sustainable equity exposure (recommended 2% or less).
✅ Realism in Backtesting
To ensure realistic and non-misleading backtest results, this strategy includes:
— Slippage and commission settings matching average exchange conditions (commission = 0.05%, slippage 5 ticks).
— Position sizing based on stop-loss distance (not fixed contract quantity).*
— A fixed risk-per-trade model that adheres to responsible capital management principles.
— This is in compliance with TradingView's Script publishing rules and House Rules.
📌 How to Use
Apply the strategy to a clean chart (preferably 15M for STXUSDT by default).
If using another asset, adjust:
- ATR Length
- Factor
- Risk per trade
- Qty step (lot precision for the symbol)
Avoid using with other indicators unless you understand their purpose.
Use the Strategy Tester to evaluate performance and optimize parameters.
⚠️ Disclaimer
This is not financial advice. Always perform forward testing and assess risk before deploying any strategy on live capital. The strategy is designed for educational and experimental use.
