Miela Labs | John Dee's Watchtower [257-463]Bridging the gap between 16th-century esoteric mathematics and modern algorithmic trading.
The Enochian Watchtower is not merely a trend indicator; it is a computational artifact developed by Miela Labs LLC. This script translates Dr. John Dee’s "Great Table of the Watchtowers" and the "Sigil Dei Aemeth" into actionable financial data points.
Using our proprietary Occultator V2.0 Engine, we have derived specific mathematical constants that resonate with the current market structure.
🏛️ The Algorithmic Logic
This indicator utilizes three sacred numbers to construct a "Future Vision" of the market:
1. The Axis Mundi (Vector 257): derived from Fermat Primes and John Dee’s Grid coordinates. This Weighted Moving Average (WMA) acts as the spinal cord of the trend.
2. The Gates (Cipher 463): A prime number derived from the "Galethog" cipher stride. These bands define the absolute volatility limits (Heaven & Earth Gates).
3. Future Vision (Offset 21): Utilizing Fibonacci time sequences, the indicator projects Support and Resistance levels 21 bars into the future, allowing traders to anticipate market movements before they occur.
⚡ How to Use
• The Trend: If price is above the Purple Axis (257), the market is in a bullish phase.
• The Entry: Look for "L" (Long) and "S" (Short) signals. These are confirmed when the signal path crosses the Axis.
• The Future: Watch the projected lines on the right side of the chart to identify upcoming resistance zones.
About Miela Labs
Miela Labs is a Technomancy Research Institute based in McKinney, Texas. We specialize in building open-source esoteric trading tools and the Magic Programming Language (MPL).
🌐 Official Hub: Visit Miela Labs
💻 Source Code & Research: GitHub Repository
Disclaimer: This tool is for educational and research purposes only. It demonstrates the application of esoteric mathematics in financial analysis. Trade responsibly.
Trendstrategy

QuantMotions - TPR SentinelQuantMotions – TPR Sentinel
The TPR Sentinel Band is a full trade-assistant for discretionary traders.
It combines an adaptive trend engine, directional TPR logic, volume intelligence, ATR-based risk management, a brute-force parameter optimizer, and a modern on-chart UI (entries/TP/SL panel + stats). The goal: fewer fake flips, clearer trend shifts, and visually guided trade management.
1. Core Concept
The Sentinel Line is built from a blend of:
- SMA + EMA
- Midline of highest/lowest high/low (Kijun-style)
- Donchian-style mid close
On top of that, the script calculates a Directional TPR (Time-Price-Ratio):
- Short / medium / long slopes of price
- Normalized by ATR
- Converted into a trend state:
+1 = Uptrend
-1 = Downtrend
0 = Neutral / transition
Hysteresis (Flux) controls how easily the trend flips:
- Higher hysteresis → harder to reverse → fewer fake-outs in chop.
2. Signals, Filters & Volume Intelligence
Signals
- Trend Flip Long: TrendState changes from −1/0 → +1.
- Trend Flip Short: TrendState changes from +1/0 → −1.
Filters
- ADX Filter (optional):
- Only allows trades if ADX is above a chosen threshold.
- Avoids trading in flat, low-energy markets.
R:R Filter:
- Before any signal is accepted, the script checks whether the distance to TP1 is at least the configured Risk:Reward ratio relative to the distance to SL.
- Only if that minimum R:R is reached, a signal becomes valid.
Volume Intelligence & Clouds
- Aggregates up/down volume (optionally across multiple tickers you define).
- Builds Volume Clouds around the Sentinel Line:
a) Positive intensity → buying pressure (bullish cloud).
b) Negative intensity → selling pressure (bearish cloud).
Optional Volume Direction Filter:
- Long only when volume intensity ≥ 0.
- Short only when volume intensity ≤ 0.
3. Risk, Exits & Trailing Stop
The indicator includes a complete exit framework (for visual/manual trading):
Stop Loss Modes
- ATR Fixed: SL placed at a fixed ATR multiple from the entry.
- Trend Line (Dynamic): SL placed directly on the Sentinel Band (structural stop).
Take Profits
- TP1 – “safe target”:
a) Based on ATR distance.
b) Closes a configurable percentage of the position (e.g., 50%).
- TP2 (optional):
Second fixed target used only when Trailing Stop is OFF.
- Trend Runner Mode (Use TP = OFF):
Ignores fixed TP levels and rides the trend until the trend state flips.
Trailing Stop
- Activates after TP1 is hit (if enabled).
- Moves with price at a configurable ATR distance:
a) Long: trail creeps up under price.
b) Short: trail creeps down above price.
- Visually plotted as a purple trail line, dynamically replacing the original SL as the effective exit point.
Each trade is tracked internally and drawn as a green/red box with PnL labels between entry and exit.
4. UI & Stats
Candle Coloring (TRON Theme)
- Cyan = active uptrend & valid environment.
- Orange = active downtrend & valid environment.
Modern Trade Panel (on last bar)
- Live overlay of:
a) Entry
b) TP1
c) TP2
d) SL or active Trail (with dynamic label text: “SL (ATR)”, “SL (Struct)”, “TRAIL”)
Info label shows:
- Historical win rate in the current direction (Long/Short).
- Distance to SL, TP1, TP2 from current price.
- Box color blends from red → green depending on whether price is closer to SL or TP.
Stats Table (Bottom Right)
- Separate stats for Long and Short trades:
a) Win rate (%)
b) Cumulative PnL
Alerts
- Generates JSON alerts on signals, for example: {"side":"buy","ticker":"XYZ","price":123.45}
Perfect for webhooks, bots, or external automation.
5. Brute Force Optimizer (TPR Lab) – Important Limitations
The built-in Optimizer is a numerical helper, not a full strategy optimizer.
What it does:
- Runs brute-force simulations over a sliding window of historical data.
- Scans user-defined ranges for:
- Best Period (“Best Cycle”)
- Best Hysteresis (“Best Flux”)
Uses an efficiency score (average profit per trade) to rank combinations.
Displays results in the bottom-left TRON panel:
- Best Cycle
- Best Hysteresis
- Efficiency Score
What it does NOT optimize or take into account:
- It does not include your actual minimum R:R filter.
- It does not simulate or optimize your Stop Loss modes.
- It does not simulate Trailing Stops.
- It does not use the ADX filter.
- It does not use the Volume filters or Volume Clouds.
Because of this, the suggested “best” Period and Hysteresis are purely computational recommendations based on a simplified internal model.
In real trading, with your full setup (R:R filter, SL mode, Trailing, ADX, Volume confirmation, personal style), other parameter combinations can be superior to what the Optimizer suggests.
You should treat the Optimizer as:
A starting point or a research tool, not the final truth.
Always validate its suggestions visually, in the context of your full system and risk management.
6. Practical Usage
- Works on FX, indices, crypto, commodities – anything with decent liquidity.
- Scalping → use lower Period values, higher responsiveness.
- Swing → use higher Period values, more stability.
Recommended:
- Keep ADX filter ON to avoid dead markets.
- Use Volume Clouds as directional bias.
- Use the Info Panel and Stats to align with your own R:R and risk rules.
Disclaimer
This script is for educational/analytical purposes only and does not constitute financial advice. It does not execute trades or manage your risk automatically. Always combine it with your own strategy, money management, and independent decision-making.
Use the Info Panel and Stats to align with your own R:R and risk rules.

Hash SupertrendHash Supertrend is a visually enhanced Supertrend-based indicator designed by Hash Capital Research, tuned specifically for crypto trend trading on Solana (SOL) and Bitcoin (BTC). It combines institutional-style color coding, an optional session time filter, and production-ready alerts for systematic and discretionary traders alike.
What This Indicator Is
Hash Supertrend is a trend-following volatility band indicator built on TradingView’s native ta.supertrend() function.
It’s optimized and visually styled for:
High-volatility crypto pairs (especially SOL/USDT, SOL/USD, BTC/USDT, BTC/USD)
Timeframes typically used by crypto traders (from 5m scalping to 4H swing and 1D trend following)
The script is an indicator, not a strategy:
It does not place trades or show backtest results.
It provides clear trend states, flips, and alerts that you can plug into your own execution stack or manual trading.
Key Features
✅ Tuned for Crypto (Solana & Bitcoin)
Parameters are chosen to respond well to the volatility profile of SOL and BTC, reducing noise while still catching strong moves.
✅ Non-repainting Supertrend Core
Uses TradingView’s built-in ta.supertrend — values may move intrabar as the bar forms, but once a bar closes, the historical line and signals do not repaint.
✅ Fluorescent Trend Visualization
Bright green for bullish phases
Bright red for bearish phases
Adaptive color intensity based on user setting
✅ Glow Layer & Trend Zones
Glow effect around the Supertrend line for instant visual recognition
Optional filled zones between price and line for “trend cloud” style visualization
✅ Time Filter (Session Control)
Option to only mark signals during specific hours for those wanting to integrate with webhooks
Designed for traders who avoid certain sessions (e.g., low-liquidity hours)
✅ Signal Dots & Alerts
Tiny green dots for bullish flips
Tiny red dots for bearish flips
Professional, preconfigured alerts for:
Long Entry
Short Entry
Any Trend Change
Filtered signals outside trading hours (for monitoring only)
The core logic is built on:
ATR Length (ATR Length) Default: 16
Lower values (7–10): more sensitive, more signals, more noise
Higher values (12–20): smoother, fewer but stronger trend signals
Factor (Factor) Default: 3.11
Lower values (1.5–2.5): tighter bands, earlier entries, higher whipsaws
Higher values (3.0–4.0+): wider bands, later entries, stronger trend confirmation
The indicator reads direction from ta.supertrend and classifies:
Bullish Trend: direction < 0
Bearish Trend: direction > 0
A trend flip happens when direction changes sign:
longSignal: Supertrend flips from above price to below price (bearish → bullish)
shortSignal: Supertrend flips from below price to above price (bullish → bearish)

Multi Pivot Trend [BigBeluga]🔵 OVERVIEW
The Multi Pivot Trend is an advanced market-structure-driven trend engine that evaluates trend strength by scanning multiple pivot breakouts simultaneously.
Instead of relying on a single swing length, it tracks breakouts across ten increasing pivot lengths — then averages their behavior to produce a smooth, reliable trend reading.
Mitigation logic (close, wick, or HL2 touches) controls how breakouts are confirmed, giving traders institutional-style flexibility similar to BOS/CHoCH validation rules.
This indicator not only colors candles based on trend strength, but also extends trend strength and volatility-scaled projection candles to show where trend pressure may expand next.
Pivot breakout lines and labels mark key changes, making the trend transitions extremely clear.
🔵 CONCEPTS
Market trend strength is reflected by multiple pivot breakouts, not just one.
The indicator analyzes ten pivot structures from smaller to larger swings.
Each bullish or bearish pivot breakout contributes to trend score.
Mitigation options (close / wick / HL2) imitate smart-money breakout confirmation logic.
Trend score is averaged and translated into colors and extension bars.
Neutral regime ≈ weak trend or transition zone (trend compression).
🔵 FEATURES
Multi-Pivot Engine — tracks 10 pivot-based trend signals simultaneously.
Mitigation Modes :
• Close — breakout requires candle close beyond pivot
• Wicks — breakout requires wick violation
• HL2 — breakout confirmed when average (H+L)/2 crosses level
Dynamic Color System :
• Blue → confirmed bullish rotation
• Red → confirmed bearish rotation
• Orange → neutral / transition state
Breakout Visualization — draws pivot breakout lines in real-time.
Trend Labels — prints trend %.
Trend Volatility-Scaled Extension Candles — ATR/trend strength based candle projections show momentum continuation strength.
Gradient Pivot Encoding — higher pivot lengths = deeper structure considered.
🔵 HOW TO USE
Use strong blue/red periods to follow dominant structural trend.
Watch for color transition into orange — possible trend change or consolidation.
Pivot breakout lines help validate structure shifts without clutter.
Wick mitigation catches aggressive liquidity-sweep based breaks.
Close/HL2 mitigation catches cleaner market structure rotations.
Extension bars visualize trend pressure — large extensions = strong push.
Best paired with volume or volatility confirmation tools.
🔵 CONCLUSION
The Multi Pivot Trend is a structural trend recognition system that blends multiple pivot breakouts into one clean trend score — with institutional-style mitigation logic and volatility-projected trend extensions.
It gives traders a powerful, visually intuitive way to track momentum, spot trend rotations early, and understand true structural flow beyond simple MA-based approaches.
Use it to stay aligned with the dominant swing direction while avoiding noise and false flips.

Curved Trend Channels (Zeiierman)█ Overview
Curved Trend Channels (Zeiierman) is a next-generation trend visualization tool engineered to adapt dynamically to both linear and non-linear market behavior. It introduces a novel curvature-based channeling system that grows over time during trending conditions, mirroring the natural acceleration of price trends, while simultaneously leveraging adaptive range filtering and dual-layer candle trend logic.
This tool is ideal for traders seeking smooth yet reactive dynamic channels that evolve with market structure. Whether used in curved mode or traditional slope mode, it provides exceptional clarity on trend transitions, volatility compression, and breakout development.
█ How It Works
⚪ Adaptive Range Filter Foundation
The core of the system is a volatility-based range filter that determines the underlying structure of the bands:
Pre-Smoothing of High/Low Data – Highs and lows are smoothed using a selectable moving average (SMA, EMA, HMA, KAMA, etc.) before calculating the volatility range.
Volatility Envelope – The range is scaled using a fixed factor (2.618) and further adjusted by a Band Multiplier to form the primary envelope around price.
Smoothed Volatility Curve – Final bands are stabilized using a long lookback, ensuring clean visual structure and trend clarity.
⚪ Curved Channel Logic
In Curved Mode, the trend channel grows over time when the trend direction remains unchanged:
Base Step Size (× ATR) – Sets the minimum unit of slope change.
Growth per Bar (× ATR) – Defines the acceleration rate of the channel slope with time.
Trend Persistence Recognition – The longer a trend persists, the more pronounced the slope becomes, mimicking real market accelerations.
This dynamic, time-dependent logic enables the channel to "curve" upward or downward, tracking long-standing trends with increasing confidence.
⚪ Trend Slope
As an alternative to curved logic, traders can activate a regular Trend slope using:
Slope Length – Determines how quickly the trend line adapts to price shifts.
Multiplicative Factor – Amplifies the sensitivity of the slope, useful in fast-moving markets or lower timeframes.
⚪ Candle Trend Confirmation
A robust second-layer trend detection method, the Candle Trend System evaluates directional pressure by analyzing smoothed price action:
Multi-tier Smoothing – Trend lines are derived from short-, medium-, and long-term candle movement.
█ How to Use
⚪ Trend Identification
When the Trend Line direction and Candle Colors are in agreement, this indicates strong, persistent directional conviction. Use these moments to enter with trend confirmation and manage risk more confidently.
⚪ Retest
During ongoing trends, the price will often pull back into the dynamic channel. Look for:
Support/resistance interactions at the upper or lower bands.
█ Settings
Scaled Volatility Length – Controls the historical depth used to stabilize the volatility bands.
Smoothing Type – Choose from HMA, KAMA, VIDYA, FRAMA, Super Smoother, etc. to match your asset and trading style.
Volatility MA Length – Smoothing length for the calculated range; shorter = more reactive.
High/Low Smoother Length – Additional smoothing to reduce noise from spikes or false pivots.
Band Multiplier – Widens or tightens the band range based on personal preference.
Enable Curved Channel – Toggle between curved or regular trend slope behavior.
Base Step (× ATR) – The starting point for curved slope progression.
Growth per Bar (× ATR) – How much the slope accelerates per bar during a sustained trend.
Slope – Reactivity of the standard trend line to price movements.
Multiplicative Factor – Sensitivity adjustment for HyperTrend slope.
Candle Trend Length – Lookback period for trend determination from candle structure.
-----------------
Disclaimer
The content provided in my scripts, indicators, ideas, algorithms, and systems is for educational and informational purposes only. It does not constitute financial advice, investment recommendations, or a solicitation to buy or sell any financial instruments. I will not accept liability for any loss or damage, including without limitation any loss of profit, which may arise directly or indirectly from the use of or reliance on such information.
All investments involve risk, and the past performance of a security, industry, sector, market, financial product, trading strategy, backtest, or individual's trading does not guarantee future results or returns. Investors are fully responsible for any investment decisions they make. Such decisions should be based solely on an evaluation of their financial circumstances, investment objectives, risk tolerance, and liquidity needs.

Arithmetic Candlesticks (Zeiierman)█ Arithmetic Candlestick - Overview
Arithmetic Candlesticks (Zeiierman) introduce a new way to read charts by applying logical arithmetic to real price data. These candlesticks focus on filtering out noise and smoothing price movements using a bell-shaped curve, which helps to refine the data and highlight the true trend. This approach provides a clearer view of market trends, allowing traders to interpret price action more effectively with minimal lag and distraction.
⚪ What is Arithmetic Candlesticks
Arithmetic Candlesticks use a calculation method rooted in the idea that the market moves in patterns that can be identified and predicted by examining past price movements.
Analyzing momentum, price action, and trend patterns is useful for traders who want to quickly scan and identify price patterns, trends, and momentum in the market. The system searches for these patterns and trends to anticipate future price movements. Traders and investors can identify trends hidden in market noise, enabling them to uncover trading opportunities that might not be immediately obvious to the naked eye.
⚪ Eliminates price noise
The Arithmetic Candlestick noise filtering function is used to reduce price noise, which is the randomness in the price movement of an asset caused by market participants trading on a short-term basis. The idea behind the filter is that it eliminates the impact of short-term fluctuations in the price, thus providing a more accurate picture of the overall trend.
█ Capturing Trends with precise chart reading
Trend moves are some of the biggest moneymakers in trading; in fact, trading in the direction of the trend reduces risk and increases profit potential. Arithmetic Candlestick helps traders do just that.
In a fast-moving and volatile market characterized by high-frequency algorithms, retail traders have a hard time distinguishing the real trend from the noise. Arithmetic Candlesticks are designed to filter out the noise created by insignificant price moves and leave traders with the price action that matters, namely a clear and insightful chart reading. Due to its sophisticated mathematical calculations, Arithmetic Candlesticks are able to analyze any market and timeframe.
█ How to use Arithmetic Candlesticks
Arithmetic Candlesticks is an all-in-one trend and momentum tool that can be used stand-alone or in conjunction with other indicators. Its primary use is to provide a clear chart reading, easily identify trends, and help traders stay longer in trends.
The indicator includes excellent momentum features that offer insights into the current momentum and the strength of the price action. This provides traders with a unique chart experience that yields valuable insights. The indicator boasts numerous features, each of which can be used stand-alone or in combination with others. Read more about the features below.
These candles can be used in conjunction with other indicators such as support/resistance, trendlines, ICT trading, and other patterns.
█ Arithmetic Candlesticks features
The indicator comes with tons of great features that make the indicator into its own system that can be used stand-alone. You find everything from trend reading, entry/exit points, identifying momentum, and auto-stop loss.
⚪ Candle Modes:
Traders can select from three different types of arithmetic candle calculations and enable our volatility-adjusted filter for all of them. By default, the candles are set to Arithmetic candlesticks. However, depending on their trading preferences, users can select Arithmetic + Heikin Ashi Candles or Impulse + Wicks Candles.
The Heikin Ashi mode of the candlesticks makes the indicator smoother and more trend-friendly.
The Impulse + Wick mode of the candlesticks makes the indicator responsive to momentum. The length of the wicks represents the strength of the current momentum. The longer the wicks, the greater the momentum in the market.
If traders enable the Volatility Adjusted candles , the indicator becomes much more responsive to volatility moves, which is a way of making the candlesticks more responsive to significant price movements.
⚪ Trend coloring
Arithmetic candlesticks come in three different color modes: the default one, the gradient one, and the advanced trend coloring. Enable the Trend coloring if you want to engage in long-term trend trading. This filter does not change the arithmetic candlesticks, only the bar coloring.
⚪ Buy and Sell signals
To make trend trading easier to understand, we have included Buy/Sell signals. These signals are based both on the type of candlesticks selected and the type of coloring used. In addition, they come with three filters and are available in scalping and trend modes.
Candle Color Filter: A buy signal will only occur if the candlesticks are bullish, and a sell signal will only occur if the candlesticks are bearish.
Trend Tracker Filter: A buy signal will only occur if the Trend Tracker is bullish, and a sell signal will only occur if the Trend Tracker is bearish.
When both filters are applied, it means that both the candle color and the Trend Tracker should have the same sign in order to trigger a signal.
These filters are very effective and should be used when utilizing the signals.
Take Profit signals can be enabled to help traders know when to take profits.
Adaptive Stop Loss can be enabled for the signals, helping traders manage their risk.
⚪ Trend Tracker
The Trend Tracker line provides insights about the underlying trend. Adjust it if you want to engage in scalping, which makes the line much more responsive. Set the underlying speed of the trend to either Fast or Slow. This Trend Tracker works well in conjunction with Arithmetic Candlesticks and the associated signals.
⚪ Trend Sentiment
Enable Trend Sentiment to identify the levels at which the market is considered bullish or bearish. This feature helps you gauge the overall market direction, allowing you to align your trades with the prevailing trend. The Trend Sentiment also measures the strength of the trend, highlighting whether the current price action reflects a strong or weak trend. Adjust the sensitivity to determine how early or late you want to capture these trend signals.
⚪ Impulse
Enable Impulse Signals to understand when the market is making a significant move, often leading to a pullback or pause. These Impulse Signals can indicate the very start of a trend or serve as the first sign of a reversal. Enable 'Significant Impulses' if you only want to display the most significant market impulses.
█ How is Arithmetic Candlesticks Calculated?
⚪ Candlesticks
These candlesticks combine advanced smoothing techniques with price pattern recognition, giving traders a clearer view of market dynamics.
Adaptive Smoothing: The core of this smoothing approach is its ability to adjust dynamically based on market conditions. It reduces lag while staying responsive to price changes. This adaptive nature allows the candlesticks to follow the price action smoothly, minimizing the influence of short-term fluctuations. As a result, the trend is depicted with greater accuracy, helping traders to stay in tune with the market’s true direction.
Refined Smoothing with Weighted Averages: Another key component of the smoothing process involves applying a refined technique that uses a bell-shaped curve to weight price data. This method reduces the impact of outlier movements, resulting in a smoother, more continuous curve that accurately represents the market's central trend. This ensures that the candlesticks reflect a more balanced view of price action, focusing on the significant movements while filtering out unnecessary noise.
⚪ Trend Coloring
The Trend Coloring feature offers a powerful visualization tool that helps traders quickly identify the prevailing market trend and its strength. By analyzing market structure and the velocity of price movements, this feature provides a clear, dynamic view of the long-term trend direction.
Market Structure Analysis: The Trend Coloring is rooted in a thorough analysis of market structure, focusing on key price levels over time. By evaluating these levels, the system determines whether the market is in an uptrend, downtrend, or ranging phase. This information is then used to color the chart according to the current trend direction, providing a visual cue that makes it easier to align your trades with the broader market movement.
Velocity of Price Movements: . In addition to identifying the trend direction, the system also calculates the velocity of price movements. This involves assessing how quickly or slowly prices are advancing in a particular direction, offering deeper insight into the trend's strength and momentum. Faster price movements suggest a stronger trend, while slower movements may indicate a weakening or consolidating market. This dynamic approach ensures that the Trend Coloring not only highlights the trend but also reflects its intensity and potential sustainability.
⚪ Buy and Sell signals
The Buy/Sell signals are generated using a sophisticated approach that tracks key price action levels to determine market direction and momentum. This method constantly evaluates the relationship between the current price and dynamically adjusting levels that reflect the underlying market conditions. By staying in tune with the flow of the market, this approach effectively captures the onset of new trends while reducing the lag typically associated with traditional indicators.
Dynamic Price Action Levels: The signals are based on critical price action levels that adapt in real-time to market movements. These levels serve as flexible thresholds that help identify potential buy or sell opportunities. When the price interacts with these levels, it triggers signals that indicate possible entry or exit points, aligning your trades with the prevailing market direction.
Price Patterns: The algorithm also recognizes and integrates specific price patterns that are often precursors to significant market moves. By identifying these patterns, the system can anticipate changes in market direction more accurately, enabling earlier and more precise signals. This helps in capturing trend reversals or continuations effectively.
Momentum-Driven Adjustments: The system's price action levels are not static; they adjust dynamically in response to strong price movements. This ensures that the signals are not only timely but also in sync with the underlying market momentum, making the system highly effective in volatile conditions where quick decision-making is crucial.
⚪ Trend Tracker
The Trend Tracker utilizes the core principles of Arithmetic Candlesticks, including their sophisticated smoothing techniques and pattern recognition capabilities. By leveraging these features, the Trend Tracker effectively filters out market noise, allowing it to present a smooth and accurate representation of the current trend. This makes it easier to identify whether the market is trending upwards, downwards, or entering a period of consolidation.
Adaptive to Market Conditions: The Trend Tracker is not static; it dynamically adjusts as market conditions change. Whether the market is experiencing high volatility or moving through a quieter phase, the Trend Tracker remains responsive, continuously updating to reflect the most recent price action. This ensures that traders are always working with the most relevant information, making it easier to stay in sync with the market's true direction.
⚪ Trend Sentiment
Trend Sentiment analyzes key price levels and market structure to determine whether the current market sentiment is bullish or bearish. By examining the direction and momentum of price movements, it provides a straightforward view of the market's overall trend direction.
⚪ Impulse
Impulse monitors the market for sudden shifts in momentum, recognizing when the price is making a strong move that could lead to a trend continuation or a reversal. The feature is tuned to distinguish between regular market fluctuations and significant impulses. It focuses on the most meaningful price movements, ensuring that the signals you receive are relevant and actionable.
█ Important Note
Caution! Arithmetic candlesticks do not always reflect the actual price. Arithmetic uses smoothing and noise filtering to capture trends; hence, it might deviate from the actual close.
It's important to understand that Arithmetic Candlesticks are intended to provide a clearer picture of trend direction rather than exact price levels. Therefore, they should not be used as a substitute for actual market prices, especially in scenarios like backtesting or precise trade execution where exact price data is crucial. Instead, use Arithmetic Candlesticks as a tool for understanding trends and overall market direction, while relying on actual price data for decisions that require precise price points.
-----------------
Disclaimer
The information contained in my Scripts/Indicators/Ideas/Algos/Systems does not constitute financial advice or a solicitation to buy or sell any securities of any type. I will not accept liability for any loss or damage, including without limitation any loss of profit, which may arise directly or indirectly from the use of or reliance on such information.
All investments involve risk, and the past performance of a security, industry, sector, market, financial product, trading strategy, backtest, or individual's trading does not guarantee future results or returns. Investors are fully responsible for any investment decisions they make. Such decisions should be based solely on an evaluation of their financial circumstances, investment objectives, risk tolerance, and liquidity needs.
My Scripts/Indicators/Ideas/Algos/Systems are only for educational purposes!
Платный скрипт

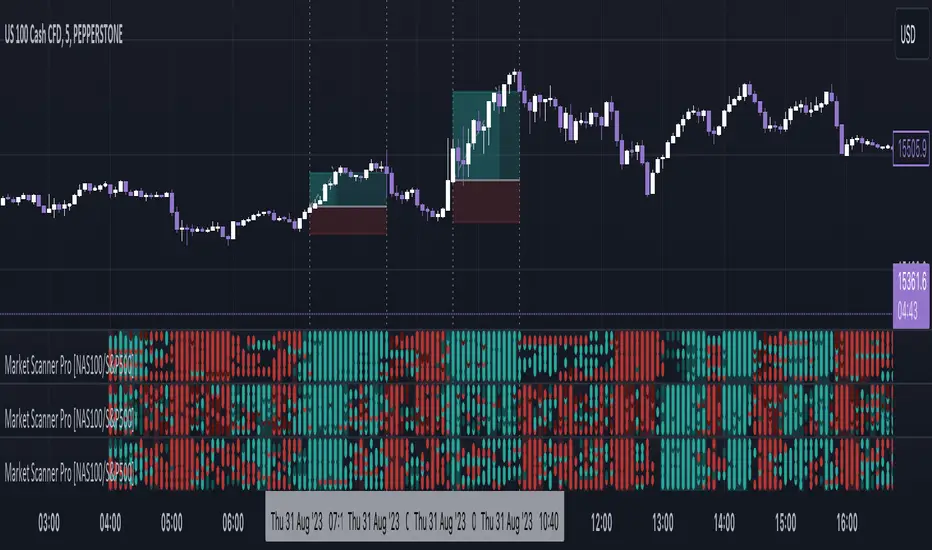
Market Scanner Pro - NAS100/S&P500 [FxScripts]***** OVERVIEW *****
Market Scanner Pro is both a multi-functional indicator and market scanner combined. The combination allows you to have multiple eyes across the market, all from a single chart.
The scanner is comprised of an intuitively designed 3-in-1 tool that tracks the key metrics that drive markets. Each use advanced algorithms to gather information from multiple data points, distilled into one simplified view.
***** TREND SCANNER *****
The first indicator featured on the chart is the Trend Scanner, this allows you to track price action across the wider market. Instantly see pattern shifts and emerging trends; when the market moves, you move with it.
***** MOMENTUM SCANNER *****
The second is the Momentum Scanner which offers a realtime representation of momentum shifts as they occur. This allows you to monitor false breakouts and catch the moves that matter.
***** VOLUME SCANNER *****
The third is the Volume Scanner which provides unique insight into where buy and sell volume is being placed across the market. It offers a further way of determining entry and exit points or simply confirmation that a trend is underway.
***** HOW IT WORKS *****
1. The scanner surveys the market looking for strengths and weaknesses in Trend, Momentum or Volume.
2. It displays the underlying strength or weakness as a series of dots with up to 10 green dots showing strength and up to 10 red dots showing weakness.
3. Lighter colored dots are displayed where the strength of the trend, momentum or volume is lesser; if a dot is missing this is a sign of market neutrality.
4. All scanners have a sensitivity setting plus a volatility filter which can be adjusted according to your style of trading and the underlying instrument (full details below).
5. The background can be set to color-fill when the majority of dots are coloured either red or green, with higher values denoting greater strength or greater weakness.
6. Alerts can be configured in the same way as the background to provide both entry and exit signals (further details below).
***** INSTRUMENTS *****
Market Scanner Pro is made up of both a European and US indices scanner, both forming part of the same package.
European features the DAX40 and FTSE100; US (this scanner) features the NAS100 plus S&P500. The US scanner works on futures and options such as ES, NQ, QQQ, SPX and SPY.
***** SETTINGS OVERVIEW *****
The scanner features the following customizable settings:
~~ Trend Settings ~~
▶ Trend Filter - adjusting this will allow you to focus on short term trends (most suitable for scalping), medium or long term (best for swing trading).
▶ Countertrend Strength - increases the sensitivity of weaker vs stronger countertrends. As countertrends are trends that run against the main trend, this will assist in detecting the strength of a pullback or reversal and allow you to either hold, exit or reverse the trade with confidence.
~~ Momentum Settings ~~
▶ Momentum Filter - increase or decrease the sensitivity of the momentum scanner. Increase to avoid periods of low or weak momentum, decrease to highlight stronger surges in momentum.
~~ Volume Settings ~~
▶ Volume Filter - increase or decrease the sensitivity of the volume scanner. Increase to avoid periods where buy and sell volume can potentially cancel each other out.
~~ Volatility Settings ~~
▶ Volatility Offset - use this to fine tune the volatility filter. A higher value generally delays the volatility filter allowing for confirmation of stronger trends, a lower value will detect trend, momentum or volume movement sooner but may be less accurate.
▶ Each scanner has its own setting allowing you to adjust how you monitor the underlying volatility for each.
▶ As with all settings, we recommend adjusting this to your style of trading, instrument and timeframe.
~~ Alerts ~~
Alerts can be configured to send notifications when anything from 6-10 bullish or bearish dots are showing. Exit markers can be configured when anything from 2+ dots are revealed. This adds an extra layer of sensitivity for traders who appreciate complete control over their trade.
~~ Display Settings ~~
You have the ability to hide all colored dots and only show the background or, alternatively, hide the background and only show colored dots.
***** TRIAL PERIOD *****
We offer a FREE, no questions asked, 7-day trial with every new registration. Visit the link below to register.
Market Scanner Pro - DAX/FTSE [FxScripts]***** OVERVIEW *****
Market Scanner Pro is both a multi-functional indicator and market scanner combined. The combination allows you to have multiple eyes across the market, all from a single chart.
The scanner is comprised of an intuitively designed 3-in-1 tool that tracks the key metrics that drive markets. Each use advanced algorithms to gather information from multiple data points, distilled into one simplified view.
***** TREND SCANNER *****
The first indicator featured on the chart is the Trend Scanner, this allows you to track price action across the wider market. Instantly see pattern shifts and emerging trends; when the market moves, you move with it.
***** MOMENTUM SCANNER *****
The second is the Momentum Scanner which offers a realtime representation of momentum shifts as they occur. This allows you to monitor false breakouts and catch the moves that matter.
***** VOLUME SCANNER *****
The third is the Volume Scanner which provides unique insight into where buy and sell volume is being placed across the market. It offers a further way of determining entry and exit points or simply confirmation that a trend is underway.
***** HOW IT WORKS *****
1. The scanner surveys the market looking for strengths and weaknesses in Trend, Momentum or Volume.
2. It displays the underlying strength or weakness as a series of dots with up to 10 green dots showing strength and up to 10 red dots showing weakness.
3. Lighter colored dots are displayed where the strength of the trend, momentum or volume is lesser; if a dot is missing this is a sign of market neutrality.
4. All scanners have a sensitivity setting plus a volatility filter which can be adjusted according to your style of trading and the underlying instrument (full details below).
5. The background can be set to color-fill when the majority of dots are coloured either red or green, with higher values denoting greater strength or greater weakness.
6. Alerts can be configured in the same way as the background to provide both entry and exit signals (further details below).
***** INSTRUMENTS *****
Market Scanner Pro is made up of both a European and US indices scanner, both forming part of the same package.
European (this scanner) features the DAX40 and FTSE100; US features the NAS100 plus S&P500. The US scanner works on futures and options such as ES, NQ, QQQ, SPX and SPY.
***** SETTINGS OVERVIEW *****
The scanner features the following customizable settings:
~~ Trend Settings ~~
▶ Trend Filter - adjusting this will allow you to focus on short term trends (most suitable for scalping), medium or long term (best for swing trading).
▶ Countertrend Strength - increases the sensitivity of weaker vs stronger countertrends. As countertrends are trends that run against the main trend, this will assist in detecting the strength of a pullback or reversal and allow you to either hold, exit or reverse the trade with confidence.
~~ Momentum Settings ~~
▶ Momentum Filter - increase or decrease the sensitivity of the momentum scanner. Increase to avoid periods of low or weak momentum, decrease to highlight stronger surges in momentum.
~~ Volume Settings ~~
▶ Volume Filter - increase or decrease the sensitivity of the volume scanner. Increase to avoid periods where buy and sell volume can potentially cancel each other out.
~~ Volatility Settings ~~
▶ Volatility Offset - use this to fine tune the volatility filter. A higher value generally delays the volatility filter allowing for confirmation of stronger trends, a lower value will detect trend, momentum or volume movement sooner but may be less accurate.
▶ Each scanner has its own setting allowing you to adjust how you monitor the underlying volatility for each.
▶ As with all settings, we recommend adjusting this to your style of trading, instrument and timeframe.
~~ Alerts ~~
Alerts can be configured to send notifications when anything from 6-10 bullish or bearish dots are showing. Exit markers can be configured when anything from 2+ dots are revealed. This adds an extra layer of sensitivity for traders who appreciate complete control over their trade.
~~ Display Settings ~~
You have the ability to hide all colored dots and only show the background or, alternatively, hide the background and only show colored dots.
***** TRIAL PERIOD *****
We offer a FREE, no questions asked, 7-day trial with every new registration. Visit the link below to register.

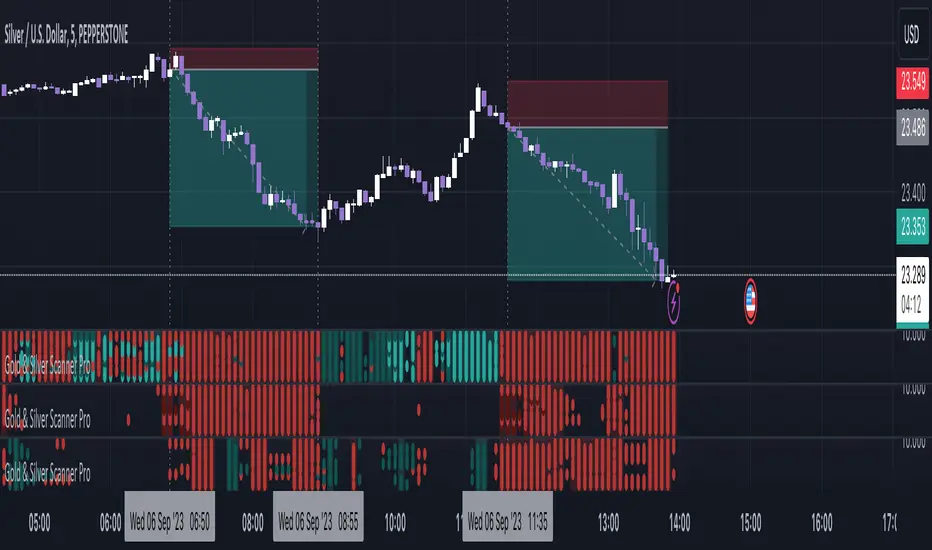
Gold & Silver Scanner Pro [FxScripts]***** FEATURES *****
Gold & Silver Scanner Pro is both a multi-functional indicator and market scanner combined. The combination allows you to have multiple eyes across the market, all from a single chart.
The scanner is comprised of an intuitively designed 3-in-1 tool that tracks the key metrics that drive markets. Each use advanced algorithms to gather information from multiple data points, distilled into one simplified view.
***** TREND SCANNER *****
The first indicator featured on the chart is the Trend Scanner, this allows you to track price action across the wider market. Instantly see pattern shifts and emerging trends; when the market moves, you move with it.
***** MOMENTUM SCANNER *****
The second is the Momentum Scanner which offers a realtime representation of momentum shifts as they occur. This allows you to monitor false breakouts and catch the moves that matter.
***** VOLUME SCANNER *****
The third is the Volume Scanner which provides unique insight into where buy and sell volume is being placed across the market. It offers a further way of determining entry and exit points or simply confirmation that a trend is underway.
***** HOW IT WORKS *****
1. The scanner surveys the market looking for strengths and weaknesses in Trend, Momentum or Volume.
2. It displays the underlying strength or weakness as a series of dots with up to nine green dots showing strength and up to nine red dots showing weakness (nine data points in total).
3. Lighter colored dots are displayed where the strength of the trend, momentum or volume is lesser; if a dot is missing this is a sign of market neutrality.
4. All scanners have a sensitivity setting plus a volatility filter which can be adjusted according to your style of trading and the underlying instrument (full details below).
5. The background can be set to color-fill when the majority of dots are coloured either red or green, with higher values denoting greater strength or greater weakness.
6. Alerts can be configured in the same way as the background to provide both entry and exit signals (further details below).
***** INSTRUMENTS *****
Gold & Silver Scanner Pro works effortlessly with any of the XAG and XAU major or minor crosses:
XAGAUD, XAGCHF, XAGEUR, XAGGBP, XAGJPY, XAGUSD, XAUAUD, XAUCHF, XAUEUR, XAUGBP, XAUJPY, XAUUSD
Plus the following gold and silver futures:
GC, SI
***** SETTINGS OVERVIEW *****
The scanner features the following customizable settings:
~~ Trend Settings ~~
▶ Trend Filter - adjusting this will allow you to focus on short term trends (most suitable for scalping), medium or long term (best for swing trading).
▶ Countertrend Strength - increases the sensitivity of weaker vs stronger countertrends. As countertrends are trends that run against the main trend, this will assist in detecting the strength of a pullback or reversal and allow you to either hold, exit or reverse the trade with confidence.
~~ Momentum Settings ~~
▶ Momentum Filter - increase or decrease the sensitivity of the momentum scanner. Increase to avoid periods of low or weak momentum, decrease to highlight stronger surges in momentum.
~~ Volume Settings ~~
▶ Volume Filter - increase or decrease the sensitivity of the volume scanner. Increase to avoid periods where buy and sell volume can potentially cancel each other out.
~~ Volatility Settings ~~
▶ Volatility Offset - use this to fine tune the volatility filter. A higher value generally delays the volatility filter allowing for confirmation of stronger trends, a lower value will detect trend, momentum or volume movement sooner but may be less accurate.
▶ Each scanner has its own setting allowing you to adjust how you monitor the underlying volatility for each.
▶ As with all settings, we recommend adjusting this to your style of trading, instrument and timeframe.
~~ Alerts ~~
Alerts can be configured to send notifications when anything from 5-9 bullish or bearish dots are showing. Exit markers can be configured when anything from 2+ dots are revealed. This adds an extra layer of sensitivity for traders who appreciate complete control over their trade.
~~ Display Settings ~~
You have the ability to hide all colored dots and only show the background or, alternatively, hide the background and only show colored dots.
***** TRIAL PERIOD *****
We offer a FREE, no questions asked, 7-day trial with every new registration. Visit the link below to register.
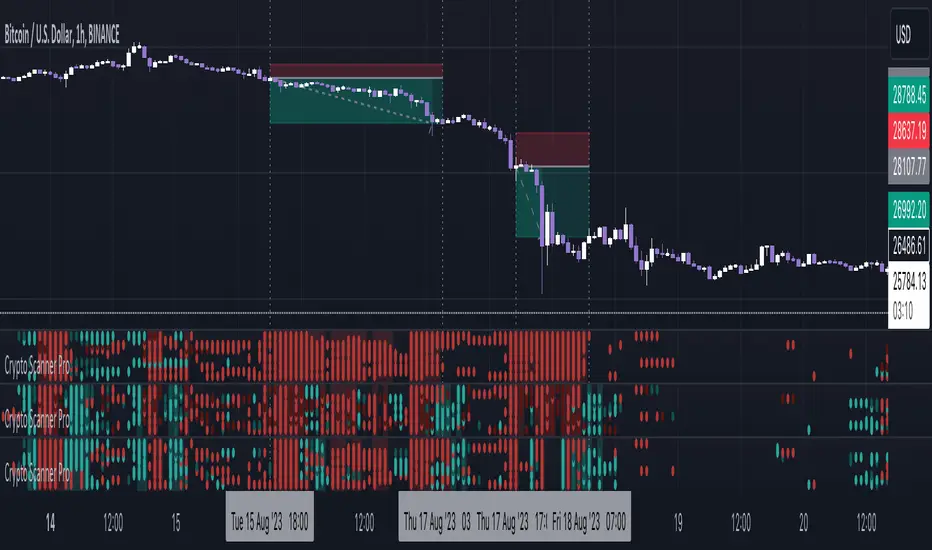
Crypto Scanner Pro [FxScripts]***** FEATURES *****
Crypto Scanner Pro is both an indicator and market scanner combined. The combination allows you to have multiple eyes across the market, all from a single chart.
Each scanner is comprised of an intuitively designed 3-in-1 tool that tracks the key metrics that drive markets.
They each use advanced algorithms to gather information from multiple data points, distilled into one simplified view.
***** TREND SCANNER *****
The Trend Scanner allows you to track price action across the wider market. Instantly see pattern shifts and emerging trends; when the market moves, you can move with it.
***** MOMENTUM SCANNER *****
The Momentum Scanner offers realtime insights into momentum shifts as they occur. This allows you to monitor false breakouts and catch the moves that matter.
***** VOLUME SCANNER *****
The Volume Scanner provides unique indications into where buy and sell volume is being placed. It offers a further way of determining entry and exit points or simply confirmation that a trend is underway.
***** INSTRUMENTS *****
Crypto Scanner Pro works effortlessly with the following large cap coins:
Avalanche, Bitcoin Cash, Bitcoin, BITO, BNB, Cardano, Chainlink, Dogecoin, Ethereum, Litecoin, Polkadot, Polygon, Shiba Inu, Solana, Stellar, Toncoin, XRP (Ripple) *
***** SETTINGS OVERVIEW *****
The scanner features the following customizable settings:
~~ Trend Settings ~~
Trend Filter - adjusting this will allow you to focus on short term trends (most suitable for scalping), medium or long term (best for swing trading).
Countertrend Strength - increases the sensitivity of weaker vs stronger countertrends. As countertrends are trends that run against the main trend, this will assist in detecting the strength of a pullback or reversal and allow you to either hold, exit or reverse the trade with confidence.
~~ Momentum Settings ~~
Momentum Filter - increase or decrease the sensitivity of the momentum scanner. Increase to avoid periods of low or weak momentum, decrease to highlight stronger surges in momentum.
~~ Volume Settings ~~
Volume Filter - increase or decrease the sensitivity of the volume scanner. Increase to avoid periods where buy and sell volume can potentially cancel each other out.
~~ Volatility Settings ~~
Volatility Offset - use this to fine tune the volatility filter. A higher value generally delays the volatility filter allowing for confirmation of stronger trends, a lower value will detect trend, momentum or volume movement sooner but may be less accurate.
Each scanner has its own setting allowing you to adjust how you monitor the underlying volatility for each.
As with all settings, we recommend adjusting this to your style of trading, instrument and timeframe.
~~ Alerts ~~
Alerts can be configured to send notifications when anything from 6-10 bullish or bearish dots are showing. Exit markers can be configured when anything from 2+ dots are revealed. This adds an extra layer of sensitivity for traders who appreciate complete control over their trade.
~~ Display Settings ~~
You have the ability to hide all colored dots and only show the background or, alternatively, hide the background and only show colored dots.
***** TRIAL PERIOD *****
We offer a FREE, no questions asked, 7-day trial with every new registration. Visit the link below to register.
* list subject to change as coins increase or decrease in popularity
Trend Tracer [Cloud] (Expo)█ Overview
The Trend Tracer (Expo) indicator identifies and predicts the future market direction. The cloud is designed to make it easier to see when a market is trending in one direction or another and to help traders identify potential entry and exit points, as well as trend changes. It is a visual representation of the price's momentum, price action, and volatility by using the trend range in a cloud-like pattern. The bigger the cloud, the more momentum the price has.
█ How is the trend tracer cloud calculated?
The primary function used in the code is an extension of traditional single-smoothed moving averages, using a more sophisticated weighting system to reduce the effect of short-term fluctuations and provide a clearer view of the underlying trend. Using this function, we get a unique leading trend tracer while maintaining a robust long-term trend tracer. This allows for more accurate trending signals and helps reduce the amount of noise in the data.
█ Trend Cloud Trading
Trend Cloud Trading is a type of trading based on technical analysis that uses a tool called a trend cloud. A trend cloud is a graphical representation of how a certain asset or instrument is trending over a specific period of time. The trend cloud will highlight areas where there is high volatility, low volatility, and the current trend direction and its strength.
█ How to use
One way of using the indicator is to look for a "cloud break," which is when the cloud turns from red to green (or vice versa) and indicates a change in the trend.
S/R Levels
The Trend Tracer Cloud can be used to find support in a bullish trend and resistance in a bearish trend. If the cloud is sloping downwards in a bearish trend, traders can look for potential resistance levels at the highs of the cloud. Similarly, if the cloud is sloping upwards in a bullish trend, traders can look for potential support levels at the lows of the cloud.
Volatility
The width of the cloud is used to determine if there is high or low volatility.
Strength
The deviation between the leading trend advisor line and the price determines whether a trend is strong or weak. The larger the deviation, the stronger the trend move.
█ Indicator Features
Trend Cloud
It highlights the trending range, current volatility, and trend direction.
Trend Advisor - leading and trending + cloud
The leading trend advisor highlights the short-term trend strength and momentum, while the trending trend advisor highlights the underlying long-term trend.
Trend Tracker
The Trend Tracker is a fast-moving trend-following line that combines long-term and short-term trend characteristics.
Trend Candlesticks
The Bar coloring uses momentum to highlight the current trend direction.
-----------------
Disclaimer
The information contained in my Scripts/Indicators/Ideas/Algos/Systems does not constitute financial advice or a solicitation to buy or sell any securities of any type. I will not accept liability for any loss or damage, including without limitation any loss of profit, which may arise directly or indirectly from the use of or reliance on such information.
All investments involve risk, and the past performance of a security, industry, sector, market, financial product, trading strategy, backtest, or individual's trading does not guarantee future results or returns. Investors are fully responsible for any investment decisions they make. Such decisions should be based solely on an evaluation of their financial circumstances, investment objectives, risk tolerance, and liquidity needs.
My Scripts/Indicators/Ideas/Algos/Systems are only for educational purposes!

Trend Analysis Ultimate (Zeiierman)█ Overview
Trend Analysis Ultimate (Zeiierman) highlights meaningful pullbacks within active market trends and visualizes them through green and red columns, retracement triangles, and an optional trend-colored background. It is designed to make the distinction between continuation and transition phases clear at a glance while automatically managing dynamic trailing stops, early and partial profit-taking levels, and alert conditions for entries, take-profits, and full exits.
The system adapts to changing market structure in real time, allowing traders to monitor momentum shifts, retracement strength, and phase transitions with precision. By combining structural mapping with adaptive sensitivity controls, it provides a complete framework for identifying where a trend is likely to continue, pause, or reverse.
⚪ Why This One Is Unique
Unlike traditional trend tools that simply color bars or measure moving averages, Trend Analysis Ultimate integrates retracement mapping with trend phase detection. Its framework merges contextual structure analysis (higher highs/lows or lower highs/lows) with dynamic sensitivity controls, identifying both the rhythm and the stress points within a trend.
Through a unified signal logic and adaptive retracement engine, traders can distinguish between normal pullbacks within a trend and retracements that precede reversal — all visualized with intuitive, color-coded accuracy.
█ Main features
⚪ Retracements
A retracement is a temporary move against the prevailing trend. It often signals a pause, potential continuation opportunity, or the early stages of a reversal. In this indicator, green/red retracement columns mark significant pullbacks that frequently precede new local highs/lows, continuation legs, or the end of a trend.
Key concept: Retracements appear at both continuation points and turning points. The trader’s edge is in recognizing whether the pullback is a reset of strength or the first warning that the current trend is losing control.
Bullish Retracement
Bearish Retracement
⚪ Retracements Signals
The Retracement Signals feature highlights the precise moments when a temporary counter-move within a dominant trend shows signs of exhaustion and potential continuation. It converts early momentum shifts into clear bullish or bearish setup signals.
Bullish Retracement Signal
Bearish Retracement Signal
⚪ Trend
The Trend Feature visually defines the current market regime — bullish, bearish, or neutral — by dynamically coloring bars, the indicator background, and the Confirmed Trend Columns in the lower panel. Together, these elements reflect the underlying directional bias detected by the trend engine, providing immediate context for all retracement, continuation, and entry signals.
Green bars, background, and confirmed columns → Active Bullish Trend Phase
Red bars, background, and confirmed columns → Active Bearish Trend Phase
Light or neutral bars → Transition Phase, signaling potential trend change or reduced directional strength.
█ How to Use
⚪ Major Retracements / Pullbacks
Major Bullish Retracements
Step 1: Ask Key Context Questions
When green retracement columns appear in the indicator window, ask yourself:
Are we in a bullish trend? Look for higher highs (HH) and higher lows (HL). Confirm that trendlines are pointing upward.
Is this forming a higher low? Green columns often print during pullbacks, just before price forms a higher low and the uptrend continues.
Is this a healthy correction? If price respects previous structure or the rising trendline, and the green bars begin shrinking, it indicates renewed strength and that the pullback may be ending.
Step 2: Apply Practically
If the answers above are Yes, the retracement likely represents a continuation opportunity.
Confirm an uptrend (HH/HL structure, rising trendlines).
Treat green columns as a pullback zone within that trend.
Watch for confirmation such as:
Rejection candles near support
Break of a short-term downtrend line
Volume confirming renewed buying pressure
Enter once price resumes upward movement, not during the retracement itself.
Major Bearish Retracements
Step 1: Ask Key Context Questions
When red retracement columns appear in the indicator window, ask yourself:
Are we in a bearish trend? Check if lower highs (LH) and lower lows (LL) are forming, and confirm that trendlines are pointing downward.
Is this forming a lower high? Red columns often appear during pullbacks, just before price forms a lower high and the downtrend resumes.
Is this a healthy correction? If price respects prior resistance or a falling trendline, and the red bars begin shrinking, it signals renewed weakness and that the pullback may be ending.
Step 2: Apply Practically
If the answers above are Yes, the retracement likely marks a continuation opportunity in the prevailing downtrend.
Confirm a downtrend (LH/LL structure, falling trendlines).
Treat red columns as a pullback zone within that trend.
Watch for confirmation such as:
Rejection candles near resistance
Break of a short-term uptrend line
Volume confirming renewed selling pressure
Enter once price resumes downward movement, not during the retracement itself.
⚪ Minor Retracements / Pullbacks
Minor retracements represent short, fast counter-moves within an active trend. They often occur as quick pauses or micro-corrections and are best suited for scalping or short-term continuation setups. Always align these signals with the dominant background trend and confirm direction using clear trendlines to stay on the right side of market structure.
Minor Bullish Retracements
When price is in a clear uptrend and a small pullback occurs:
Watch for short sequences of green retracement impulses (▲) or shrinking green columns on the indicator.
Treat these as quick buy-the-dip zones within the larger bullish context.
Look for confirmation from trendline support or a rejection candle before entering.
Minor Bearish Retracements
When price is trending downward and a brief rally appears:
Watch for red retracement impulses (▼) or shrinking red columns indicating weakening upward correction.
Use these as potential short re-entry zones in line with the broader downtrend.
Confirm with rejection at resistance or a break of a short-term uptrend line.
⚪ Retracements Signals
Bullish Signals
Bullish Retracement Signals appear during an active uptrend, typically within retracement phases when the market experiences a short-term pullback against the main trend. These signals are triggered when the retracement shows signs of exhaustion and the indicator detects renewed buying momentum aligned with the broader bullish structure.
They highlight potential continuation points, where the price may resume making higher highs after completing a healthy correction. This setup leverages the natural rhythm of the market — capturing the moment buyers regain control following temporary weakness.
Bearish Signals
Bearish Retracement Signals form during an active downtrend, typically within counter-trend rallies or retracement phases against the dominant bearish direction. They emerge when temporary upward movement loses strength, and the indicator identifies renewed selling pressure aligned with the main trend.
These signals often precede fresh downside continuation — when sellers reassert control and push price toward new lower lows.
⚪ Identifying the End of One Trend and the Start of Another
Every trend eventually runs out of strength. Early signs often look like a normal retracement, a routine pullback within the existing move. But when price fails to attract enough buyers or sellers to continue in the same direction, that retracement can mark the turning point where momentum shifts and a new trend begins.
When price can no longer find support in an uptrend or resistance in a downtrend, it signals exhaustion of the current phase and a possible transition into the opposite direction. The retracement columns highlight these transition zones, areas where one trend may fade and another may start forming.
When they appear, it’s important to ask:
Is the current trend mature? The longer a trend has been running, the greater the likelihood of reversal. If retracement columns show up late in a multi-leg move, treat them as early warnings.
Are there reversal signs forming? Watch for structures like double tops, double bottoms, trendline breaks, or channel violations that suggest the trend’s strength is fading.
By combining retracement columns with a clear understanding of trend structure and price action, traders can better distinguish between healthy pullbacks and the emergence of a new trend.
Bullish Trend Ends
Bearish Trend Ends
█ How It Works
⚪ Trend Phase Architecture
The indicator models directional bias through a continuously adaptive trend-mapping framework. It classifies market states as bullish, bearish, or neutral based on slope polarity and structural persistence.
Calculation: Utilizes layered regression vectors and dynamic range analysis to estimate directional gradients, blending short- and long-term components to maintain stability while remaining responsive to new motion.
⚪ Retracement Detection Engine
Retracement columns quantify counter-movements within the dominant trend, identifying deceleration, pullback depth, and phase overlap. Each bar’s classification reflects the relative strength trend progression.
Calculation: Applies trend-state comparison with phase-weighted averaging to isolate transitional motion. The resulting dual-polar columns (green/red) are normalized to a zero-centered scale for visual symmetry and precision.
⚪ Impulse & Triangle Module
Retracement impulses (▲/▼) represent local acceleration spikes during pullback phases, revealing the moment when opposing momentum reaches statistical significance.
Calculation: Identifies short-term impulse clusters through curvature mapping to isolate localized bursts of directional momentum within the retracement phase.
⚪ Entry & Signal Logic
The entry module fuses retracement data with trend-state validation, filtering signals through contextual structure and confirmation hierarchy. Only qualified impulses aligned with the dominant vector trigger actionable events.
Calculation: Integrates a composite decision function using multi-phase sensitivity weighting, differential smoothing, and state gating to separate impulsive noise from valid continuation momentum.
-----------------
Disclaimer
The content provided in my scripts, indicators, ideas, algorithms, and systems is for educational and informational purposes only. It does not constitute financial advice, investment recommendations, or a solicitation to buy or sell any financial instruments. I will not accept liability for any loss or damage, including without limitation any loss of profit, which may arise directly or indirectly from the use of or reliance on such information.
All investments involve risk, and the past performance of a security, industry, sector, market, financial product, trading strategy, backtest, or individual's trading does not guarantee future results or returns. Investors are fully responsible for any investment decisions they make. Such decisions should be based solely on an evaluation of their financial circumstances, investment objectives, risk tolerance, and liquidity needs.
Платный скрипт

Pivot Expotential Moving AveragesPivot MA's indicator is a combination of the following:
Pivot SMA
Pivot EMA's
Pullback to EMA Band
Pivot EMA's Cross Over
Pivot Double-EMA's Cross Over
Modified Pivot EMA's Cross Over
All the pivot EMA’s calculations are based on "Profiting With Pivot-Based Moving Averages" book by Frank Ochoa.
How to use it :-
One should have to refer this book for in depth usage of this indicator.
You can use the option's provided in the indicator and the signals have been generated according to the concept in this book.
Don't turn on multiple option's, it becomes clumsy to look.
Description:-
1. Pullback to PEMA Band:-
Perhaps the most trader-friendly PEMA setup is the PEMA Pull-Back, because it forces you to trade in the direction of an established trend.
In this, u get the signal when the price retraces to 13 EMA and closes above the PEMA Band.
It is like Buy the Dips & Sell the Rips. The idea of the PEMA Pull-Back is to buy the market at a discount during an uptrend, and sell the market at a premium during a down trend.
2. PEMA Cross Over :-
The PEMA Crossover fires a signal when the fast EMA crosses the slow EMA.
If the fast EMA crosses above the slow EMA, a long signal is fired; whereas, if the fast EMA crosses below the slow EMA, a short signal is fired.
Depending on your trader personality, you will have to choose the periodicities of the two moving averages to suit your taste.
Some combination of EMA's are provided.
3. Double EMA Cross Over :-
A double exponential moving average (DEMA) is basically the EMA of an EMA, meaning the output is the second derivative of the original exponential moving average.
While an EMA is a faster moving average than the SMA, the DEMA is on another level in terms of speed.
4. Modified PEMA Cross Over :-
This system is an ultra-fast PEMA crossover signal that has built-in trend confirmation.
The Modified PEMA Crossover system fires signals in the direction of the prevailing trend, as measured by a larger moving average.
For Example, Take (1,3),21 combination. In this we use 1- and 3-period pivot EMA’s for crossovers, and use a 21-period pivot EMA for trend confirmation.
1 and 3 period EMA's are not shown in the chart, Only 21 EMA and signals are shown for clear view.
Therefore, this system will only allow bullish crossover signals to fire when price is above the 21-period pivot EMA, and will only allow bearish crossover signals to fire when price is below the 21-period average.
In essence, the results are usually highly qualified “buy the dip, and sell rip” type of opportunities.
Disclaimer :-
The PEMA setups that are covered in this indicator offer some of the ways to approach the market using moving averages.
Not all setups and styles of trading will fit all traders, no matter how profitable the approach.
You must use what fits your trader profile and your trading approach.
Thank You ..

Multi TimeFrame (MTF) Trend StrengthCalculate and display simple multi timeframe (3 timeframe) trend strength using heikin ashi.

Confirmation (Expo)
Confirmation (Expo) is a trading confirmation tool that can confirm any indicator, trend, setup, signal, or strategy. Once you have chosen the input source (any indicator) you can use the tool to confirm the trend, trend strength, overbought/oversold areas, retracements, and reversals. This tool is built for traders that already have a strategy or preferred indicator that they want to confirm. As a default, the indicator oscillates between overbought (or strong positive trend)/oversold (or strong negative trend). However, depending on the settings and input source many different layouts can occur.
Real-Time Alerts
No Repainting
Works on any market and in any timeframe
HOW TO USE
To confirm any indicator, trend, setup, signal, or strategy
INDICATOR IN ACTION
4 hour - chart
I hope you find this indicator useful , and please comment or contact me if you like the script or have any questions/suggestions for future improvements. Thanks!
I will continually work on this indicator, so please share your experience and feedback as it will enable me to make even better improvements. Thanks to everyone that has already contacted me regarding my scripts. Your feedback is valuable for future developments!
-----------------
Disclaimer
Copyright by Zeiierman.
The information contained in my scripts/indicators/strategies/ideas does not constitute financial advice or a solicitation to buy or sell any securities of any type. I will not accept liability for any loss or damage, including without limitation any loss of profit, which may arise directly or indirectly from the use of or reliance on such information.
All investments involve risk, and the past performance of a security, industry, sector, market, financial product, trading strategy, or individual’s trading does not guarantee future results or returns. Investors are fully responsible for any investment decisions they make. Such decisions should be based solely on an evaluation of their financial circumstances, investment objectives, risk tolerance, and liquidity needs.
My scripts/indicators/strategies/ideas are only for educational purposes!
ACCESS THE INDICATOR
• Contact me on TradingView or use the links below

Trend Algo (Zeiierman)█ Overview
Trend Algo (Zeiierman) converts raw price movement into a cohesive, volatility-aware trend map. Rather than static moving averages, it builds an adaptive trend core that responds to market state changes, then layers regime-sensitive clouds (Infinite Sky) and horizon-bounded channels (HorizonX), plus precise trend-change and continuation signals. The result is a clean framework for reading direction, timing pullbacks, and validating momentum.
The indicator visualizes the active trend line, adaptive clouds, and stateful signals to reveal transition zones, trend acceleration, and exhaustion. It suits intraday execution, swing confirmations, and structural regime assessment.
⚪ Why This One Is Unique
Unlike conventional trend tools, this version combines volatility-normalized trend estimation, AI-style regime clustering, and horizon-bounded support/resistance channels. Its framework uses multi-phase smoothing, adaptive width scaling, and state detection that aligns entries and continuations with current market inertia—reducing whipsaw while preserving responsiveness.
█ Main features
⚪ Dynamic Clouds
The Dynamic Trend Line provides a stabilized, noise-aware trajectory of price, color-coded by directional bias. Two cloud systems overlay the core trend:
Infinite Sky (AI) — a regime-aware cloud that distinguishes fast vs. slow trend states.
HorizonX — adaptive channels that operate as dynamic support/resistance and define trend boundaries.
⚪ Candle Coloring
The candle coloring is designed to highlight trend momentum peaks, allowing you to instantly recognize when the trend is accelerating or slowing down. This visual feedback makes it easier to interpret the strength and speed of directional moves directly on the chart, seamlessly complementing the Dynamic Trend Line and Cloud systems.
⚪ Trend Change Signals & Trend Continuation Signals
The main signals are the Trend Change Signals , designed to trigger when the current trend structure begins to shift its state. These signals give you an instant sense of when a potential trend reversal or directional change might occur.
To complement them, we’ve added Trend Continuation Signals , which only activate within an established trend. These signals confirm the current direction and indicate that the trend is gaining strength and preparing for another move in the same direction.
⚪ Trend Line
Two types of trend lines are integrated: Stability and Dynamic.
The Stability Line follows the current price action in a smooth, drift-like manner — staying closer to price to act as a faster support and resistance zone.
The Dynamic Line adapts to volatility, ensuring that continuous movements within the trend are taken into account. This helps traders stay aligned with the trend and capture extended moves during periods of higher market activity.
█ How to Use
⚪ Trend Changes
Trend Change Signals appear when the current trend structure begins to shift, signaling a potential reversal or directional transition. These signals help traders anticipate moments when momentum weakens or changes direction, offering early insight into possible turning points in the market. Combine Trend Change Signals with Candle Coloring or Cloud behavior to confirm entries and strengthen trend reversal validation.
⚪ Trend Continuations
Trend Continuation Signals trigger within an established trend, confirming that the current direction remains strong. They often appear after pullbacks or pauses, suggesting that the market is ready for another move in the same direction. These signals work best when paired with the Dynamic Trend Line, allowing traders to stay confidently aligned with powerful ongoing trends.
⚪ Support and Resistance
The Stability Trend Line acts as a reactive support and resistance guide, staying close to price and highlighting areas where market reactions are most likely to occur. It offers traders a clear view of short-term structure and helps identify potential bounce or rejection zones with precision.
The Dynamic Trend Line adapts to volatility, forming flexible support and resistance zones that expand during strong momentum and contract during quieter phases, keeping the visual structure balanced and responsive to changing market conditions.
HorizonX defines the outer adaptive boundaries of the trend. These dynamic channels operate as broader support and resistance frameworks, helping traders anticipate trend exhaustion or continuation zones beyond the immediate price action.
The Infinite Sky (AI) cloud adds a regime-aware layer that distinguishes fast and slow trend states, visually framing the strength of support or resistance regions as they evolve and allowing traders to read both momentum and structure in a single glance.
█ How It Works
⚪ Dynamic Trend Core
A volatility-normalized estimator generates the primary trajectory and color state, balancing stability vs. agility by adapting to dispersion and displacement.
Calculation: Multi-phase weighted smoothing with volatility-scaled adjustments and adaptive phase control to minimize lag while preserving curvature.
⚪ Infinite Sky (AI Regime Cloud)
Differentiates fast vs. slow trend states and paints a regime-aware cloud that guides timing and risk.
Calculation: Windowed return modeling (with optional consolidation), two-pole response filtering, and distribution-center clustering to classify regimes and modulate the envelope.
⚪ HorizonX Trend Channels
Defines dynamic support/resistance “horizons” that expand/contract with conditions and filter counter-trend noise when strong-trend mode is enabled.
Calculation: A volatility-aware core that evolves with changing price dynamics, maintaining precision across all market conditions.
⚪ Trend Line & Continuations
A fast reaction line confirms pullbacks and validates continuation only when aligned with prevailing bias and structure.
Calculation: Short-horizon smoothing with phase-managed weighting, slope/position gating, and context checks against regime and horizon levels.
⚪ Impulse Detection
Identifies statistically meaningful bursts that precede expansion or warn of exhaustion after extended runs.
Calculation: Nonlinear impulse-response mapping emphasizing second-order changes in directional energy while suppressing micro-noise.
⚪ Trend Bands
Upper/lower bands visualize the active envelope for timing adds, trims, or exits within trend.
Calculation: Percentile-guided banding blended with adaptive anchors to retain structural relevance through regime shifts.
⚪ Bar Color Integration
Bars can inherit trend/gradient context to make state shifts obvious at a glance.
Calculation: Algorithmic gradient model integrating directional momentum intensity to render bar coloration in sync with market flow.
-----------------
Disclaimer
The content provided in my scripts, indicators, ideas, algorithms, and systems is for educational and informational purposes only. It does not constitute financial advice, investment recommendations, or a solicitation to buy or sell any financial instruments. I will not accept liability for any loss or damage, including without limitation any loss of profit, which may arise directly or indirectly from the use of or reliance on such information.
All investments involve risk, and the past performance of a security, industry, sector, market, financial product, trading strategy, backtest, or individual's trading does not guarantee future results or returns. Investors are fully responsible for any investment decisions they make. Such decisions should be based solely on an evaluation of their financial circumstances, investment objectives, risk tolerance, and liquidity needs.
Платный скрипт

Trend analysis - Take Profit (Expo)Trend analysis - Take Profit (Expo)
DESCRIPTION
Trend analysis - Take Profit (Expo) indicator is developed to visualize ‘Lock In Profits -points' in trends. It’s a necessity for a professional trader to continuously ‘Lock In Profit’ in order to grow their balance and to reduce their risk. In fact, research shows that exits have more impact on the results than any other factor (Tharp, 2006). So when the indicator shows a ‘TP’ - point, start to lock in some of your profit and continuously do so on every TP - point and exit the trade when a circle is shown.
The indicator does also visualizes the current trend by the color of the cloud. Green color = positive trend. Red color = negative trend.
The professional trader will have the possibility to adjust the sensitivity of the TP - point as well as the length of the trend calculation.
HOW TO USE
1. Use this indicator to identify when to Lock In Profits in trends.
2. Use the indicator to identify trends.
3. Use the indicator to identify a trend shift.
INDICATOR IN ACTION
BTCUSD
BTCUSD
EURUSD
BRENT
EURGBP
The indicator works with RENKO, HEIKIN ASHI and with KAGI charts as well.
I hope you find this indicator useful, and please comment or contact me if you like the script or have any questions/suggestions for future improvements. Thanks!
I will continue to work on this indicator, so please share your experience and feedback with me so that I can continuously improve it. Thanks to everyone that have contacted me regarding my scripts. Your feedback is valuable for future developments!
ACCESS THE INDICATOR
• Contact me on TradingView or use the links below
-----------------
Disclaimer
Copyright by Zeiierman.
The information contained in my scripts/indicators/ideas does not constitute financial advice or a solicitation to buy or sell any securities of any type. I will not accept liability for any loss or damage, including without limitation any loss of profit, which may arise directly or indirectly from use of or reliance on such information.
All investments involve risk, and the past performance of a security, industry, sector, market, financial product, trading strategy, or individual’s trading does not guarantee future results or returns. Investors are fully responsible for any investment decisions they make. Such decisions should be based solely on an evaluation of their financial circumstances, investment objectives, risk tolerance, and liquidity needs.
My scripts/indicators/ideas are only for educational purposes!
