Volume Candle DistributionThe Volume Candle Distribution (VCD) indicator examines the volume distribution across candle type, distinguishes between neutral, bullish and bearish volume pressures.
The VCD indicator calculates and displays the cumulative volume of bullish and bearish candles over a user-defined period, aggregates the volumes of bullish and bearish candles separately and plots them.
Bullish Volume : This is accumulated when the closing price of a candle is higher than the opening price, the VCD adds up the volume of bullish candle within the user-defined period, and consequently subtracts the volume when bearish candle.
Bearish Volume : Conversely, when the closing price is lower than the opening price, the volume of that candle is considered bearish, the VCD sums the volume of bearish candles over the same period, and consequently subtracts the volume when bullish candle.
Neutral Volume : In cases where the opening and closing prices are equal, the volume of that candle is treated as neutral, and the VCD subtracts the volume from both candles.
The 3 Simple Moving Average (SMAs) included is based volume calculated separately for both bullish and bearish volume data, and the sum of them.
Профиль объёма

Volume Heatmap 2024 | NXT2017 Christmas EditionHi big players around the world,
I wish you a merry christmas time.
Today I have a nice present for you: a new volume heatmap indicator for free using!
HISTORY
My first volume heatmap project got a lot of feedback and a big demand. You can find it here:
In this time pinescript version 4 was the newest one and I worked the first time with arrays.
Today we have pinescript version 5 and some new features. This is why I tried again with matrix function and the results are better than I expected.
HOW IT WORKS
The indicator calculates similar like the volume profile. It looks back and every volume where the close price is on the same row area, the volume will cumulated. How much rows the new chart view is showing, you can choose manually.
The mind behind this is to find high volume levels, where high volume catch the price in a range or get function as support/resistance line.
PICTURES
I hope it helps for your trading. You are welcome to give some comments.
Merry christmas and best regards
NXT2017

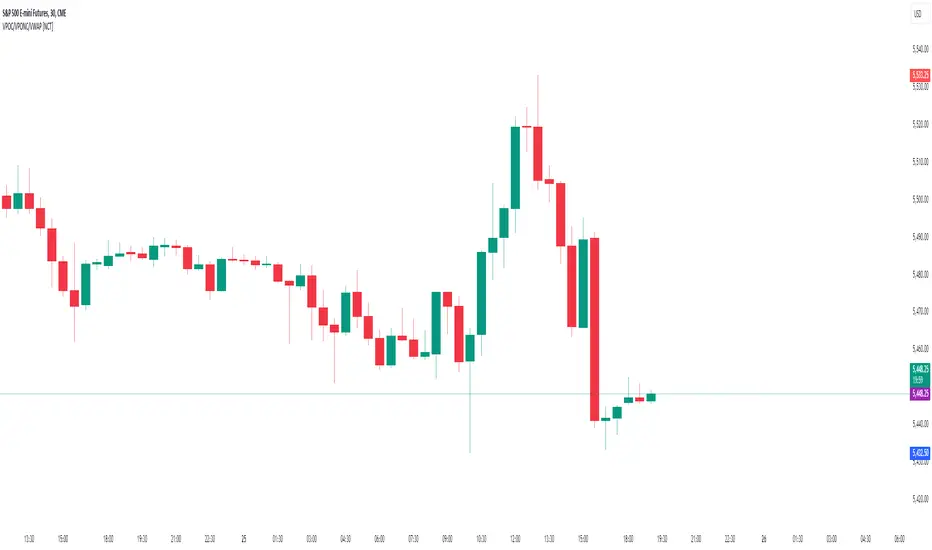
Volume Points of Control and No Control [NariCapitalTrading]Overview:
The "Volume Points of Control and No Control" (VPOC/VPONC) is a trading indicator/concept I designed to identify key price levels based on volume activity. It shows (on the price label on the y-axis) where there was the most (red) and the least (blue) volume over a specified lookback period. Read below for interpretation.
Key Features:
Identifies key price levels based on volume
Customizable lookback period and trade timeframe
Plots Volume Point of Control (VPOC) and Volume Point of No Control (VPONC)
Inputs and Calculations:
Custom Trade Timeframe: Allows users to set the desired timeframe for analysis (e.g., Daily, Weekly).
Lookback Period: Users can specify the period over which to analyze volume data.
VPOC Calculation: Determines the price level with the highest volume within the lookback period.
VPONC Calculation: Finds the price level with the lowest volume within the lookback period.
Indicator Usage:
The VPOC is considered a significant level where traders have shown the most interest, often acting as a strong support or resistance level. The VPONC, conversely, is a concept I made up. It represents a price level where 1) in an trending market, this price was accepted quickly, thus suggesting continuation of an trend. 2) price retracements will typically revisit thinly-traded price areas, the VPONC can sometimes signal an area of support in a downtrend.
Chart Representation:
VPOC Label: Plotted on the y-axis in red, indicating the price level with the highest volume.
VPONC Label: Displayed on the y-axis in blue, showing the price level with the least volume.
These labels are dynamically updated based on the user-specified lookback period and trade timeframe.
Footprint Chart + Volume ProfileFootprint charts provide volume information to candlestick charts. This indicator specifically provides the quantity of Market Orders executed on each side of the Order Book, thereby showing you the number of contracts that had hit the bid or the offer - and it does so on each bar.
In addition, it visualises a Volume Profile for each bar, providing you an even better visualisation, contrasted to that which renders the numbers alone.
This Footprint Chart calculates executed orders by getting the change in volume for every price move and pooling them on their corresponding "tick bucket". Their specific "tick bucket" is calculated on the nearest "tick", the size of which you will provide by setting the "Tick Size/ Increment" to whichever tick size you need .
For instance, volume changes on a price of 10.4 on a 1 tick Footprint Chart will be recorded as part of the nearest whole number(10), while on a 3 tick Footprint Chart, it will be recorded as part of 9 as it is the nearest multiple of 3.
Calculating the "tick bucket" this way is most conservative, however, if you would like it calculated differently — Having the volume changes recorded on the succeeding tick, e.g. Recording 10.4 as 12 on a 3 tick Footprint Chart. Simply set the "Tick Basket Assignment" to "Next Tick", While setting the same to "Previous Tick" records volume changes on the preceding tick. Default is "Nearest Tick".
How to read the Footprint Chart?
This Footprint Chart depicts a portion of the Depth of Market, arranged in such a way that the left side represents the bid, while the right side represents the ask. It is therefore natural that orders hitting the bid (Market Sells) are to be placed on the Left Side of the chart while orders hitting the ask (Market Buys) are to be placed on the Right Side. This way, you can visualise how the current price came to be, as well as observe with the several order flow analysis concepts and ideas you can apply. In summary, numbers on the Left represents Sell Orders and numbers on the Right represents Buy Orders.
If, however, you wish to see only the total volume that transacted within the bar, you may do so by toggling the "Split Buy and Sell" option.
Footprint Chart showing only the total volume:
Furthermore, this chart has its own candles, the width of which can be adjusted accordingly.
Volume Profile
This Footprint Chart offers a Stacked Volume Profile and an Unstacked Volume Profile, the former renders a Volume Profile which compares the buys from the sells, the better to visualise levels of activity, the latter renders a standard Volume Profile which shows the total volume that transacted on a price tick.
The type of Volume Profile that this Footprint Chart renders is similar to that of a Periodic Volume Profile, which renders Volume Profiles for every bar on the chart. Furthermore, the width of each Volume Profile bar of this Footprint Chart is relative to the largest volume transacted on the current session, the session beginning from the point you have opened the Footprint Chart until the 500th bar, capped for optimisational purposes, and shall adjust the session start accordingly once this limit had been reached. The Volume Profile bars' width will therefore change agreeably to each significant volume update, and sized relatively with that of the others.
Optimisation
This Footprint Chart utilises several drawings and calculations for attaining its visuals, the arrangement of which makes it more pleasing and easier to understand. Several optimisations have been implemented within the code, e.g. utilising queues, however, if you wish for it to be even more optimised, you can use an "Unstacked" Volume Profile, using larger tick sizes, as well as using 0 decimal placements for the Footprint Chart.
Furthermore, deselecting "Use Stacked Bars" will allow more boxes to be drawn, and will double the amount of boxes the volume profile can use.
Limitations
No historical tick data have yet been made available for use and so this Footprint Chart only has realtime data at its disposal. Historical footprints are therefore not rendered, the boundary of which is delineated by a vertical broken line.
Tips
This Footprint Chart is best viewed on a chart of its own, and it is therefore ideal to clear the chart of other candles by hiding them or utilising a line chart alternatively . In addition, stretch the time scale to its utmost capacity, the better to see properly the Volume Profile, as well as stretch the price scale to a proper height, the better to read the footprint volumes inscribed on the indicator.
Warnings
Changing settings may cause the Footprint Chart to reset. If, in case you have been accumulating Footprint Charts and wish to change some settings for the benefit of your charting, it is best to take a snapshot of your chart prior, for recent changes may cause resets to occur.

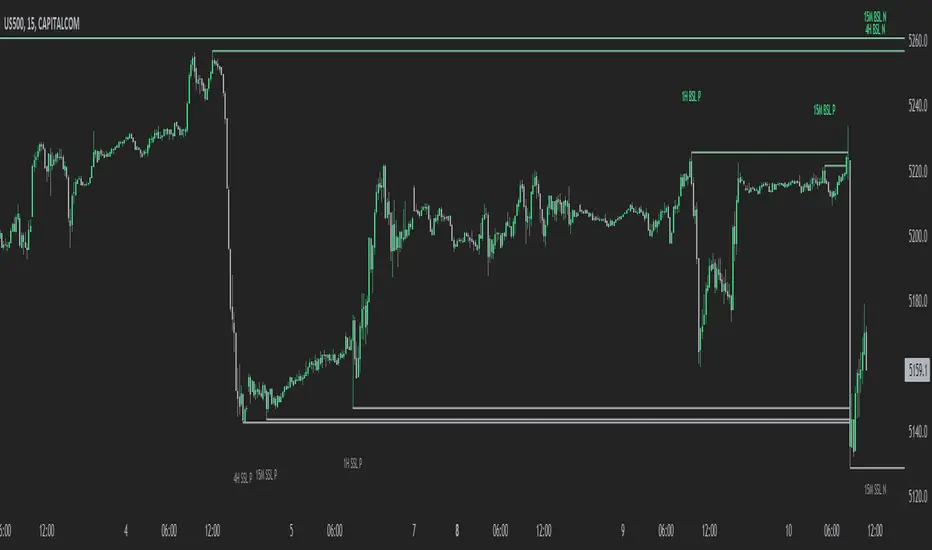
MTF External Range Liquidity - SMC IndicatorsThe Multi-Timeframe External Range Liquidity highlights possible “Key Liquidity Zones” above and below Short-Term highs and lows. Allowing for the filtering out of shorter-term swings and easily identifying levels for possible “liquidity runs” or “stop runs”.
Purged Liquidity
This shows areas where the price has already reached above previous key highs or below previous key lows. Recognizing “Purged Liquidity” areas is useful for historical analysis and understanding prior liquidity-driven movements.
Open Liquidity
These mark possible or potential Open Liquidity Zones where the price might reach above or below short-term key highs and lows.
Multi-Timeframe Analysis
The Multi Timeframe Feature allows traders to have all “key Liquidity Levels” from higher and lower timeframes relative to the current timeframe. (Weekly and down to the 1-Minute Chart) while trading in real-time allowing the trader to keep the higher time frame “levels” in mind when trading on lower time frames.
1W BSL & 1W SSL indicate levels of transposed from the Weekly timeframe to the Daily timeframe or lower.
1D BSL & 1D SSL indicate levels of transposed from the Daily timeframe to the 4H timeframe or lower.
4H BSL & 4H SSL indicate levels of transposed from the 4H timeframe to the 1H timeframe or lower.
1H BSL & 1H SSL indicate levels of transposed from the 1H timeframe to the 15M timeframe or lower.
15M BSL & 15M SSL indicate levels of transposed from the 15M timeframe to the 5M timeframe or lower.
5M BSL & 5M SSL indicate levels of transposed from the 5M timeframe to the timeframes lower than 5M.
How This Can Help with Analysis
Timing Entries
This tool can be used to look for possible entry levels by looking at where the last run on liquidity (Purged Liquidity) above a previous key high or low was. The trader would use this indicator by waiting until the liquidity is purged before looking for a possible trade setup.
This helps in waiting for entries and may avoid or reduce the number of entries where the trade would get stopped due to an early entry.
Setting Possible Targets
This indicator can be used to look for higher time frame “Open Liquidity” key levels above short-term highs or below short-term lows as potential targets.
Other Key Features
Alerts on selected time frame “key levels”
Choose to show and hide levels on any timeframe.
Choose the number of the Purged and Open Liquidity desired to show on the chart.
Highlights the Daily, Weekly, and Monthly Highs and Lows.
Liquidity composition / quantifytools- Overview
Liquidity composition divides each candle into sections that are used to display transaction activity at price. In simple terms, an X-ray through candle is formed, revealing the orderflow that built the candle in greater detail. Liquidity composition consists of two main components, lots and columns. Lots and columns can be used to visualize user specified volume types, currently supporting net volume and volume delta. Lots and columns can be used to visualize same or different volume types, allowing a combination of volume footprint, volume delta footprint and volume profile in one single view. Liquidity composition principally works on any chart, whether that is equities, currencies, cryptocurrencies or commodities, even charts with no volume data (in which case volatility is used to approximate transaction activity). The script also works on any timeframe, from minute charts to monthly charts. Orderflow can be observed in real-time as it develops and none of the indications are repainted.
Example: Displaying same volume types on lots and columns
Example: Displaying different volume types on lots and columns
Liquidity composition supports user specified derivative data, such as point of control(s) and net activity coloring. Derivative data can be calculated based on either net volume or volume delta, resulting in different highlights.
With net volume, volume delta and derivative data in one view, key orderflow events such as delta imbalances, high volume nodes, low volume nodes and point of controls can be used to quickly identify accumulation/distribution, imbalances, unfinished/finished auctions and trapped traders.
Accessing script 🔑
See "Author's instructions" section, found at bottom of the script page.
Key takeaways
- Liquidity composition breaks down transaction activity at price, measured in net volume or volume delta
- Developing activity can be observed real-time, none of the indications are repainted
- Transaction activity is calculated using volumes accrued in lower timeframe price movements
- Lots and columns can be used to display same or different volume types (e.g. volume delta lots and net volume columns) in single view
- Users can specify derivative data such as volume delta POCs, net volume POC and net activity coloring
- For practical guide with practical examples, see last section
Disclaimer
Orderflow data is estimated using lower timeframe price movement. While accurate and useful, it's important to note the calculations are estimations and are not based on orderbook data. Estimates are calculated by allotting volume developing on lower timeframe chart to its respective section based on closing price. Volume delta (difference between buyers/sellers) is calculated by subtracting down move volumes (sell volume) from up move volumes (buy volume). Accuracy of the orderflow estimations largely depends on quality of lower timeframe chart used for calculations, which is why this tool cannot be expected to work accurately on illiquid charts with broken data.
Liquidity composition does not provide a standalone trading strategy or financial advice. It also does not substitute knowing how to trade. Example charts and ideas shown for use cases are textbook examples under ideal conditions, not guaranteed to repeat as they are presented. Liquidity composition should be viewed as one tool providing one kind of evidence, to be used in conjunction with other means of analysis.
- Example charts
Chart #1: BTCUSDT
Chart #2: EURUSD
Chart #3: ES futures
- Calculations
By default, size of sections and lower timeframe accuracy are automatically determined for all charts and timeframes. Number of lower timeframe price moves used for calculating orderflow is kept at fixed value, by default set to 350. Accuracy value dictates how many lower timeframe candles are included in the calculation of volume at price. At 350, the script will always use 350 lower timeframe price movements in calculations (when possible). When calculated dynamic timeframe is less than 1 minute, the script switches to available seconds based timeframes. Minimum dynamic timeframe can be capped to 1 minute (as seconds based timeframes are not available for all plans) or dynamic timeframe can be overridden using an user specified timeframe.
Example: Calculating dynamic lower timeframe
Main chart: 4H / 240 minutes
Accuracy value: 100
Formula: 240 minutes / 100 = 2.4 minutes
Timeframe used for calculations = 2 minutes
Section size is automatically determined based on typical historical candle range, the bigger it is, the bigger the section size as well. Like dynamic timeframe, automatic section size can be manually overridden by user specified size expressed in ticks (minimum price unit). Users can also adjust sensitivity of automatic sizing by setting it higher (smaller sections, more detail and more noise) or lower (less sections, less detail and less noise). Section size and dynamic timeframe can be monitored via metric table.
Volume at price is calculated by allotting volume associated with a lower timeframe price movement to its respective section based on closing price (volume is stored to the section that covers closing price). When used on a chart with no volume data, volatility is used instead to determine likely magnitude of participation. Volume delta (difference between buyers/sellers) is calculated by subtracting down move volumes (sell volume) from up move volumes (buy volume). Volumes accrued in sections are monitored over a longer period of time to determine a "normal" amount of activity, which is then used to normalize accrued volumes by benchmarking them against historical values.
Volume values displayed on the left side represent how close or far volume traded at given section is to an extreme, represented by value of 10 . The more value exceeds 10, the more extreme transaction activity is historically. The lesser the value, the less extreme (and therefore more typical) transaction activity is. Users can adjust sensitivity of volume extreme threshold, either by increasing it (more transaction activity is needed to constitute an extreme) or decreasing it (less transaction activity is needed to constitute an extreme).
Example: Interpreting volume scale
0 = Very little to no transaction activity compared to historical values
5 = Transaction activity equal to average historical values
10 = Transaction activity equal to an extreme in historical values
10+ = The more transaction activity exceeds value of 10, the more extreme it is historically
Accuracy of orderflow data largely depends on quality of lower timeframe data used in calculations. Sometimes quality of underlying lower timeframe data is insufficient due to suboptimal accuracy or broken lower timeframe data, usually caused by illiquid charts with gaps and inconsistent values. Therefore, one should always ensure the usage of most liquid chart available with no gaps in lower timeframe data. To combat poor orderflow data, a simple data quality check is conducted by calculating percentage of sections with volume data out of all available sections. Idea behind the test is to capture instances where unusual amount of sections are completely empty, most likely due to data gaps in LTF chart. E.g. 90% of sections hold some volume data, 10% are completely empty = 90% data quality score.
Data quality score should be viewed as a metric alerting when detail of underlying data is insufficient to consider accurate. When data quality score is slightly below threshold, lower timeframe chart used for calculations is likely fine, but accuracy value is too low. In this case, one should increase accuracy value or manually override used timeframe with a smaller one. When data quality score is well below threshold, lower timeframe chart used for calculations is likely broken and cannot be fixed. In this case, one should look for alternative charts with more reliable data (e.g. ES1! -> SPY, BITSTAMP:BTCUSD -> BINANCE:BTCUSDT).
Example : When insufficient data quality scores can/cannot be fixed
- Derivative data
Point of control
Point of control, referring to point in price where transaction activity is highest, can be calculated based on the volume type of lots or columns (based on net volume or volume delta). Depending on the calculation basis, displayed point of controls will vary. POC calculated based on net volume is no different from traditional POC, it is simply the section with highest amount of transaction activity, marked with an X. When calculating POC based on volume delta, the script will highlight two point of controls, named leading and losing point of control . Leading POC refers to lot with highest amount of volume delta, marked with an X. If leading POC was net buy volume, losing POC is marked on section with highest net sell volume, marked with S respectfully. Same logic applies in vice versa, if leading POC is net sell volume, losing POC is marked on highest buy volume section, using the letter B.
Net activity
Similarly to point of control calculation, net activity can be calculated based on either volume types, lots or columns. When calculating net activity based on net volume, candles will be colorized according to magnitude of total volume traded. When calculating net activity based on volume delta, candles will be colorized according to side with most volume traded (buyers or sellers). Net activity color can be applied on borders or body of a candle.
- Visuals
Lots, columns, candles and POCs can be colorized using a fixed color or a volume based dynamic color, with separate color options for buy side volume, sell side volume and net volume.
Metric table can be offsetted horizontally or vertically from any four corners of the chart, allowing space for tables from other scripts.
Table sizes, label sizes and offsets for visuals are fully customizable using settings menu.
- Practical guide
OHLC data (candles) is a simple condensed visualization of an auction market process. Candles show where price was in the beginning of an auction period (timeframe), the highest/lowest point and where price was at the end of an auction. The core utility of Liquidity composition is being able to view the same auction market process in much greater detail, revealing likely intention, effort and magnitude driving the process. All basic orderflow concepts, such as ones presented by auction market theory can be applied to Liquidity composition as well.
The most obvious and easy to spot use case for orderflow tools is identifying trapped traders/absorption, seen in high transaction activity at the very highs/lows of a candle or even better, at wicks. High participation at wicks can be used to identify forced orders absorbed into limit orders, idea behind being that when high transaction activity is placed at a wick, price went one direction with a lot of participation (high effort) and came right back up (low impact) within the same time period.
Absorption can show itself in many ways:
- Extreme buy volume sections at wick highs or buy side POC at wick highs
- Multiple, clustered high buy volume sections (but not extreme) at wick highs
- Positive net volume delta into a reversal down
- Extreme sell volume sections at wick lows or sell side POC at wick lows
- Multiple, clustered high sell volume sections (but not extreme) at wick lows
- Negative net volume delta into a reversal up
- Extreme net volume sections at or net volume POC at wick highs/lows
- Extreme net volume into a reversal up/down
For accurate analysis, orderflow based events should be viewed in the context of price action. To identify absorption, it's best to look for opportunities where an opposing trend is clearly in place, e.g. absorption into highs on an uptrend, absorption into lows on a downtrend. When price is ranging without a clear trend or there's no opposing trend, extreme activity at an extreme end of a candle might be aggressive participants attempting to initiate a new trend, rather than getting absorbed in the same sense. With enough effort put into pushing price to the opposite direction at overextended price, a shift in trend direction might be near.
Price action based levels are a great way to get context around orderflow events. Simple range highs/lows as a single data point serve as a high probability regimes for reversals, making them a great point of confluence for identifying trapped traders.
Low to zero volume sections can be used to identify points in price with little to no trading, leaving a volume null/void behind. Typically sections like these represent gaps on a lower timeframe chart, which can be used as reference levels for targets and support/resistance.
Net volume can be used for same purposes as above, but for determining general intention of market participants it's a much more suitable tool than volume delta. According to auction market theory, low/no participation is considered to reject prices and high participation is considered to accept prices. With this concept in mind, unfinished auctions occur when participation is high at highs or high at lows, idea behind being that participants are showing willingness and interest to trade at higher or lower prices. Auction is considered finished when the opposite is true, i.e. when participants are not showing willingness to trade at higher/lower prices. In general, direction of unfinished auctions can be expected to continue shortly and direction of unfinished auctions can be expected to hold.
While shape of volume delta and net volume are usually similar, they're not the same thing and do not represent the same event under the hood. Volume delta at 0 does not necessarily mean participation is 0, but can also mean high participation with equal amount of buying and selling. With this distinction in mind, using volume delta and net volume in tandem has the benefit of being able to identify points in price with a lot of up and down price movement packed into a small area, i.e. consolidation. Points in price where price hangs around for an extended period of time can be used to identify levels of interest for re-tests and breakout opportunities.

Volume Profile PlusThis indicator provides a high-resolution and high-precision implementation of Volume Profile with flexible range settings. Its key features include:
1. Support for a high resolution of up to 2,500 rows.
2. Capability to examine lower timeframe bars (default 5,000 intra-bars) for enhanced precision.
3. Three range modes — "Visible Range", "Anchored Range", and "All Range".
4. Highlighting of Point of Control and Value Area.
5. Extensive customization options allowing users to configure dimensions, on-chart placements, and color schemes.
🔵 Settings
The settings screen, along with the explanations for each setting, is provided below:
🔵 High Resolution using Polyline
Inspired by @fikira, this indicator utilizes the newly introduced `polyline` type in PineScript to plot the volume profile. It employs a single polyline instance to represent the entire histogram. With each polyline instance supporting up to 10,000 points and each histogram row requiring 4 points, this indicator can accommodate 2500 rows, resulting in a significantly higher resolution compared to conventional volume profile indicators that use `line`s or `box`es to draw the histogram.
🔵 High Precision Data-binning using Lower Timeframe Data
Conventional volume profile indicators often face one or both of the following limitations:
1. They only consider volume within the chart's current timeframe.
2. They assign each bar's total volume to a single price bucket based on the bar's average price, rather than distributing volume across multiple price buckets.
As a result, when the number of bars in the chart is low, those indicators may provide imprecise results, making it difficult to accurately identify significant volume nodes and the point of control.
To address these limitations and enhance accuracy, this indicator examines data from lower timeframes and distributes the volume to fine-grained price buckets. It intelligently selects an appropriate lower timeframe to ensure precise output while complying with a maximum specified number of bars to maintain good performance.
🔵 Three Range Modes
This indicator offers users the flexibility to choose from three range modes:
1. Visible Range (Default Mode): In this mode, the volume profile calculation begins at the time of the left-most bar displayed in the current viewport. As the user scrolls through the viewport, the volume profile updates automatically.
2. Anchored Range: This mode allows the user to set the start time either by using the datetime input boxes or by dragging the anchor line on the chart.
3. All Range: In this mode, the volume profile calculation is based on all the historical bars available in the chart.

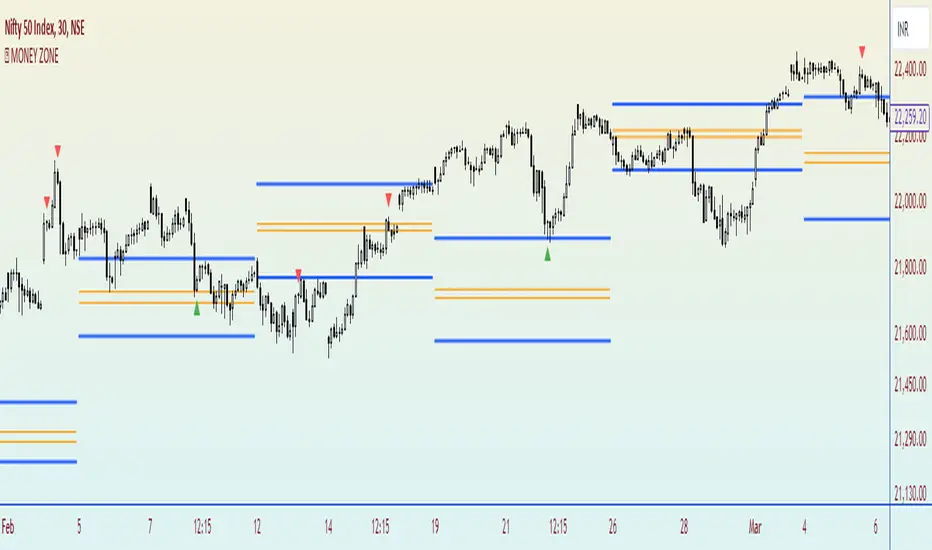
MONEY ZONEA volume profile is an advanced charting tool that displays the traded volume at different price levels over a specific period. It helps you visualize where the majority of trading activity has occurred.
This indicator is a Market Profiling tool used to analyse the Point of Control (POC) and Value Area (VAH/VAL) on the daily, weekly and monthly timeframes. It also optionally displays historical Value Areas to help find confluence with past data.
The Point of Control describes the price level where the most volume was traded. A Naked Point of Control (also called a Virgin Point of Control) is a previous POC that has not been traded.
The Value Area is a range of prices where the majority of trading volume took place on the prior trading day. In specific, this area is the range where 70% of the prior day’s volume happened. The value area is approximately one standard deviation above and below the average highest volume price. With this knowledge, there are specific probabilities of market behavior we can understand to digest the value area. The value area gives us an idea of where the smart money is playing ball and where the institutions are guiding the market. From this data, we can derive intra-day strategies that capitalize on market behavior.
🔹 Point of Control (PoC)
Point of Control (POC) – The price level for the time period with the highest traded volume
🔹 Value Area (VA)
Value Area (VA) – The range of price levels in which the specified percentage of all volume was traded during the time period.
Oscillator Volume Profile [Trendoscope®]The Oscillator Volume Profile indicator is designed to construct a volume profile based on predefined oscillator levels. It integrates volume data with oscillator readings to offer a unique perspective on market dynamics.
🎲 Selectable Oscillators:
Users can select from an array of oscillator options for the basis of the volume profile, including:
Relative Strength Index (RSI)
Chande Momentum Oscillator (CMO)
Center of Gravity (COG)
Money Flow Index (MFI)
Rate of Change (ROC)
Commodity Channel Index (CCI)
Stochastic Oscillator (Stoch)
True Strength Index (TSI)
Williams %R (WPR)
The length parameters - Length, Fast Length, Slow Length allows users to define the period over which the chosen oscillator is calculated, tailoring the sensitivity of the indicator to their trading strategy.
🎲 Dynamic Overbought/Oversold Ranges:
This indicator enhances traditional concepts by introducing dynamic overbought and oversold levels. These adaptable thresholds are calculated using various methods, including:
🎯 Highest/Lowest Range Method : This method establishes the range based on the highest and lowest values of the oscillator within the last N bars.
🎯 Moving Average Range Method : The range is derived from a moving average of the oscillator, providing a smoothed threshold that reflects more recent market conditions.
In addition to these methods, the indicator incorporates a unique 'Sticky Border' feature:
🎯 Sticky Border: With this option enabled, the dynamic ranges maintain their levels until the oscillator breaks out of the range. Once a breakout occurs, the levels are recalculated and updated. This mechanism ensures that the borders remain consistent and relevant, only adjusting to significant market movements that warrant a recalculation.
Users can select their preferred method for determining dynamic ranges, allowing for a customized approach that aligns with their analysis and trading strategy. The sticky border feature further refines this functionality, offering continuity until a decisive market move occurs.
🎲 Volume Profile Calculation Parameters:
🎯 Trend Filter: The indicator provides a versatile trend filter with four selectable options:
Uptrend: The volume profile is calculated when the oscillator indicates an uptrend.
Downtrend: The volume profile is calculated when the oscillator indicates a downtrend.
Any: The volume profile is calculated regardless of the trend.
External: Users can input values from an external indicator. The volume profile is then calculated only when the external indicator's value is non-zero, integrating external analysis into the volume profile construction.
🎯 Precision: Users have the option to define the precision for calculating the volume profile, which is crucial due to the varying scales of different oscillators (e.g., some oscillators range from 0 to 100, while others from -1 to 1). Selecting an appropriate precision ensures that the volume profile is accurately aligned with the minimal price range significant to the chosen oscillator. This setting requires user intervention for optimal configuration, as automatic calculation is not feasible due to the diverse nature of oscillator ranges.
🎯 Number of Bars: Users can select a specific number of bars for volume profile calculation, or opt to include all available historical bars for a comprehensive profile.
🎲 Selecting the right precision:
Users must select the right precision based on their choice of indicator. For example, RSI values range from 0-100. Hence, the default precision of 1 work fine on RSI as the volume profiles are plotted from 0 to 100 at the interval of 0.1
But, the default precision of 1 will not be ok on TSI because TSI values range from -1 to 1. Hence, using 1 as precision will result in very less volume profile lines as shown below.
Due to this, it is necessary to increase the precision for oscillators such as TSI where the range between highest and lowest value is far less. Once we set the precision to 2, we can see more appropriate volume profile division.
🎲 Note of thanks:
This publication uses polyline feature for drawing volume profiles. The advantage of using polyline is that we can overcome max 500 lines issue that we face by using the regular line objects. More details of polyline can be found in the tradingview blog post
Further, using polyline for display of volume profiles is inspired by the publications of fikira and KioseffTrading

10x Bull Vs. Bear VP Intraday Sessions [Kioseff Trading]Hello!
This script "10x Bull Vs. Bear VP Intraday Sessions" lets the user configure up to 10 session ranges for Bull Vs. Bear volume profiles!
Features
Up To 10 Fixed Ranges!
Volume Profile Anchored to Fixed Range
Delta Ladder Anchored to Range
Bull vs Bear Profiles!
Standard Poc and Value Area Lines, in Addition to Separated POCs and Value Area Lines for Bull Profiles and Bear Profiles
Configurable Value Area Target
Up to 2000 Profile Rows per Visible Range
Stylistic Options for Profiles
This script generates Bull vs. Bear volume profiles for up to 10 fixed ranges!
Up to 2000 volume profile levels (price levels) Can be calculated for each profile, thanks to the new polyline feature, allowing for less aggregation / more precision of volume at price and volume delta.
Bull vs Bear Profiles
The image above shows primary functionality!
Green profiles = buying volume
Red profiles = selling volume
All colors are configurable.
Bullish & bearish POC + value areas for each fixed range are displayable!
That’s about it :D
This indicator is part of a series titled “Bull vs. Bear”.
If you have any suggestions please feel free to share!

Bull Vs Bear Visible Range VP [Kioseff Trading]Hello!
This Script “Bull vs Bear Visible Range VP” Calculates Bull & Bear Volume Profiles for the Visible Range Alongside a Delta Ladder for the Visible Period!
Features
Volume Profile Anchored to Visible Range
Delta Ladder Anchored to Visible Range
Bull vs Bear Profiles!
Standard Poc and Value Area Lines, in Addition to Separated POCs and Value Area Lines for Bull Profiles and Bear Profiles
Configurable Value Area Target
Curved Profiles
Up to 9999 Profile Rows per Visible Range
Stylistic Options for Profiles
This Script Generates Bull vs. Bear Volume Profiles for the Visible Range!
Up to 9999 Volume Profile Levels (Price Levels) Can Be Calculated for Each Profile, Thanks to the New Polyline Feature, Allowing For Less Aggregation / More Precision of Volume at Price and Volume Delta.
Bull vs Bear Profiles
The Image Above Shows Primary Functionality!
Green Profiles = Buying Volume
Red Profiles = Selling Volume
Bullish & Bearish Pocs for the Visible Range Are Displayable!
Profiles Can Be Anchored on the Left Side for a More Traditional Look.
The indicator is robust enough to calculate on "small price periods", or for a price period spanning your entire chart fully zoomed out!
That’s About It :D
This Indicator Is Part of a Series Titled “Bull vs. Bear” - A Suite of Profile-Like Indicators I Will Be Releasing Over Coming Days. Thanks for Checking This Out!
If You Have Any Suggestions Please Feel Free to Share!

Zig-Zag Open Interest Footprint [Kioseff Trading]Hello!
This script "Zig Zag Open Interest Footprint" calculates open interest x price values for zig zag trends!
Features
Open interest footprints anchored to zig zag trends
Summed OI x price level footprints
Total OI (for each category) for the entire trend shown
Standard POC lines, in addition to separated POC lines for each category of open interest x price possibility
Up to 9999 profile rows per zigzag trend
Stylistic options for profiles
Configurable zig zag - footprints generated for small to large trends
The zigzag indicator is configurable as normal; minor and major trend volume footprints are calculable. This indicator can be thought of as "Open Interest Footprint for Trends''.
Up to 9999 open interest levels (price levels) can be calculated for each profile, thanks to the new polyline feature, allowing for less aggregation / more precision of open interest at price.
Zig Zag OI Footprints
The image above shows primary functionality!
Green = Higher OI + Higher Price
Yellow = Lower OI + Higher Price
Purple = Higher OI + Lower Price
Red = Lower OI + Lower Price
Profiles are generated for each trend identified by the zigzag indicator.
The image above shows the indicator calculating open interest x price for specific price blocks on the footprint. Aggregate open interest for the identified trend is displayed over the profile!
Neon highlighted values correspond to the highest open interest change for the category. This is a configurable option :D
The image above shows POC lines for each category of open interest x price!
Additionally, you can select to show a single POV for footprint - the single level the greatest amount of OI change occurred.
The indicator is robust enough to calculate on "long zig zags" and "short zig zags"; curved profiles can also be used!
The image above shows key levels, each OI footprint, and summed OI values for the current trend!
That's about it :D
This indicator is part of a series titled "Bull vs. Bear" - a suite of profile-like indicators I will be releasing over the coming days. Thanks for checking this out!
If you have any suggestions please feel free to share!

Zig-Zag Volume Profile (Bull vs. Bear) [Kioseff Trading]Hello!
Thank you @Pinecoders and @TradingView for putting polylines in production and making this viable!!
This script "Zig Zag Volume Profile" implements the polyline feature for Pine Script!
Features
Volume Profile anchored to zig zag trends
Bull vs Bear profiles!
Delta x price level
Standard POC and value area lines, in addition to separated POCs and value area lines for bull profiles and bear profiles
Up to 9999 profile rows per zigzag trend
Stylistic options for profiles
Configurable zig zag - profiles generated for small to large trends
Polylines!
This script generates Bull vs. Bear volume profiles for zig zag trends!
The zigzag indicator is configurable as normal; minor and major trend volume profiles are calculable. This indicator can be thought of as "Volume Profile/Delta for Trends''.
Up to 9999 volume profile levels (price levels) can be calculated for each profile, thanks to the new polyline feature, allowing for less aggregation / more precision of volume at price and volume delta.
Zig Zag Bull Vs Bear Profiles
The image above shows primary functionality!
Green profiles = buying volume
Red profiles = selling volume
Profiles are generated for each trend identified by the zigzag indicator.
The image above shows the indicator calculating volume delta for specific price blocks on the profile. Aggregate volume delta for the identified trend is displayed over the profile!
The image above shows Bull Profile POC lines and value area lines. Bear Profile POC lines and value area lines are also shown!
All colors and transparencies are configurable to the user's liking :D
Additionally, you can select to have the profiles drawn on contrasting sides. Bull Profile on left and Bear Profile on right.
For a more traditional look - you can select to draw the Bull & Bear profiles on the same x-point.
The indicator is robust enough to calculate on "long zig zags" and "short zig zags"; curved profiles can also be used!
The image above exemplifies usage of the indicator!
Bull & Bear volume profiles are calculated for trends on the 30-second timeframe.
The image above shows a more "utilitarian" presentation of the profiles. Once more, line and linefill colors/transparencies are all customizable; the indicator can look however you would like it to!
The image above shows key levels, the Bull vs. Bear profile, and volume delta for the current trend!
That's about it :D
This indicator is part of a series titled "Bull vs. Bear" - a suite of profile-like indicators I will be releasing over coming days. Thanks for checking this out!
Of course, a big thank you to @RicardoSantos for his MathOperator library that I use in every script.
If you have any suggestions please feel free to share!

PhantomFlow DynamicLevelsThe PhantomFlow Dynamic Levels indicator analyzes the dynamic volume over the period specified in the Period field. Channel boundaries can be used as dynamic support and resistance levels when trading within a range. The POC level also serves as a level at which the price may react during trend movements. The Period Multiplier parameter affects how many dynamic levels will be displayed. The Accuracy parameter influences the precision of volume calculations.
These levels are crucial for intraday traders as they serve as support or resistance. The Value Area zone includes 70% of the traded volume over the selected period. In other words, it represents the price region where the majority of traders believe the fair value for the asset lies.
The indicator's name, Dynamic Levels, aptly captures its essence. It analyzes trading volume at various price levels, tracking the sentiment dynamics of traders. When the asset's price decreases or increases as a result of trading, the Dynamic Levels indicator displays a new level on the chart. This results in a plotted line on the chart, allowing us to observe the movement dynamics of both the value area and the maximum volume level.
Standard indicators do not provide real-time visibility into level shifts, making the use of the Dynamic Levels indicator a competitive advantage in market trading across any time frame.
We borrowed the volume profile calculation code from @LonesomeTheBlue. Thank you for the work done!

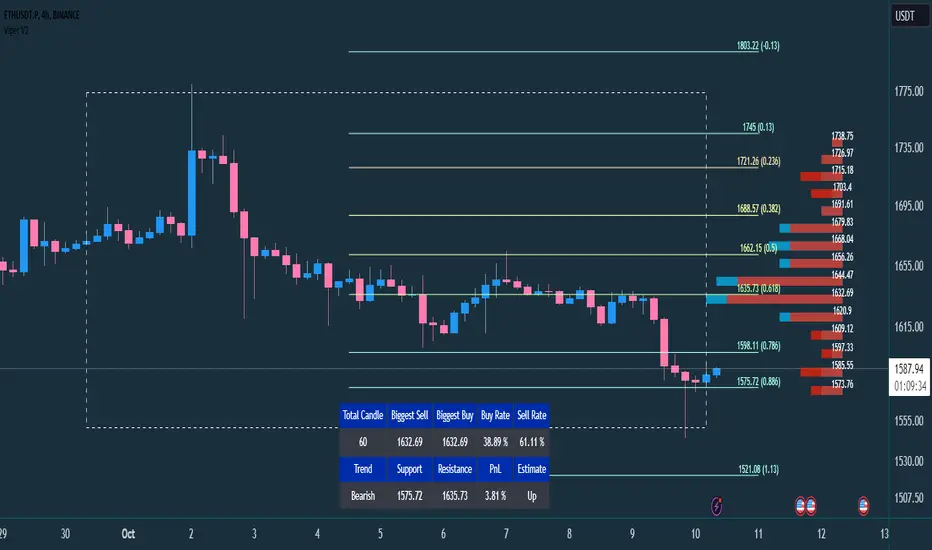
VIPER DOPING - A Volume Profile to estimate trend probabilityDESCRIPTION :
VIPER DOPING uses volume analysis to help trader to understand trading keys below:
Support and Resistance
Profit and Loss
Estimate candle direction
Trend
Biggest Buy and Sell on level prices
HOW TO USE:
The volume bar will have buy and sell colors, by default the buy color is blue and the sell is red. The size of bar is important matter, the biggest bar size means that price level has strong volume or transaction and the smallest bar size indicates the lowest transaction or volume. How to read it?
The bar above the candle is the resistance
The bar below the candle is the support
If you want long the market, find the biggest or bigger support, which is below the candle
If you want short the market, find the biggest or bigger resistance which is above the candle
Trading style and the maximum range (total candle), default is 60. This setup to analyze volumes in specific candle range. Please check the following recommendation based on trading style:
Scalping: 30 - 60 candles, recommendation timeframe: 5m - 1h
Day Trading: 50 - 120 candles, recommendation timeframe: 30m - 4h
Swing Trading: 100- 240 candles, recommendation timeframe: 1h- 3D
The white box is to visualize trading area by total candle. Every line has the meaning:
The left line is the start candle
The right line is the end candle
The top line is the highest price of volume profile
The bottom line is the lowest price of volume profile
The fibonacci line will help you to confirm and compare of supports and resistances with the volume profile lines.
The TABLE CELLS
it contains information to help trader to understand the recent situation of market and to take strategy of trading:
Total Candle : the maximum candles are used to analyze the volume from previous active candle
Biggest Sell : the horizontal price area which has the largest of sell volume of the last total candle
Biggest Buy : the horizontal price area which has the largest of buy volume of the last total candle
Buy Rate : the ratio of buy and sell volume of the last total candle
Support: the closest price to be the support from the active candle, auto changed if support to be invalid
Resistance : the closest price to be the resistance from the active candle, auto changed if support to be invalid
PnL : the percentage profit if you trade using the support and resistance prices and it can be used for Risk Management. Wisely the risk is 50% of the profit, example if the profit 1% the your risk should be 0.5% from entry.
Estimate : to analize the next direction of candle or target, it will be changed automatically by volume condition.
CONFIGURATION:
Table Position : You can change the table position to top or bottom, to left, right or center
Calculation : You can include the active candle in volume calculation or you can choose the behind active candle. If you use active candle, there could be possible repainting.
The volume profile configuration is about appearance configuration, to setup the thickness, colors, position.
The fibonacci configuration is about appearance configuration, to setup the thickness, extend lines, label styles.
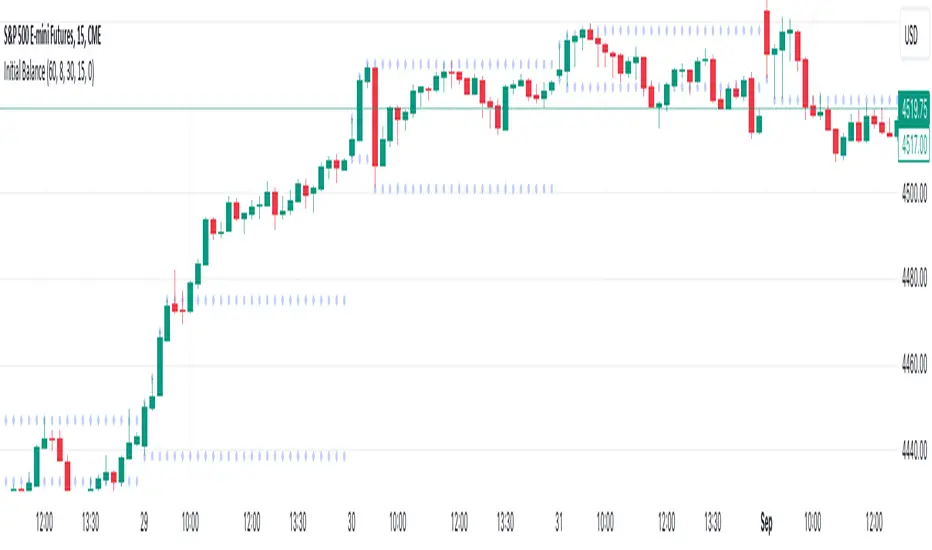
Initial Balance (customizable)Introducing the Initial Balance
Discover precision and clarity in your trading decisions with the Initial Balance. Crafted for traders who seek an edge, this tool pinpoints the range established during the first hour of the trading session, offering a holistic understanding of market sentiments right from the start.
Key Features:
Accurate Visualization: See the initial balance range plotted seamlessly on your chart, providing a transparent view of early market movement.
Customizable Timeframes: Whether you're an early bird catching the first market moves or prefer trading a bit later, set your own start time to fit your trading strategy.
Subtle Aesthetics: With non-intrusive lines and a customizable transparency setting, this indicator integrates smoothly with any chart, ensuring your view remains clear and undistracted.
Adaptable to Any Market: No matter your trading domain - be it stocks, forex, or commodities - this tool adjusts to offer valuable insights.
Why Use the Initial Balance Indicator?
Understanding the initial balance gives a trader the advantage of interpreting the day's potential trend. It's a reflection of early market consensus and serves as a foundation for the day's trading action. By leveraging this, you can better align your strategies with market momentum and improve your trading outcomes.
Add clarity and precision to your trading toolkit. Try the Initial Balance and elevate your trading insights.
Volume HeatMap With Profile [ChartPrime]The Volume Heatmap with Profile indicator is a tool designed to provide traders with a comprehensive view of market activity through customizable visualizations. This indicator goes beyond traditional volume analysis by offering a range of adjustable parameters and features that enhance analysis of volume and give a cleaner experience when analyzing it.
To get started click the start and end time for the profile.
Key Features:
Extended Calculation: This indicator extends its calculation to the last bar, ensuring that the user has insights into current market dynamics.
Point of Control (POC): Easily identify the price level at which the highest trading activity has occurred, helping the user pinpoint potential reversal points and significant support/resistance zones.
VWAP Point of Control: Display the Volume Weighted Average Price (VWAP) Point of Control, giving the user a clear reference for determining the average price traders are paying and potential price reversals.
Adjustable Colors for Heatmap: Change the heatmap colors to the users preference, allowing the user to match the indicator's appearance to their chart style and personal visual preferences.
Forecasted Zone: This feature allows traders to forecast areas of high activity by providing the option to adjust colors within this zone. This feature assists in identifying potential breakouts or areas where increased trading volume is anticipated.
Volume Profile: Customize the colors of the volume profile to make it distinct and easily distinguishable on the chart.
Adjustable Volume Levels: Specify the number volume levels that are most relevant to your trading strategy.
Adjustable Placement for Volume Profile: Position the volume profile on the chart. Whether the user prefers it on the left, right, or at the center of the chart, this indicator offers placement flexibility.
The ratio of bull vs bear volume is plotted on the outside of the range indicating how bullish or bearish price action is in a given range.

Bitcoin Aggregated Volume Profile «NoaTrader»If you use volume profile for analyzing Bitcoin, you may know that sometimes the decisions of big CEXs like Binance can change the volume of each symbol and so the analysis perceived from the data (which may not be valid anymore); Like when Binance decided to transfer the free transaction fee promotion from BTCUSDT to BTCTUSD pair or the new introduced BTCFDUSD pair with volume market share as much as BTCTUSD after only 1 month (according to the coinmarketcap's data).
This indicator tries to solve that problem for using volume profile. So, it collects all the volumes of different pairs from different exchanges and then uses all of them to calculate the volume profile.
Also, there is an option to compare the current symbols volume to the whole volume profile which is a Boolean option in the settings (the picture above)
The aggregated volume data includes:
BINANCE:BTCUSDT
BINANCE:BTCTUSD
BINANCE:BTCBUSD
BINANCE:BTCFDUSD
BINANCE:BTCDAI
BINANCE:BTCEUR
BITSTAMP:BTCUSDT
BITSTAMP:BTCUSD
COINBASE:BTCUSDT
COINBASE:BTCUSD
COINBASE:BTCEUR
HUOBI:BTCUSDT
KUCOIN:BTCUSDT
KRAKEN:XBTUSD
KRAKEN:XBTEUR
BITFINEX:BTCUSD
BYBIT:BTCUSDT
KRAKEN:BTCUSD
OKX:BTCUSDT
Volume Profile Segment Difference «NoaTrader»If you use volume profile, then you might have countered wanting to know a segment of the chart's volume profile relative to the whole volume profile. This indicator tries to solve that problem.
When you add it to the chart, first it asks you the start and end point of the segment you want, then it draws the whole chart's volume profile and shows the selected segments relative volume with a different color (blue default).
The default settings are good for a Bitcoin daily chart, so don't forget to change the settings for other symbols and timeframes.

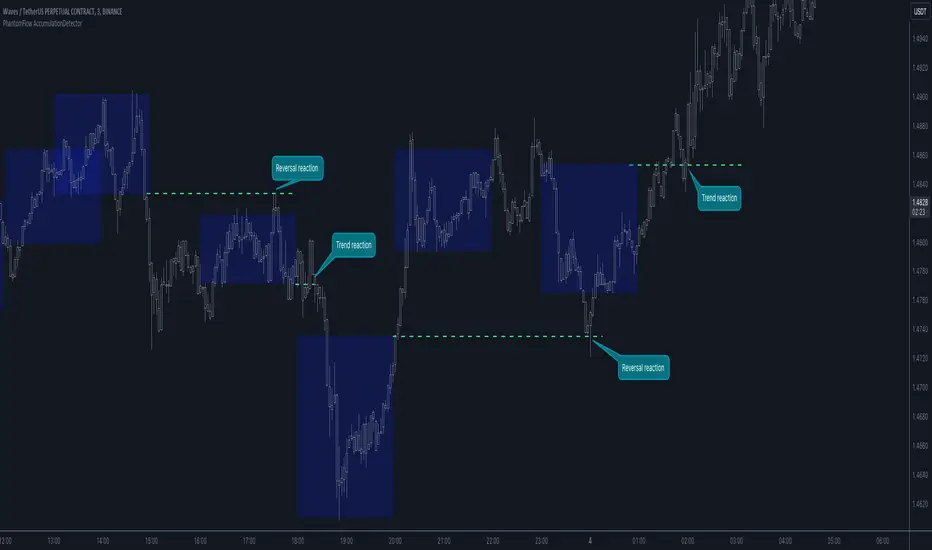
PhantomFlow AccumulationDetectorThe PhantomFlow AccumulationDetector indicator analyzes the volume profile and displays potential accumulation based on the selected timeframe in the settings. This indicator can be used both as zones for trend following and for identifying reversals, as shown in the examples on the chart. The logic behind the formation of the accumulation zone is based on the fact that the POC (Point of Control) of the current zone is within the Volume Area range of the previous period.
Optimal settings for the working timeframe should be chosen visually, and the size of the zones should not be too large or too small. Additionally, it's advisable not to consider overly wide zones during increased volatility.
Consecutive zones within the same range often indicate a potential reversal.
We borrowed the volume profile calculation code from @LonesomeTheBlue. Thank you for the work done!
Volume Profile - BearJust another Volume Profile but you can fit into your chart better by moving back and forth horizontally. also note you can fix the number of bars to show the volume by that way you can use a fib retracment to line up high/low volume nodes with fib levels... see where price as bad structure. or just play with the colors to make a cool gradient?
Volume Profile is a technical analysis tool used by traders to analyze the distribution of trading volume at different price levels within a specified time frame. It helps traders identify key support and resistance levels, potential areas of price reversals, and areas of high trading interest. Here's how to read Volume Profile on a trading chart:
1. **Choose a Time Frame**: Decide on the time frame you want to analyze. Volume Profile can be applied to various time frames, such as daily, hourly, or even minute charts. The choice depends on your trading style and goals.
2. **Plot the Volume Profile**: Once you have your chart open, add the Volume Profile indicator. Most trading platforms offer this tool. It typically appears as a histogram or a series of horizontal bars alongside the price chart.
3. **Identify Key Elements**:
a. **Value Area**: The Value Area represents the price range where the majority of trading volume occurred. It is often divided into three parts: the Point of Control (POC) and the upper and lower value areas. The POC is the price level where the most trading activity occurred and is considered a significant support or resistance level.
b. **High-Volume Nodes**: High-volume nodes are price levels where there was a significant amount of trading volume. These nodes can act as support or resistance levels because they represent areas where many traders had their positions.
c. **Low-Volume Areas**: Conversely, low-volume areas are price levels with little trading activity. These areas may not provide strong support or resistance because they lack significant trader interest.
4. **Interpretation**:
- If the price is trading above the POC and the upper value area, it suggests bullish sentiment, and these levels may act as support.
- If the price is trading below the POC and the lower value area, it suggests bearish sentiment, and these levels may act as resistance.
- High-volume nodes can also act as support or resistance, depending on the price's current position relative to them.
5. **Confirmation**: Volume Profile should be used in conjunction with other technical analysis tools and indicators to confirm trading decisions. Consider using trendlines, moving averages, or other price patterns to validate your trading strategy.
6. **Adjust for Different Time Frames**: Keep in mind that Volume Profile analysis can yield different results on different time frames. For example, a support level on a daily chart may not hold on a shorter time frame due to intraday volatility.
7. **Practice and Experience**: Like any trading tool, reading Volume Profile requires practice and experience. Analyze historical charts, paper trade, and refine your strategies over time to gain proficiency.
8. **Stay Informed**: Stay updated with market news and events that can impact trading volume. Sudden news can change the significance of volume levels.

Liquidity Sentiment Profile (Auto-Anchored) [LuxAlgo]
The Liquidity Sentiment Profile (Auto-Anchored) is an advanced charting tool that measures by combining PRICE and VOLUME data over specified anchored periods and highlights the distribution of the liquidity and the market sentiment at specific price levels. This version is a variation of the previously published Liquidity Sentiment Profile , wherewith this version allows users to select a variety of different anchoring periods, such as 'Auto', 'Fixed Range', 'Swing High', 'Swing Low', 'Session', 'Day', 'Week', 'Month', 'Quarter', and 'Year'
Liquidity refers to the availability of orders at specific price levels in the market, allowing transactions to occur smoothly.
🔶 USAGE
A Liquidity Sentiment Profile (Auto-Anchored) is a combination of liquidity and a sentiment profile, where the right side of the profile highlights the distribution of the traded activity at different price levels, and the left side of the profile highlights the market sentiment at those price levels
The liquidity profile is categorized by assigning different colors based on the significance of the traded activity of the specific price levels, allowing traders to reveal significant price levels, such as support and resistance levels, supply and demand zones, liquidity gaps, consolidation zones, etc
The Liquidity Sentiment Profiles aim to present Value Areas based on the significance of price levels, thus allowing users to identify value areas that can be formed more than once within the range of a single profile
Level of Significance Line - displays the changes in the price levels with the highest traded activity (developing POC)
Buyside & Sellside Liquidity Zones - displays Liquidity Levels, also known as Supply and Demand Zones
🔶 SETTINGS
The script takes into account user-defined parameters and plots the profiles, where detailed usage for each user-defined input parameter in indicator settings is provided with the related input's tooltip.
🔹 Liquidity Sentiment Profile
Anchor Period: The indicator resolution is set by the input of the Anchor Period.
Fixed Period: Applicable if the Anchor Period is set to 'Fixed Range' then the period of the profile is defined with this option
Swing Detection Length: Applicable if the Anchor Period is set to 'Swing High' or 'Swing Low' then the length required to detect the Swing Levels is defined with this option which is then used to determine the period of the profile
🔹 Liquidity Profile
Liquidity Profile: Toggles the visibility of the Liquidity Profiles
High Traded Nodes: Threshold and Color option for High Traded Nodes
Average Traded Nodes: Color option for Average Traded Nodes
Low Traded Nodes: Threshold and Color option for Low Traded Nodes
🔹 Sentiment Profile
Sentiment Profile: Toggles the visibility of the Sentiment Profiles
Bullish Nodes: Color option for Bullish Nodes
Bearish Nodes: Color option for Bearish Nodes
🔹 Buyside & Sellside Liquidity Zones
Buyside & Sellside Liquidity Zones: Toggles the visibility of the Liquidity Levels
Buyside Liquidity Nodes: Color option for Buyside Liquidity Nodes
Sellside Liquidity Nodes: Color option for Sellside Liquidity Nodes
🔹 Other Settings
Level of Significance: Toggles the visibility of the Level of Significance Line
Price Levels, Color: Toggles the visibility of the Profile Price Levels
Number of Rows: Specify how many rows each profile histogram will have. Caution, having it set to high values will quickly hit Pine Script™ drawing objects limit and fewer historical profiles will be displayed
Profile Width %: Alters the width of the rows in the histogram, relative to the profile length
Profile Range Background Fill: Toggles the visibility of the Profiles Range
🔶 RELATED SCRIPTS
Liquidity-Sentiment-Profile
Buyside-Sellside-Liquidity
ICT-Concepts

Dynamic Point of Control (POC)The Dynamic Point of Control (POC) indicator provides traders and analysts with insightful information about price levels, volume distribution, and sentiment within a specified historical range.
Instant Updates : POC recalculates with every new bar, keeping you ahead of the game.
Market Bias : Assess market sentiment through bullish volume share.
Customization : Tailor inputs to match your unique trading strategy.
Chart Presence : See POC and related data graphically on your price chart.
How to Use :
Traders can use the Dynamic POC indicator to identify Point of Control price level, understand volume distribution, and gauge market sentiment. The indicator's visual cues and customizable parameters make it a valuable tool for technical analysis and decision-making.
