Volume-Confirmed Reversal Engine [AlgoPoint]Volume-Confirmed Reversal Engine v2.0
Overview
A price pattern alone is not enough to signal a high-probability reversal. True market turning points—moments of capitulation or euphoria—are almost always confirmed by a significant spike in volume.
The Volume-Confirmed Reversal Engine is designed to identify these exact moments. It filters out low-conviction price movements and focuses only on reversal patterns that are backed by meaningful volume activity.
How It Works
The indicator's logic is based on a sequential confirmation process:
- High-Volume Anchor Candle: The engine first scans for an "Anchor Candle"—a candle that makes a new high or low over a user-defined look_back period. Critically, this candle's volume must also be significantly higher than the recent average. Low-volume breakouts are ignored.
- Setup Activation & Visualization: When a valid Anchor Candle is detected, the indicator enters a "setup" phase. It visually marks this on your chart by drawing a Setup Box around the high and low of the Anchor Candle, extending it forward for the duration of the confirm_in window.
- Confirmation & Signal: A final signal is only triggered if the price breaks out of the opposite side of the Setup Box within the confirmation window. This action, combined with the initial volume spike, confirms the reversal.
- Setup Box Visualization: See exactly which candle the indicator is watching and the key price levels (the box boundaries) that need to be broken for a signal.
Signal Strength Score (1-4): Every signal now comes with a score, providing insight into its quality based on four factors:
- The base price pattern is met.
- The initial Anchor Candle had high volume.
- The final Confirmation Candle also had high volume.
- The signal is aligned with the long-term macro trend (e.g., a BUY signal above the 200 EMA).
Status Dashboard: A simple panel on your chart tells you what the indicator is doing in real-time ("Scanning for Setups," "Watching Bullish Setup," etc.) and displays a countdown for how many bars are left for a confirmation.
How to Interpret & Use
- The Box: When a colored box appears, it's an early warning that a reversal setup is active. Watch the boundaries of the box for a potential breakout.
- The Score: Use the score to gauge the quality of a signal. A 3/4 or 4/4 score represents a very high-conviction setup where multiple technical factors are aligned.
- The Dashboard: Use the panel to understand the indicator's current state and the time-sensitivity of an active setup.
- The BUY/SELL Labels: These are the final, actionable triggers, appearing only after the full price and volume confirmation process is complete.
Объем

TGFA Flexible Alerts Multi-MA CrossoversTGFA Flexible Alerts, Multi-MA Crossovers
Description
Flexible MA crossovers with BUY/SELL alerts, customizable candle colors, and an info box for ATR/volatility insights. Supports EMA/SMA/HMA/VWAP on any chart.
Overview
TGFA Flexible Alerts is a versatile Pine Script indicator for traders seeking customizable moving average (MA) crossovers, visual signals, and quick-reference metrics. It overlays crossover lines (e.g., fast EMA over slow SMA), generates BUY/SELL labels and alerts, colors candles based on themes, and includes an optional info box with ATR bands, support/resistance, and trend projections. Built for any symbol and timeframe (optimized for 1H intraday), it auto-detects Heikin Ashi charts and handles mixed MA types like responsive HMA with lagging EMAs. All logic uses built-in TA functions for reliability—no repainting on confirmed bars.
Key Features
MA Crossover Engine: Configurable lines (EMA, SMA, HMA, VWAP) with dynamic colors (HMA tints green/red based on slope). Enable/disable via inputs.
Invert Signals Toggle: Flips BUY/SELL logic for mixed MA setups (e.g., HMA as fast line over EMA).
Reasoning: Traditional crossovers assume a fast line (low lag) crossing above a slow line (high lag) for buys. HMA's hull design makes it ultra-responsive, so it may "lead" too aggressively—causing premature signals. Inverting aligns it with user intuition (e.g., HMA dipping below then recovering signals strength), reducing false positives in trending markets. Test on your pairs!
Visual Alerts: BUY/SELL labels at crossover price (with optional price display and offset adjustment).
Single MA Overlays: Independent plots for EMA/SMA/HMA/VWAP (length 0 to hide).
Info Box: Real-time table with current price, ±1/2 ATR bands, median price (over lookback), trend (SMA50 slope), volatility % (ATR normalized), support/resistance (recent highs/lows), and reversal projections (tied to SMA50 pivot for up/down bias).
Candle Coloring: 20+ themes (dark/light canvases) for bull/bear/reversal/low-volume bars—e.g., Emerald Blaze greens uptrends, dims on low vol. Toggle off for no changes.
Chart Source Flexibility: Auto-switches to Heikin Ashi if detected; manual override for Regular/HA.
Alerts fire on crossovers/crossunders (custom messages with ticker/interval). Open-source for forking.
How to Use
Add to Chart: Search in TradingView's public library, apply to any symbol (e.g., stocks, forex). Best on 1H for intraday, but works on daily/weekly too.
Setup Crossovers: Choose Line 1/2 types/lengths (e.g., HMA 9 over SMA 20). Enable "Invert Signals" if using HMA—prevents lag mismatches in volatile assets.
Alerts & Labels: Toggle labels for visuals; set TradingView alerts on "Buy"/"Sell" conditions. Use offset for crowded charts.
Info Box Insights: Enable for quick scans—e.g., enter long near support if trend is bullish and price > median. Adjust ATR length (default 14) for sensitivity.
Candle Themes: Pick a scheme (e.g., Neon Pulse for dark mode); it overrides bar colors without altering data.
Customization Tip: For HMA-heavy setups, invert + short lengths (5-9) catch turns early; pair with volume filter in alerts.
Limitations & Disclaimers - Designed for overlay on price charts; may overlap in tight ranges—adjust transparency via styles.
HMA can repaint intra-bar; signals confirm on close. Not back tested for all assets—validate with strategy tester.
Info box projections use SMA(50) as a trend pivot (same for up/down as reference); customize via code for advanced calcs. Candle colors are cosmetic only.
This is an analysis tool, not advice. Trading involves risk; combine with fundamentals/news. Past performance isn't indicative of future results. No liability for losses.
I'm still a newbie, so feedback encouraged!
Thank you!!
ThisGirl

Vol-Pace Projected-ATR-ADX-Alert-MAThe VolSC indicator analyzes stock volume trends with a focus on the Pace metric, which projects today's volume as a percentage of the 30-day average, highlighting unusual activity (e.g., over 200% turns bright green with alerts). The phantom projection bar, a wide green histogram to the right of the last bar, visually represents this projected volume on daily charts only, aiding quick identification of potential volume surges without cluttering intraday or weekly views. Additional features include ADX strength, ATR averages, and customizable table display for comprehensive insights.
Key Features:
* Primary Indicator: Volume with ADX (Average Directional Index) text.
* Pacing and Alerts: Calculates the volume pace for the day. Features an unusual volume alert with an adjustable threshold (e.g., 200%).
* Volume Projection: Projects a visual "Phantom Volume" for the day, offset to the right of the actual volume bar.
* ATR Indicator: Displays the 2x ATR (Average True Range) value as text.
* Volume Average: Displays the ADV (Average Daily Volume) Moving Average as text.
* Customization: Most settings are adjustable.

Volume Aggregated Spot & Futures -- Crypto (by plyst & more)📊 Volume Aggregated Spot & Futures - Enhanced Edition
🎯 Overview
Advanced volume aggregation indicator that combines spot and perpetual futures volume across the top 10 cryptocurrency exchanges. This enhanced version builds upon the original work by @HALDRO Project with optimized calculations and expanded functionality.
✨ Key Features
- 📈 Real-time aggregated volume from 10 major exchanges (Binance, Bybit, OKX, Coinbase, Bitget, KuCoin, Kraken, MEXC, Gate.io, HTX)
- 🔄 Multiple visualization modes: Volume, Delta, Cumulative Delta, Spot vs Perp analysis, Liquidations, OBV, and MFI
- 💱 Multi-currency support: Display volume in COIN, USD, or EUR
- 🎨 Clean, single-color bar chart showing total cumulative volume
- 📊 Multiple calculation methods: SUM, AVG, MEDIAN, VARIANCE
- 🎯 Separate spot (USDT, USD, USDC, etc.) and perpetual futures (.P contracts) tracking
🔧 Technical Improvements
✓ Corrected MFI formula for accurate money flow calculations
✓ Optimized volume aggregation logic with proper NA handling
✓ Support for 10 exchanges (up from 9)
✓ Streamlined codebase for better performance
✓ Updated perpetual contract naming conventions (.P format)
📖 Usage
Perfect for analyzing total market volume, identifying liquidation events, tracking buyer/seller pressure through delta analysis, and understanding the spot vs futures market dynamics.
🙏 Credits
Original concept and framework by @HALDRO Project. This version includes mathematical corrections, code optimizations, and expanded exchange support.
⚠️ Note
Aggregated volume is calculated from external exchange data using request.security(). Ensure your plan supports the necessary security calls for optimal performance.
Basic Odds Enhancer: Supply Zone for ShortsHow to Use/Adjust:
On your chart, it marks bars where a 20-bar high coincides with high volume and bearish divergence—flag these as supply zones.
Tweak supply_threshold to 2.0 for stricter volume (fewer but stronger signals).
For zones, manually draw rectangles around the flagged area (use Drawing Tools > Rectangle).
Backtest: Apply to historical data (e.g., EUR/USD 4H) and check win rate with shorts on retests.
This setup typically yields 2-5 signals per week on major pairs, depending on volatility. Test on a demo account, and combine with market context (e.g., avoid shorts in strong uptrends).

Odds Enhancer: Volume + RSI DivHow it Works: This flags potential demand zones where price hits a 20-bar low with a volume spike and bullish RSI divergence. Customize for supply zones by flipping logic.

3 Red Heikin Ashi with Higher Lows3 Red Heikin Ashi with Higher Lows will give Buy signal when 3 Red Heikin Ashi with Higher Lows is formed

Volume Based Sampling [BackQuant]Volume Based Sampling
What this does
This indicator converts the usual time-based stream of candles into an event-based stream of “synthetic” bars that are created only when enough trading activity has occurred . You choose the activity definition:
Volume bars : create a new synthetic bar whenever the cumulative number of shares/contracts traded reaches a threshold.
Dollar bars : create a new synthetic bar whenever the cumulative traded dollar value (price × volume) reaches a threshold.
The script then keeps an internal ledger of these synthetic opens, highs, lows, closes, and volumes, and can display them as candles, plot a moving average calculated over the synthetic closes, mark each time a new sample is formed, and optionally overlay the native time-bars for comparison.
Why event-based sampling matters
Markets do not release information on a clock: activity clusters during news, opens/closes, and liquidity shocks. Event-based bars normalize for that heteroskedastic arrival of information: during active periods you get more bars (finer resolution); during quiet periods you get fewer bars (coarser resolution). Research shows this can reduce microstructure pathologies and produce series that are closer to i.i.d. and more suitable for statistical modeling and ML. In particular:
Volume and dollar bars are a common event-time alternative to time bars in quantitative research and are discussed extensively in Advances in Financial Machine Learning (AFML). These bars aim to homogenize information flow by sampling on traded size or value rather than elapsed seconds.
The Volume Clock perspective models market activity in “volume time,” showing that many intraday phenomena (volatility, liquidity shocks) are better explained when time is measured by traded volume instead of seconds.
Related market microstructure work on flow toxicity and liquidity highlights that the risk dealers face is tied to information intensity of order flow, again arguing for activity-based clocks.
How the indicator works (plain English)
Choose your bucket type
Volume : accumulate volume until it meets a threshold.
Dollar Bars : accumulate close × volume until it meets a dollar threshold.
Pick the threshold rule
Dynamic threshold : by default, the script computes a rolling statistic (mean or median) of recent activity to set the next bucket size. This adapts bar size to changing conditions (e.g., busier sessions produce more frequent synthetic bars).
Fixed threshold : optionally override with a constant target (e.g., exactly 100,000 contracts per synthetic bar, or $5,000,000 per dollar bar).
Build the synthetic bar
While a bucket fills, the script tracks:
o_s: first price of the bucket (synthetic open)
h_s: running maximum price (synthetic high)
l_s: running minimum price (synthetic low)
c_s: last price seen (synthetic close)
v_s: cumulative native volume inside the bucket
d_samples: number of native bars consumed to complete the bucket (a proxy for “how fast” the threshold filled)
Emit a new sample
Once the bucket meets/exceeds the threshold, a new synthetic bar is finalized and stored. If overflow occurs (e.g., a single native bar pushes you past the threshold by a lot), the code will emit multiple synthetic samples to account for the extra activity.
Maintain a rolling history efficiently
A ring buffer can overwrite the oldest samples when you hit your Max Stored Samples cap, keeping memory usage stable.
Compute synthetic-space statistics
The script computes an SMA over the last N synthetic closes and basic descriptors like average bars per synthetic sample, mean and standard deviation of synthetic returns, and more. These are all in event time , not clock time.
Inputs and options you will actually use
Data Settings
Sampling Method : Volume or Dollar Bars.
Rolling Lookback : window used to estimate the dynamic threshold from recent activity.
Filter : Mean or Median for the dynamic threshold. Median is more robust to spikes.
Use Fixed? / Fixed Threshold : override dynamic sizing with a constant target.
Max Stored Samples : cap on synthetic history to keep performance snappy.
Use Ring Buffer : turn on to recycle storage when at capacity.
Indicator Settings
SMA over last N samples : moving average in synthetic space . Because its index is sample count, not minutes, it adapts naturally: more updates in busy regimes, fewer in quiet regimes.
Visuals
Show Synthetic Bars : plot the synthetic OHLC candles.
Candle Color Mode :
Green/Red: directional close vs open
Volume Intensity: opacity scales with synthetic size
Neutral: single color
Adaptive: graded by how large the bucket was relative to threshold
Mark new samples : drop a small marker whenever a new synthetic bar prints.
Comparison & Research
Show Time Bars : overlay the native time-based candles to visually compare how the two sampling schemes differ.
How to read it, step by step
Turn on “Synthetic Bars” and optionally overlay “Time Bars.” You will see that during high-activity bursts, synthetic bars print much faster than time bars.
Watch the synthetic SMA . Crosses in synthetic space can be more meaningful because each update represents a roughly comparable amount of traded information.
Use the “Avg Bars per Sample” in the info table as a regime signal. Falling average bars per sample means activity is clustering, often coincident with higher realized volatility.
Try Dollar Bars when price varies a lot but share count does not; they normalize by dollar risk taken in each sample. Volume Bars are ideal when share count is a better proxy for information flow in your instrument.
Quant finance background and citations
Event time vs. clock time : Easley, López de Prado, and O’Hara advocate measuring intraday phenomena on a volume clock to better align sampling with information arrival. This framing helps explain volatility bursts and liquidity droughts and motivates volume-based bars.
Flow toxicity and dealer risk : The same authors show how adverse selection risk changes with the intensity and informativeness of order flow, further supporting activity-based clocks for modeling and risk management.
AFML framework : In Advances in Financial Machine Learning , event-driven bars such as volume, dollar, and imbalance bars are presented as superior sampling units for many ML tasks, yielding more stationary features and fewer microstructure distortions than fixed time bars. ( Alpaca )
Practical use cases
1) Regime-aware moving averages
The synthetic SMA in event time is not fooled by quiet periods: if nothing of consequence trades, it barely updates. This can make trend filters less sensitive to calendar drift and more sensitive to true participation.
2) Breakout logic on “equal-information” samples
The script exposes simple alerts such as breakout above/below the synthetic SMA . Because each bar approximates a constant amount of activity, breakouts are conditioned on comparable informational mass, not arbitrary time buckets.
3) Volatility-adaptive backtests
If you use synthetic bars as your base data stream, most signal rules become self-paced : entry and exit opportunities accelerate in fast markets and slow down in quiet regimes, which often improves the realism of slippage and fill modeling in research pipelines (pair this indicator with strategy code downstream).
4) Regime diagnostics
Avg Bars per Sample trending down: activity is dense; expect larger realized ranges.
Return StdDev (synthetic) rising: noise or trend acceleration in event time; re-tune risk.
Interpreting the info panel
Method : your sampling choice and current threshold.
Total Samples : how many synthetic bars have been formed.
Current Vol/Dollar : how much of the next bucket is already filled.
Bars in Bucket : native bars consumed so far in the current bucket.
Avg Bars/Sample : lower means higher trading intensity.
Avg Return / Return StdDev : return stats computed over synthetic closes .
Research directions you can build from here
Imbalance and run bars
Extend beyond pure volume or dollar thresholds to imbalance bars that trigger on directional order flow imbalance (e.g., buy volume minus sell volume), as discussed in the AFML ecosystem. These often further homogenize distributional properties used in ML. alpaca.markets
Volume-time indicators
Re-compute classical indicators (RSI, MACD, Bollinger) on the synthetic stream. The premise is that signals are updated by traded information , not seconds, which may stabilize indicator behavior in heteroskedastic regimes.
Liquidity and toxicity overlays
Combine synthetic bars with proxies of flow toxicity to anticipate spread widening or volatility clustering. For instance, tag synthetic bars that surpass multiples of the threshold and test whether subsequent realized volatility is elevated.
Dollar-risk parity sampling for portfolios
Use dollar bars to align samples across assets by notional risk, enabling cleaner cross-asset features and comparability in multi-asset models (e.g., correlation studies, regime clustering). AFML discusses the benefits of event-driven sampling for cross-sectional ML feature engineering.
Microstructure feature set
Compute duration in native bars per synthetic sample , range per sample , and volume multiple of threshold as inputs to state classifiers or regime HMMs . These features are inherently activity-aware and often predictive of short-horizon volatility and trend persistence per the event-time literature. ( Alpaca )
Tips for clean usage
Start with dynamic thresholds using Median over a sensible lookback to avoid outlier distortion, then move to Fixed thresholds when you know your instrument’s typical activity scale.
Compare time bars vs synthetic bars side by side to develop intuition for how your market “breathes” in activity time.
Keep Max Stored Samples reasonable for performance; the ring buffer avoids memory creep while preserving a rolling window of research-grade data.

Smart Money Concept v1Smart Money Concept Indicator – Visual Interpretation Guide
What Happens When Liquidity Lines Are Broken
🟩 Green Line Broken (Buy-Side Liquidity Pool Swept)
- Indicates price has dipped below a previous swing low where sell stops are likely placed.
- Market Makers may be triggering these stops to accumulate long positions.
- Often followed by a bullish reversal.
- Trader Actions:
• Look for a bullish candle close after the sweep.
• Confirm with nearby Bullish Order Block or Fair Value Gap.
• Consider entering a Buy trade (SLH entry).
- If price continues falling: Indicates trend continuation and invalidation of the buy-side liquidity zone.
🟥 Red Line Broken (Sell-Side Liquidity Pool Swept)
- Indicates price has moved above a previous swing high where buy stops are likely placed.
- Market Makers may be triggering these stops to accumulate short positions.
- Often followed by a bearish reversal.
- Trader Actions:
• Look for a bearish candle close after the sweep.
• Confirm with nearby Bearish Order Block or Fair Value Gap.
• Consider entering a Sell trade (SLH entry).
- If price continues rising: Indicates trend continuation and invalidation of the sell-side liquidity zone.
Chart-Based Interpretation of Green Line Breaks
In the provided DOGE/USD 15-minute chart image:
- Green lines represent buy-side liquidity zones.
- If these lines are broken:
• It may be a stop hunt before a bullish continuation.
• Or a false Break of Structure (BOS) leading to deeper retracement.
- Confirmation is needed from candle structure and nearby OB/FVG zones.
Is the Pink Zone a Valid Bullish Order Block?
To validate the pink zone as a Bullish OB:
- It should be formed by a strong down-close candle followed by a bullish move.
- Price should have rallied from this zone previously.
- If price is now retesting it and showing bullish reaction, it confirms validity.
- If formed during low volume or price never rallied from it, it may not be valid.
Smart Money Concept - Liquidity Line Breaks Explained
This document explains how traders should interpret the breaking of green (buy-side) and red (sell-side) liquidity lines when using the Smart Money Concept indicator. These lines represent key liquidity pools where stop orders are likely placed.
🟩 Green Line Broken (Buy-Side Liquidity Pool Swept)
When the green line is broken, it indicates:
• - Price has dipped below a previous swing low where sell stops were likely placed.
• - Market Makers have triggered those stops to accumulate long positions.
• - This is often followed by a bullish reversal.
Trader Actions:
• - Look for a bullish candle close after the sweep.
• - Confirm with a nearby Bullish Order Block or Fair Value Gap.
• - Consider entering a Buy trade (SLH entry).
🟥 Red Line Broken (Sell-Side Liquidity Pool Swept)
When the red line is broken, it indicates:
• - Price has moved above a previous swing high where buy stops were likely placed.
• - Market Makers have triggered those stops to accumulate short positions.
• - This is often followed by a bearish reversal.
Trader Actions:
• - Look for a bearish candle close after the sweep.
• - Confirm with a nearby Bearish Order Block or Fair Value Gap.
• - Consider entering a Sell trade (SLH entry).
📌 Additional Notes
• - If price continues beyond the liquidity line without reversal, it may indicate a trend continuation rather than a stop hunt.
• - Always confirm with Higher Time Frame bias, Institutional Order Flow, and price reaction at the zone.

Fixed-Range Volume-Profile ZonesFixed Range Volume Profile Zones (with Dynamic Percentile Buffers)
This indicator calculates a fixed‑range volume profile over a user‑defined lookback period and identifies three key zones:
– VAL (Value Area Low)
– POC (Point of Control)
– VAH (Value Area High)
Volume is grouped into user‑selected price bins to create a profile of where the most trading activity occurred.
The script then splits the distribution into three zones and highlights the extremes (VAL/VAH) and the highest‑volume price (POC).
Dynamic Percentile Buffers
Instead of static offsets, this version computes the 10th and 90th percentile prices (user‑adjustable) of recent closes over the same lookback window.
These percentiles are used to create adaptive buffers above VAH and below VAL.
The buffers automatically expand or contract with market volatility and recent price distribution, filtering out weak or noisy touches.
Visual Elements:
– Green/orange/red horizontal lines = VAL / VAH / POC
– Green shading below VAL = buy zone
– Red shading above VAH = sell zone
– Down arrows above bars = closes above VAH + buffer
– Up arrows below bars = closes below VAL – buffer
Inputs:
– Lookback Days: number of bars used to build the profile
– Number of Bins: controls resolution of the volume profile
– VAH Percentile and VAL Percentile: choose which percentile levels to use for dynamic buffers
Use Cases:
– Quickly identify areas of high participation (POC) and potential support/resistance (VAL/VAH)
– Filter out weak breakouts using dynamic buffers
– Combine with other signals to improve entries/exits
⚠️ Disclaimer:
This script is for educational and informational purposes only.
It does not constitute financial advice or a recommendation to buy or sell any security.
Past performance or historical data does not guarantee future results.
Always perform your own analysis and use risk management when trading.

HUNT_line [Dr.Forexy]HUNT_line Indicator
📊 **Category:** Price Action & Market Structure
⏰ **Recommended Timeframe:** 5-minute and higher
🎯 **Purpose:** Advanced market structure visualization for professional traders
⸻
⚡ **Key Features:**
• Break of Structure (BOS) and Change of Character (CHOCH) detection
• Internal & Swing Market Structure analysis
• Order Blocks identification with smart filtering
• Fair Value Gaps (FVG) visualization
• Premium/Discount Zones
• Multi-timeframe support
• Real-time structure alerts
⸻
🛠 **How to Use:**
1. Apply on 5M or higher timeframes for best results
2. Monitor BOS/CHOCH for trend direction changes
3. Use Order Blocks as potential support/resistance areas
4. Watch for FVG fills as price inefficiency zones
5. Combine multiple confluences for higher probability setups
⸻
⚠️ **Risk Disclaimer:**
This indicator is for educational purposes only.
Not financial advice. Always conduct your own research.
⸻
🔹 **Credits:**
Inspired by LuxAlgo's "Smart Money Concepts" with custom improvements

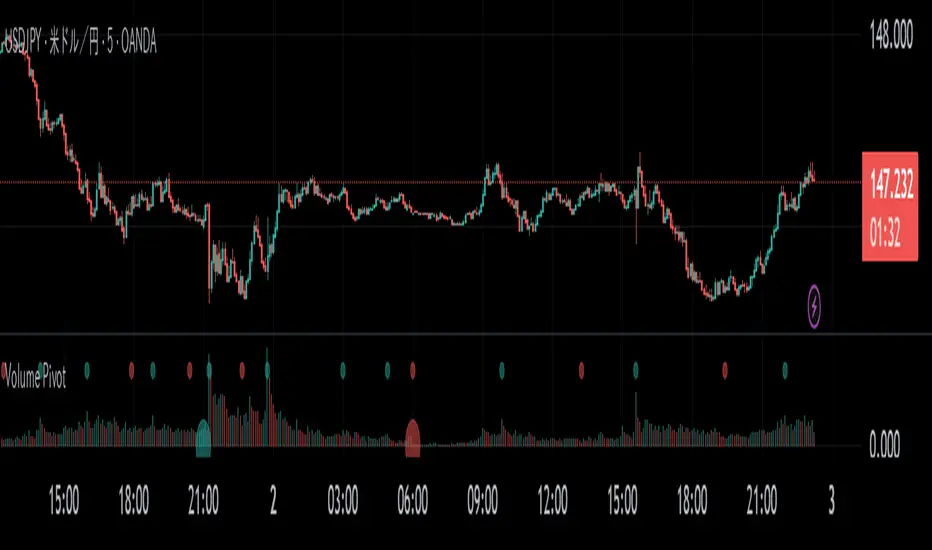
Volume PivotOVERVIEW
Volume Pivot is a technical analysis tool for TradingView designed to identify key turning points in the market by focusing on volume rather than price. It detects peaks and troughs (pivots) in trading volume to pinpoint moments of maximum market interest or exhaustion.
This indicator performs its analysis on both the Current Timeframe (CTF) and a user-defined Higher Timeframe (HTF). This dual-perspective approach allows traders to simultaneously grasp short-term market reactions and long-term structural shifts, leading to more informed and high-conviction trading decisions.
FEATURES
Automatic Pivot Detection
Automatically identifies and plots Volume Pivot Highs (peaks) and Pivot Lows (troughs) based on a user-defined Lookback Length.
Dual Timeframe Display
- CTF Signals : Plotted as tiny circles directly above the corresponding volume bars for immediate, short-term context.
- HTF Signals : Plotted as slightly larger circles at the bottom of the indicator pane, making them easy to distinguish as signals of higher significance.
Flexible HTF Configuration
Customize which higher timeframe to use for analysis based on your current chart timeframe. For example, you can set the indicator to reference the 1-hour chart as the HTF when you are on the 5-minute chart, and the Daily chart as the HTF when you are on the 1-hour chart.
Intuitive Volume Bars
The volume bars are color-coded to show whether volume is increasing (bullish color) or decreasing (bearish color) compared to the previous bar, offering a quick visual gauge of market momentum.
Full Customization
Easily toggle the visibility of CTF and HTF signals and customize the colors for bullish and bearish pivots to match your charting preferences.
Actually Engulfing CandlesticksThis thing attempts to find price reversals with actually engulfing candlesticks with volume spikes and RSI values as confirmation. It works well on mean reverting assets I guess.
Green dots below bars = bullish reversal
Fuchsia dots above bars = bearish reversal
Have fun!

Anchored VWAP + Prev Session Levels by Avenoircustom vwap for weekly, monthly, quarterly and yearly vawp.
also highlighting previous vwaps.

VWAP Daily/Weekly/Monthly - Automatic AnchoredExplanation:
This script plots Volume-Weighted Average Price (VWAP) lines that are automatically anchored to the beginning of key timeframes — daily, weekly, and monthly. VWAP is a widely used trading indicator that shows the average price of an asset weighted by trading volume, making it useful for identifying fair value and institutional trading levels.
The “automatic anchored” feature means that you don’t have to manually select starting points. Instead, the script automatically resets the VWAP at the start of each day, week, or month, depending on the chosen setting. This ensures the VWAP always reflects the true average price for that period, providing traders with a consistent reference for support, resistance, and trend direction across multiple timeframes.
Notice:
On the chart, you may notice visible “jumps” in the VWAP lines. These are intentional. Each jump marks the reset point at the start of a new day, week, or month, depending on the selected setting. This design keeps the VWAP history from the previous period intact, allowing you to clearly see how price interacted with VWAP in past sessions.
By keeping these historical resets, you can easily compare short-term (daily) VWAP behavior against longer-term levels like weekly and monthly VWAP. This provides valuable context, helping you spot when price respects or diverges from fair value across different timeframes.
In short:
Daily VWAP resets at the start of each trading day.
Weekly VWAP resets at the beginning of each trading week.
Monthly VWAP resets at the start of each month.
This makes it easy to analyze how price interacts with VWAP levels across different time horizons without manual adjustments.

Swing Dashboard - Pro Trader Metrics with MTF & Enhanced VolumeDESCRIPTION:
A comprehensive real-time dashboard designed for swing traders and active investors trading US equities. Displays all critical metrics in one customizable panel overlay - no need to clutter your chart with multiple indicators.
KEY FEATURES:
📊 Relative Strength Analysis:
Stock vs Market (SPY/QQQ/IWM/DIA)
Stock vs Sector (automatic sector ETF detection)
Sector vs Market comparison
Customizable lookback period (5-60 days)
📈 Price & Range Metrics:
Daily range, change, and gap percentages
Distance from SMA20, SMA50, VWAP
52-week position percentage
ATR% and ADR% for volatility assessment
Range/ADR ratio for breakout detection
💪 Advanced Volume Analysis:
RVOL (full day volume vs 20-day average)
Volume Strength (bar-by-bar analysis)
Volume Trend (5-day vs 20-day momentum)
Customizable RVOL alert thresholds
Non-repainting volume calculations
⚙️ Multi-Timeframe (MTF) Mode:
View daily charts with 5-min or 15-min metric updates
Perfect for monitoring positions without switching timeframes
All calculations remain accurate across timeframes
🎨 Fully Customizable:
Choose which metrics to display
9 position options for the dashboard
Adjustable text size and colors
Toggle individual metrics on/off
Sector-specific ETF mapping for accurate RS calculations
TECHNICAL SPECIFICATIONS:
✅ Non-repainting - all calculations use confirmed bar data
✅ No lookahead bias or future data
✅ Optimized for US stocks with proper sector mapping
✅ Works on any timeframe (best on 5m-Daily)
✅ Pine Script v6 with best practices
✅ Handles edge cases and missing data gracefully
IDEAL FOR:
Swing traders monitoring multiple positions
Day traders needing quick metric overview
Investors tracking relative strength and momentum
Anyone who wants institutional-grade metrics in one place
SECTOR ETF MAPPING:
Automatically maps to correct sector ETFs: XLK, XLF, XLV, XLY, XLP, XLE, XLB, XLI, XLRE, XLC, XLU
HOW TO USE:
Green = Positive/Strong | Red = Negative/Weak | White = Neutral
RS > 0 = Outperforming benchmark/sector
RVOL > 1.5x = High volume day
VWAP% negative = Price below VWAP (mean reversion opportunity)
R/ADR > 100% = Extended range (potential exhaustion)
Perfect for traders who need professional-grade analysis without chart clutter.
TAGS:
dashboard, swing, relativestrengrh, sectoranalysis, volume, rvol, multitimeframe, mtf, tradingdashboard, metrics, daytrading, swingtrading, momentum, vwap, atr, volatility, volumeanalysis

RVol+ Enhanced Relative Volume Indicator📊 RVol+ Enhanced Relative Volume Indicator
Overview
RVol+ (Relative Volume Plus) is an advanced time-based relative volume indicator designed specifically for swing traders and breakout detection. Unlike simple volume comparisons, RVol+ analyzes volume at the same time of day across multiple sessions, providing statistically significant insights into institutional activity and breakout potential.
🎯 Key Features
Core Volume Analysis
Time-Based RVol Calculation - Compares current cumulative volume to the average volume at this exact time over the past N days
Statistical Z-Score - Measures volume in standard deviations from the mean for true anomaly detection
Volume Percentile - Shows where current volume ranks historically (0-100%)
Sustained Volume Filter - 3-bar moving average prevents false signals from single-bar spikes
Breakout Detection
🚀 Confirmed Breakouts - Identifies price breakouts validated by high volume (RVol > 1.5x)
⚠️ False Breakout Warnings - Alerts when price breaks key levels on low volume (high failure risk)
Multi-Timeframe Context - Weekly volume overlay prevents chasing daily noise
Advanced Metrics
OBV Divergence Detection - Spots bullish/bearish accumulation/distribution patterns
Volume Profile Integration - Identifies institutional positioning
Money Flow Analysis - Tracks smart money vs retail activity
Extreme Volume Alerts - 🔥 Labels mark unusual spikes beyond the display cap
Visual Intelligence
Smart Color Coding:
🟢 Bright Teal = High activity (RVol ≥ 1.5x)
🟡 Medium Teal = Caution zone (RVol ≥ 1.2x)
⚪ Light Teal = Normal activity
🟠 Orange = Breakout confirmed
🔴 Red = False breakout risk
Comprehensive Stats Table:
Current Volume (formatted as M/K/B)
RVol ratio
Z-Score with significance
Volume percentile
Historical average and standard deviation
Sustained volume confirmation
📈 How to Use
For Swing Trading (1D - 3W Holds)
Perfect Setup:
✓ RVol > 1.5x (bright teal)
✓ Z-Score > 2.0 (⚡ alert)
✓ Percentile > 90%
✓ Sustained = ✓
✓ 🚀 Breakout label appears
Avoid:
✗ Red "Low Vol" warning during breakouts
✗ RVol < 1.0 at key levels
✗ Sustained volume not confirmed
Signal Interpretation
⚡ Z>2 Labels - Statistically significant volume (95th+ percentile) - highest probability moves
↗️ OBV+ Labels - Bullish accumulation (OBV rising while price consolidates)
↘️ OBV- Labels - Bearish distribution (OBV falling while price rises)
🔵 Blue Background - Weekly volume elevated (confirms daily strength)
⚙️ Customization
Basic Settings
N Day Average - Number of historical days for comparison (default: 5)
RVol Thresholds - Customize highlight levels (default: 1.2x, 1.5x)
Visual Display Cap - Prevent extreme spikes from compressing view (default: 4.0x)
Advanced Metrics (Toggle On/Off)
Z-Score analysis
Weekly RVol context
OBV divergence detection
Volume percentile ranking
Breakout signal generation
Table Customization
Position - 9 placement options to avoid chart overlap
Size - Tiny to Huge
Colors - Full customization of positive/negative/neutral values
Transparency - Adjustable background
Debug Mode
Enable Pine Logs for calculation transparency
Adjustable log frequency
Real-time calculation breakdown
🔬 Technical Details
Algorithm:
Binary search for historical lookups (O(log n) performance)
Time-zone aware session detection
DST-safe timestamp calculations
Exponentially weighted standard deviation
Anti-repainting architecture
Performance:
Optimized for max_bars_back = 5000
Efficient array management
Built-in function optimization
Memory-conscious data structures
📊 What Makes RVol+ Different?
vs. Standard Volume:
Context-aware (time-of-day matters)
Statistical significance testing
False breakout filtering
vs. Basic RVol:
Z-Score normalization (2-3 sigma detection)
Multi-timeframe confirmation
OBV divergence integration
Sustained volume filtering
Smart visual scaling
vs. Professional Tools:
Free and open-source
Fully customizable
No black-box algorithms
Educational debug logs
💡 Best Practices
Wait for Confirmation - Don't enter on first bar; wait for sustained volume ✓
Combine with Price Action - RVol validates, price structure determines entry
Weekly Context Matters - Blue background = institutional interest
Z-Score is King - Focus on ⚡ alerts for highest probability
Avoid Low Volume Breakouts - Red ⚠️ labels = high failure risk
🎓 Trading Psychology
Volume precedes price. When RVol+ shows:
High RVol + Rising OBV = Accumulation before breakout
High RVol at Resistance = Test of conviction
Low RVol on Breakout = Retail-driven (fade candidate)
Z-Score > 3 = Potential "whale" positioning
📝 Credits
Based on the time-based RVol concept from /u/HurlTeaInTheSea, enhanced with:
Statistical analysis (z-scores, percentiles)
Multi-timeframe integration
OBV divergence detection
Professional-grade visualization
Swing trading optimization
🔧 Version History
v2.0 - Enhanced Edition
Added Z-Score analysis
Multi-timeframe volume context
OBV divergence detection
Breakout confirmation system
Smart color coding
Customizable stats table
Debug logging mode
Performance optimizations
📚 Learn More
For optimal use with swing trading:
Combine with support/resistance levels
Watch for volume clusters in consolidation
Use weekly timeframe for trend confirmation
Monitor OBV divergence for early warnings
⚠️ Disclaimer
This indicator is for educational purposes. Volume analysis is one component of trading decisions. Always use proper risk management, consider multiple timeframes, and validate signals with price structure. Past performance does not guarantee future results.
🚀 Getting Started
Add indicator to chart
Adjust "N Day Average" to your preference (5-10 days typical)
Position stats table to avoid overlap
Enable features you want to monitor
Watch for 🚀 breakout confirmations!
Happy Trading! 📈

CNagda-MomentumX - Institutional FlowMomentumX is designed to empower traders with a deeper understanding of market movements by focusing on Institutional Flow and advanced market structure analytics. The core goal is to identify and visualize where major market participants are operating, and to translate these complex footprints into clear, actionable trading signals — all in real time.
Real-time institutional activity mapping
Actionable entry and exit signals based on live market structure
Intuitive dashboard and dynamic chart visuals
Fully customizable modules for trend, liquidity, and order blocks
Core Logic Design
At the heart of MomentumX lies a robust algorithmic engine built to capture and surface institutional trading behavior. By leveraging advanced mathematical models, the indicator calculates institutional volume ratios and price momentum to pinpoint aggressive moves from large participants.
Institutional Volume & Price Momentum:
Utilizes custom volume indicators and price change analysis to detect strong buying or selling pressure, filtering out retail noise.
Liquidity Grab Detection & Activity Zones:
The script identifies liquidity grabs by monitoring abrupt price sweeps at major support/resistance levels—often where institutions trigger stop hunts or reversals. All critical activity zones are automatically color-coded on the chart for instant recognition.
Dashboard Visualization:
A fully dynamic dashboard table overlays live scores for accumulation, distribution, strength, and weakness—giving traders a real-time scan of market health.
Trendline & Order Block Architecture:
The logic auto-detects pivot highs/lows to draw smart trendlines, while the order block system highlights key reversal areas and breaker zones—making market structure clear and actionable.
MomentumX is packed with high-performance modules, each engineered to simplify complex market behavior and enhance decision-making for traders:
Institutional Flow Signals:
Instantly identifies spots where institutional players drive momentum, using unique volume and price activity analytics.
Bullish/Bearish Liquidity Grab Detection:
Marks abrupt price moves that signal stop hunts or reversals, letting traders anticipate snap-backs or trend shifts.
Trendline Auto-Detection:
Smartly draws trendlines based on significant swing highs and lows, automatically adjusting as price evolves.
Order Block System (Rejection/Breaker):
Spots and highlights key reversal zones with order block rectangles, confirming rejections or breakouts at strategic levels.
Dashboard and Bar Coloring:
A clean dashboard overlay presents live market scores, while dynamic bar coloring makes trend, strength, and high-activity periods instantly visible.
User Input Toggles for Each Module:
Every major feature is fully customizable—enable or disable modules to match individual trading setups or preferences.
Scripting/Development
MomentumX’s scripting process is modular, enabling clarity, scalability, and fast optimization throughout development:
Initialization & Inputs:
Start by defining all user input options, module toggles, color settings, and calculation parameters—ensuring maximum flexibility early on.
Core Calculation Functions:
Script advanced institutional volume and price momentum algorithms. Build out swing length logic, market state filters, and activity scoring methods.
Detection Engines:
Develop and integrate engines for liquidity grabs, automated trendline detection, and order block identification—each with dedicated functions for speed and precision.
Visual Overlays & Plotting:
Implement powerful plotting logic for colored bars, score dashboards, trendlines, reversal zones, and liquidity markers—making every data point clear and actionable on the chart.
Testing Handlers:
Add diagnostic panels and debug outputs to refine calculations and assure accuracy in every market environment.
Sample Trade Setups (Usage)
Cnagda MomentumX delivers clarity for multiple trading styles by providing timely, actionable setups grounded in institutional behavior and market structure. Here’s how traders can leverage the indicator for confident decision-making:
Liquidity Grab Reversal
Enter trades around detected liquidity grabs when price sweeps major support/resistance and the dashboard signals a momentum shift.
Example: Wait for a bullish/Bearish grab near market lows/high, with institutional flow turning positive/negative—enter long/short for potential mean reversion.
Order Block Breakout
Trade breakouts when price cleanly rejects or flips key order block zones highlighted on the chart.
Example: Short at a marked breaker block after a rejection signal, confirmed by a downward institutional activity spike.
Trendline Continuation
Ride established market moves by entering on trendline confirmations plotted by the auto-detect system.
Example: Go long after a trendline retest, confirmed by a green bar color and dashboard strength score.
Dashboard Confirmation
Combine dashboard metrics (strength, accumulation, distribution) with bar color overlays for multi-factor entries.
Example: Enter trades only when all market signals align in real time for maximum probability.
For Short Entry check -- Weakness : For Long Entry Check - Strength With Other Indications
MomentumX is not just another indicator – it’s your edge for reading the market like an insider. By transparently mapping institutional flow, uncovering hidden liquidity zones, and color-coding every major structure shift, MomentumX transforms complexity into actionable clarity. Whether you’re scalping, swing trading, or investing, you’ll gain a decisive, real-time advantage on every chart.
Embrace smarter decisions, adapt to changing market conditions instantly, and join a new generation of technically empowered traders.
Customize, observe, and let the market reveal opportunities in a way you’ve never experienced before.
Happy Trading

Dynamic Volume Trace Profile [ChartPrime]⯁ OVERVIEW
Dynamic Volume Trace Profile is a reimagined take on volume profile analysis. Instead of plotting a static horizontal histogram on the side of your chart, this indicator projects dynamic volume trace lines directly onto the price action. Each bin is color-graded according to its relative strength, creating a living “volume skeleton” of the market. The orange trace highlights the current Point of Control (POC)—the price level with maximum historical traded volume within the lookback window. On the right side, the tool builds a mini profile, showing absolute volume per bin alongside its percentage share, where the POC always represents 100% strength .
⯁ KEY FEATURES
Dynamic On-Chart Bins:
The range between highest high and lowest low is split into 25 bins. Each bin is drawn as a horizontal trace line across the lookback chart period.
Gradient Color Encoding:
Trace lines fade from transparent to teal depending on relative volume size. The more intense the teal, the stronger the historical traded activity at that level.
Automatic POC Highlight:
The bin with the highest aggregated volume is flagged with an orange line . This POC adapts bar-by-bar as volume distribution shifts.
Right-Side Volume Profile:
At the chart’s right edge, the script prints a box-style profile. Each bin shows:
• Total volume (absolute units).
• Percentage of max volume, in parentheses (POC bin = 100%).
This gives both raw and normalized context at a glance.
Adjustable Lookback Window:
The lookback defines how many bars feed the profile. Increase for stable HTF zones or decrease for responsive intraday distributions.
POC Toggle & Styling:
Optionally toggle POC highlighting on/off, adjust colors, and set line thickness for better integration with your chart theme.
⯁ HOW IT WORKS (UNDER THE HOOD)
Step Sizing:
over last 100 bars is divided by to calculate bin height.
Volume Aggregation:
For each bar in the , the script checks which bin the close falls into, then adds that bar’s volume to the bin’s counter.
Gradient Mapping:
Bin volume is normalized against the max volume across all bins. That value is mapped onto a gradient from transparent → teal.
POC Logic:
The bin with highest volume is colored orange both on the dynamic trace and in the right-side profile.
Right-Hand Profile:
Boxes are drawn for each bin proportional to volume / maxVolume × 50 units, with text labels showing both absolute volume and normalized %.
⯁ USAGE
Use the orange trace as the dominant “magnet” level—price often gravitates to the POC.
Watch for clusters of strong teal traces as areas of high acceptance; thin or faint zones mark low-liquidity gaps prone to fast moves.
On intraday charts, tighten lookback to reveal session-based distributions . For swing or position trading, expand lookback to surface more durable volume shelves.
Compare the right-side profile % to judge how “top-heavy” or “bottom-heavy” the current distribution is.
Use bright, intense color traces as context for confluence with structure, OBs, or liquidity hunts.
⯁ CONCLUSION
Dynamic Volume Trace Profile takes the traditional volume profile and fuses it into the body of price itself. Instead of a fixed sidebar, you see gradient traces layered directly on the chart, giving real-time context of where volume concentrated and where price may be drawn. With built-in POC highlighting, normalized % readouts, and an adaptive right-side profile, it offers both precision levels and market structure awareness in a cleaner, more intuitive form.

Volume Percentile Supertrend [BackQuant]Volume Percentile Supertrend
A volatility and participation aware Supertrend that automatically widens or tightens its bands based on where current volume sits inside its recent distribution. The goal is simple: fewer whipsaws when activity surges, faster reaction when the tape is quiet.
What it does
Calculates a standard Supertrend framework from an ATR on a volume weighted price source.
Measures current volume against its recent percentile and converts that context into a dynamic ATR multiplier.
Widens bands when volume is unusually high to reduce chop. Tightens bands when volume is unusually low to catch turns earlier.
Paints candles, draws the active Supertrend line and optional bands, and prints clear Long and Short signal markers.
Why volume percentile
Fixed ATR multipliers assume all bars are equal. They are not. When participation spikes, price swings expand and a static band gets sliced.
Percentiles place the current bar inside a recent distribution. If volume is in the top slice, the Supertrend allows more room. If volume is in the bottom slice, it expects smaller noise and tightens.
This keeps the same playbook usable across busy sessions and sleepy ones without constant manual retuning.
How it works
Volume distribution - A rolling window computes the Pth percentile of volume. Above that is flagged as high volume. A lower reference percentile marks quiet bars.
Dynamic multiplier - Start from a Base Multiplier. If bar is high volume, scale it up by a function of volume-to-average and a Sensitivity knob. If bar is low volume, scale it down. Smooth the result with an EMA to avoid jitter.
VWMA source - The price input for bands is a short volume weighted moving average of close. Heavy prints matter more.
ATR envelope - Compute ATR on your length. UpperBasic = VWMA + Multiplier x ATR. LowerBasic = VWMA - Multiplier x ATR.
Trailing logic - The final lines trail price so they only move in a direction that preserves Supertrend behavior. This prevents sudden flips from transient pokes.
Direction and signals - Direction flips when price crosses through the relevant trailing line. SupertrendLong and SupertrendShort mark those flips. The plotted Supertrend is the active trailing side.
Inputs and what they change
Volume Lookback - Window for percentile and average. Larger window = stabler percentile, smaller = snappier.
Volume Percentile Level - Threshold that defines high volume. Example 70 means top 30 percent of recent bars are treated as high activity.
Volume Sensitivity - Gain from volume ratio to the dynamic multiplier. Higher = bands expand more when volume spikes.
VWMA Source Length - Smoothing of the volume weighted price source for the bands.
ATR Length - Standard ATR window. Larger = slower, smaller = quicker.
Base Multiplier - Core band width before volume adjustment. Think of this as your neutral volatility setting.
Multiplier Smoothing - EMA on the dynamic multiplier. Reduces back and forth changes when volume oscillates around the threshold.
Show Supertrend on chart - Toggles the active line.
Show Upper Lower Bands - Draws both sides even when inactive. Good for context.
Paint candles according to Trend - Colors bars by trend direction.
Show Long and Short Signals - Prints 𝕃 and 𝕊 markers at flips.
Colors - Choose your long and short palette.
Reading the plot
Supertrend line - Thick line that hugs price from above in downtrends and from below in uptrends. Its distance breathes with volume.
Bands - Optional upper and lower rails. Useful to see the inactive side and judge how wide the envelope is right now.
Signals - 𝕃 prints when the trend flips long. 𝕊 prints when the trend flips short.
Candle colors - Quick bias read at a glance when painting is enabled.
Typical workflows
Trend following - Use 𝕃 flips to initiate longs and ride while bars remain colored long and price respects the lower trailing line. Mirror for shorts with 𝕊 and the upper trailing line. During high volume phases the line will give more room, which helps stay in the move.
Pullback adds - In an established trend, shallow tags toward the active line after a high volume expansion can be add points. The dynamic envelope adjusts to the session so your add distance is not fixed to a stale volatility regime.
Mean reversion filter - In quiet tape the multiplier contracts and flips come earlier. If you prefer fading, watch for quick toggles around the bands when volume percentile remains low. In high volume, avoid fading into the widened line unless you have other strong reasons.
Notes on behavior
High volume bar: the percentile gate opens, volRatio > 1 powers up the multiplier through the Sensitivity lever, bands widen, fewer false flips.
Low volume bar: multiplier contracts, bands tighten, flips can happen earlier which is useful when you want to catch regime changes in quiet conditions.
Smoothing matters: both the price source (VWMA) and the multiplier are smoothed to keep structure readable while still adapting.
Quick checklist
If you see frequent chop and today feels busy: check that volume is above your percentile. Wider bands are expected. Consider letting the trend prove itself against the expanded line before acting.
If everything feels slow and you want earlier entries: percentile likely marks low volume, so bands tighten and 𝕃 or 𝕊 can appear sooner.
If you want more or fewer flips overall: adjust Base Multiplier first. If you want more reaction specifically tied to volume surges: raise Volume Sensitivity. If the envelope breathes too fast: raise Multiplier Smoothing.
What the signals mean
SupertrendLong - Direction changed from non-long to long. 𝕃 marker prints. The active line switches to support below price.
SupertrendShort - Direction changed from non-short to short. 𝕊 marker prints. The active line switches to resistance above price.
Trend color - Bars painted long or short help validate context for entries and management.
Summary
Volume Percentile Supertrend adapts the classic Supertrend to the day you are trading. Volume percentile sets the mood, sensitivity translates it into dynamic band width, and smoothing keeps it clean. The result is a single plot that aims to stay conservative when the tape is loud and act decisively when it is quiet, without you having to constantly retune settings.

Volume Profile 3D (Zeiierman)█ Overview
Volume Profile 3D (Zeiierman) is a next-generation volume profile that renders market participation as a 3D-style profile directly on your chart. Instead of flat histograms, you get a depth-aware profile with parallax, gradient transparency, and bull/bear separation, so you can see where liquidity stacked up and how it shifted during the move.
Highlights:
3D visual effect with perspective and depth shading for clarity.
Bull/Bear separation to see whether up bars or down bars created the volume.
Flexible colors and gradients that highlight where the most significant trading activity took place.
This is a state-of-the-art volume profile — visually powerful, highly flexible, and unlike anything else available.
█ How It Works
⚪ Profile Construction
The price range (from highest to lowest) is divided into a number of levels (buckets). Each bar’s volume is added to the correct level, based on its average price. This builds a map of where trading volume was concentrated.
You can choose to:
Aggregate all volume at each level, or
Split bullish vs. bearish volume , slightly offset for clarity.
This creates a clear view of which price zones matter most to the market.
⚪ 3D Effect Creation
The unique part of this indicator is how the 3D projection is built. Each volume block’s width is scaled to its relative size, then tilted with a slope factor to create a depth effect.
maxVol = bins.bu.max() + bins.be.max()
width = math.max(1, math.floor(bucketVol / maxVol * ((bar_index - start) * mult)))
slope = -(step * dev) / ((bar_index - start) * (mult/2))
factor = math.pow(math.min(1.0, math.abs(slope) / step), .5)
width → determines how far the volume extends, based on relative strength.
slope → creates the angled projection for the 3D look.
factor → adjusts perspective to make deeper areas shrink naturally.
The result is a 3D-style volume profile where large areas pop forward and smaller areas fade back, giving you immediate visual context.
█ How to Use
⚪ Support & Resistance Zones (HVNs and Value Area)
Regions where a lot of volume traded tend to act like walls:
If price approaches a high-volume area from above, it may act as support.
From below, it may act as resistance.
Traders often enter or exit near these zones because they represent strong agreement among market participants.
⚪ POC Rejections & Mean Reversions
The Point of Control (POC) is the single price level with the highest volume in the profile.
When price returns to the POC and rejects it, that’s often a signal for reversal trades.
In ranging markets, price may bounce between edges of the Value Area and revert to POC.
⚪ Breakouts via Low-Volume Zones (LVNs)
Low volume areas (gaps in the profile) offer path of least resistance:
Price often moves quickly through these thin zones when momentum builds.
Use them to spot breakouts or continuation trades.
⚪ Directional Insight
Use the bull/bear separation to see whether buyers or sellers dominated at key levels.
█ Settings
Use Active Chart – Profile updates with visible candles.
Custom Period – Fixed number of bars.
Up/Down – Adjust tilt for the 3D angle.
Left/Right – Scale width of the profile.
Aggregated – Merge bull/bear volume.
Bull/Bear Shift – Separate bullish and bearish volume.
Buckets – Number of price levels.
Choose from templates or set custom colors.
POC Gradient option makes high volume bolder, low volume lighter.
-----------------
Disclaimer
The content provided in my scripts, indicators, ideas, algorithms, and systems is for educational and informational purposes only. It does not constitute financial advice, investment recommendations, or a solicitation to buy or sell any financial instruments. I will not accept liability for any loss or damage, including without limitation any loss of profit, which may arise directly or indirectly from the use of or reliance on such information.
All investments involve risk, and the past performance of a security, industry, sector, market, financial product, trading strategy, backtest, or individual's trading does not guarantee future results or returns. Investors are fully responsible for any investment decisions they make. Such decisions should be based solely on an evaluation of their financial circumstances, investment objectives, risk tolerance, and liquidity needs.

Intraday Rising & Reversal ScannerPine Script Description: Intraday Rising & Reversal ScannerThis Pine Script is a TradingView indicator designed to identify stocks with intraday (1-hour timeframe) potential for bullish (rising) or bearish (reversal) movements. It scans for stocks based on user-defined technical criteria, including price change, relative volume, RSI, EMA, ATR, and VWAP. The script plots signals on the chart, displays a summary table, and triggers alerts when conditions are met.FeaturesBullish Signal (Rising Stocks):1H Price Change: > 1% (configurable, e.g., >2% for volatile markets).
Relative Volume: > 2.0 (volume is at least twice the 20-period average).
RSI (14): Between 50 and 70 (strong but not overbought momentum).
Price vs EMA 13: Price above the 13-period EMA (confirms short-term uptrend).
ATR (14): Current ATR above its 20-period average (indicates volatility).
VWAP: Price above VWAP (optional, shown on chart for manual confirmation).
Bearish Signal (Reversal Stocks):1H Price Change: < -1% (configurable, e.g., <-2% for stronger reversals).
Relative Volume: > 2.0 (high volume confirms selling pressure).
RSI (14): > 70 (overbought, increasing reversal likelihood).
Price vs EMA 13: Price below the 13-period EMA (confirms short-term downtrend).
ATR (14): Current ATR above its 20-period average (indicates volatility).
VWAP: Price below VWAP (optional, shown on chart for manual confirmation).
Visualization:Bullish Signal: Green triangle below the bar.
Bearish Signal: Red triangle above the bar.
VWAP: Plotted as a blue line for manual verification.
Table: Displays real-time metrics (Change %, Relative Volume, RSI, Price vs EMA, ATR, VWAP) in the top-right corner, color-coded (green for bullish, red for bearish).
Alerts:Separate alerts for bullish ("Intraday Bullish Signal") and bearish ("Intraday Bearish Signal") conditions.
Customizable alert messages include parameter values for easy tracking.
How It WorksThe script runs on the 1-hour (1H) timeframe, ensuring all calculations are based on hourly data.
Indicators are computed:Change %: Percentage price change over the last hour.
Relative Volume: Current volume divided by the 20-period SMA of volume.
RSI: 14-period Relative Strength Index.
EMA 13: 13-period Exponential Moving Average.
ATR: 14-period Average True Range, compared to its 20-period SMA.
VWAP: Volume Weighted Average Price, plotted for visual confirmation.
Signals are generated when all conditions for either bullish or bearish criteria are met.
A table summarizes key metrics, and alerts can be set up for real-time notifications.
Usage InstructionsApply the Script:Open TradingView’s Pine Editor.
Copy and paste the script.
Click "Add to Chart" and set the chart to the 1-hour (1H) timeframe.
Set Up Alerts:Right-click on the chart > "Add Alert".
Select "Intraday Bullish Signal" or "Intraday Bearish Signal" as the condition.
Configure notifications (e.g., SMS, email, or TradingView alerts).
Manual VWAP Check:VWAP is plotted as a blue line. Verify that the price is above VWAP for bullish signals or below for bearish signals using the table or chart.
To make VWAP a mandatory filter, uncomment the VWAP conditions in the bull_signal and bear_signal definitions.

HTF Candle Highs and Lows with Labels + High Probability Signals█ OVERVIEW
This indicator overlays Weekly, Daily, and H4 High/Low levels directly onto your chart, allowing traders to visualize key support and resistance zones from higher timeframes. It also includes high probability breakout signals that appear one candle after a confirmed breakout above or below these levels, filtered by volume and candle strength.
Use this tool to identify breakout opportunities with greater confidence and clarity.
█ FEATURES
• Plots Weekly, Daily, and H4 High and Low levels using request.security. • Customizable line colors, widths, and label sizes. • Toggle visibility for each timeframe independently. • Signals appear one candle after a confirmed breakout: • Bullish: Close above HTF High, strong candle, high volume. • Bearish: Close below HTF Low, strong candle, high volume. • Signal shapes match the color of the broken level for visual clarity.
█ HOW TO USE
1 — Enable the timeframes you want to track using the input toggles. 2 — Watch for triangle-shaped signals: • Upward triangle = Bullish breakout. • Downward triangle = Bearish breakout. 3 — Confirm the breakout: • Candle closes beyond the HTF level by at least 0.1%. • Candle body shows momentum (close > open for bullish, close < open for bearish). • Volume exceeds 20-period average. 4 — Enter trade on the candle after the signal. 5 — Use the HTF level as a reference for stop-loss placement. 6 — Combine with other indicators (e.g., RSI, EMA) for confluence.
█ LIMITATIONS
• Signals may lag by one candle due to confirmation logic. • Not optimized for low-volume assets or illiquid markets. • Best used in trending environments; avoid during consolidation. • Does not include automatic alerts (can be added manually).
█ BEST PRACTICES
• Use on H1 or higher timeframes for cleaner signals. • Avoid trading during news events or low volatility. • Backtest thoroughly before live trading. • Adjust breakout percentage and volume filter based on asset volatility. • Maintain a trading journal to track performance.
