Smart MACD Volume Trader# Smart MACD Volume Trader
## Overview
Smart MACD Volume Trader is an enhanced momentum indicator that combines the classic MACD (Moving Average Convergence Divergence) oscillator with an intelligent high-volume filter. This combination significantly reduces false signals by ensuring that trading signals are only generated when price momentum is confirmed by substantial volume activity.
The indicator supports over 24 different instruments including major and exotic forex pairs, precious metals (gold and silver), energy commodities (crude oil, natural gas), and industrial metals (copper). For forex and commodity traders, the indicator automatically maps to CME and COMEX futures contracts to provide accurate institutional-grade volume data.
## Originality and Core Concept
Traditional MACD indicators generate signals based solely on price momentum, which can result in numerous false signals during low-activity periods or ranging markets. This indicator addresses this critical weakness by introducing a volume confirmation layer with automatic institutional volume integration.
**What makes this approach original:**
- Signals are triggered only when MACD crossovers coincide with elevated volume activity
- Implements a lookback mechanism to detect volume spikes within recent bars
- Automatically detects and maps 24+ forex pairs and commodities to their corresponding CME and COMEX futures contracts
- Provides real institutional volume data for forex pairs where spot volume is unreliable
- Combines two independent market dimensions (price momentum and volume) into a single, actionable signal
- Includes intelligent asset detection that works across multiple exchanges and ticker formats
**The underlying principle:** Volume validates price movement. When institutional money enters the market, it creates volume signatures. By requiring high volume confirmation and using actual institutional volume data from futures markets, this indicator filters out weak price movements and focuses on trades backed by genuine market participation. The automatic futures mapping ensures that forex and commodity traders always have access to the most accurate volume data available, without manual configuration.
## How It Works
### MACD Component
The indicator calculates MACD using standard methodology:
1. **Fast EMA (default: 12 periods)** - Tracks short-term price momentum
2. **Slow EMA (default: 26 periods)** - Tracks longer-term price momentum
3. **MACD Line** - Difference between Fast EMA and Slow EMA
4. **Signal Line (default: 9-period SMA)** - Smoothed average of MACD line
**Crossover signals:**
- **Bullish:** MACD line crosses above Signal line (momentum turning positive)
- **Bearish:** MACD line crosses below Signal line (momentum turning negative)
### Volume Filter Component
The volume filter adds an essential confirmation layer:
1. **Volume Moving Average** - Calculates exponential MA of volume (default: 20 periods)
2. **High Volume Threshold** - Multiplies MA by ratio (default: 2.0x or 200%)
3. **Volume Detection** - Identifies bars where current volume exceeds threshold
4. **Lookback Period** - Checks if high volume occurred in recent bars (default: 5 bars)
**Signal logic:**
- Buy/Sell signals only trigger when BOTH conditions are met:
- MACD crossover/crossunder occurs
- High volume detected within lookback period
### Automatic CME Futures Integration
For forex traders, spot FX volume data can be unreliable or non-existent. This indicator solves this problem by automatically detecting forex pairs and mapping them to corresponding CME futures contracts with real institutional volume data.
**Supported Major Forex Pairs (7):**
- EURUSD → CME:6E1! (Euro FX Futures)
- GBPUSD → CME:6B1! (British Pound Futures)
- AUDUSD → CME:6A1! (Australian Dollar Futures)
- USDJPY → CME:6J1! (Japanese Yen Futures)
- USDCAD → CME:6C1! (Canadian Dollar Futures)
- USDCHF → CME:6S1! (Swiss Franc Futures)
- NZDUSD → CME:6N1! (New Zealand Dollar Futures)
**Supported Exotic Forex Pairs (4):**
- USDMXN → CME:6M1! (Mexican Peso Futures)
- USDRUB → CME:6R1! (Russian Ruble Futures)
- USDBRL → CME:6L1! (Brazilian Real Futures)
- USDZAR → CME:6Z1! (South African Rand Futures)
**Supported Cross Pairs (6):**
- EURJPY → CME:6E1! (Uses Euro Futures)
- GBPJPY → CME:6B1! (Uses British Pound Futures)
- EURGBP → CME:6E1! (Uses Euro Futures)
- AUDJPY → CME:6A1! (Uses Australian Dollar Futures)
- EURAUD → CME:6E1! (Uses Euro Futures)
- GBPAUD → CME:6B1! (Uses British Pound Futures)
**Supported Precious Metals (2):**
- Gold (XAUUSD, GOLD) → COMEX:GC1! (Gold Futures)
- Silver (XAGUSD, SILVER) → COMEX:SI1! (Silver Futures)
**Supported Energy Commodities (3):**
- WTI Crude Oil (USOIL, WTIUSD) → NYMEX:CL1! (Crude Oil Futures)
- Brent Oil (UKOIL) → NYMEX:BZ1! (Brent Crude Futures)
- Natural Gas (NATGAS) → NYMEX:NG1! (Natural Gas Futures)
**Supported Industrial Metals (1):**
- Copper (COPPER) → COMEX:HG1! (Copper Futures)
**How the automatic detection works:**
The indicator intelligently identifies the asset type by analyzing:
1. Exchange name (FX, OANDA, TVC, COMEX, NYMEX, etc.)
2. Currency pair pattern (6-letter codes like EURUSD, GBPUSD)
3. Commodity identifiers (XAU for gold, XAG for silver, OIL for crude)
When a supported instrument is detected, the indicator automatically switches to the corresponding futures contract for volume analysis. For stocks, cryptocurrencies, and other assets, the indicator uses the native volume data from the current chart.
**Visual feedback:**
An information table appears in the top-right corner of the MACD pane showing:
- Current chart symbol
- Exchange name
- Currency pair or asset name
- Volume source being used (highlighted in orange for futures, yellow for native volume)
- Current high volume status
This provides complete transparency about which data source the indicator is using for its volume analysis.
## How to Use
### Basic Setup
1. Add the indicator to your chart
2. The indicator displays in a separate pane (MACD) and overlay (signals/volume bars)
3. Default settings work well for most assets, but can be customized
### Signal Interpretation
### Visual Signals
**Visual Signals:**
- **Green "BUY" label** - Bullish MACD crossover confirmed by high volume
- **Red "SELL" label** - Bearish MACD crossunder confirmed by high volume
- **Green/Red candles** - Highlight bars with volume exceeding the threshold
- **Light green/red background** - Emphasizes signal bars on the chart
**Information Table:**
A detailed information table appears in the top-right corner of the MACD pane, providing real-time transparency about the indicator's operation:
- **Chart:** Current symbol being analyzed
- **Exchange:** The exchange or data feed being used
- **Pair:** The currency pair or asset name extracted from the ticker
- **Volume From:** The actual symbol used for volume analysis
- Orange color indicates CME or COMEX futures are being used (automatic institutional volume)
- Yellow color indicates native volume from the chart symbol is being used
- Hover tooltip shows whether automatic futures mapping is active
- **High Volume:** Current status showing YES (green) when volume exceeds threshold, NO (gray) otherwise
This table ensures complete transparency and allows you to verify that the correct volume source is being used for your analysis.
**Volume Analysis:**
- Gray histogram bars = Normal volume
- Red histogram bars = High volume (exceeds threshold)
- Green line = Volume moving average baseline
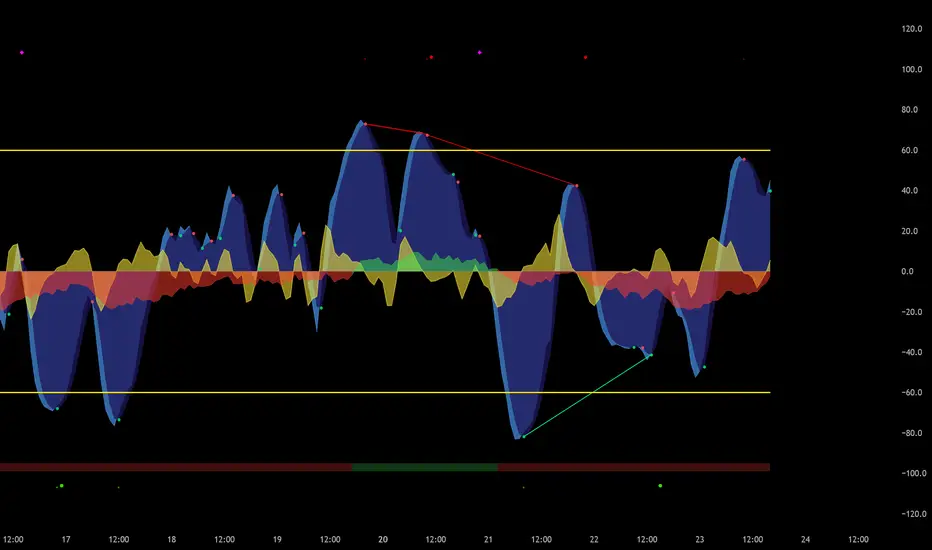
**MACD Analysis:**
- Blue line = MACD line (momentum indicator)
- Orange line = Signal line (trend confirmation)
- Gray dotted line = Zero line (bullish above, bearish below)
### Parameter Customization
**MACD Parameters:**
- Adjust Fast/Slow EMA lengths for different sensitivities
- Shorter periods = More signals, faster response
- Longer periods = Fewer signals, less noise
**Volume Parameters:**
- **Volume MA Period:** Higher values smooth volume analysis
- **High Volume Ratio:** Lower values (1.5x) = More signals; Higher values (3.0x) = Fewer, stronger signals
- **Volume Lookback Bars:** Controls how recent the volume spike must be
**Direction Filters:**
- **Only Buy Signals:** Enables long-only strategy mode
- **Only Sell Signals:** Enables short-only strategy mode
### Alert Configuration
The indicator includes three alert types:
1. **Buy Signal Alert** - Triggers when bullish signal appears
2. **Sell Signal Alert** - Triggers when bearish signal appears
3. **High Volume Alert** - Triggers when volume exceeds threshold
To set up alerts:
1. Click the indicator name → "Add alert on Smart MACD Volume Trader"
2. Select desired alert condition
3. Configure notification method (popup, email, webhook, etc.)
## Trading Strategy Guidelines
### Best Practices
**Recommended markets:**
- Liquid stocks (large-cap, high daily volume)
- Major forex pairs (EURUSD, GBPUSD, USDJPY, AUDUSD, USDCAD, USDCHF, NZDUSD)
- Exotic forex pairs (USDMXN, USDRUB, USDBRL, USDZAR)
- Cross pairs (EURJPY, GBPJPY, EURGBP, AUDJPY, EURAUD, GBPAUD)
- Precious metals (Gold, Silver with automatic COMEX futures mapping)
- Energy commodities (Crude Oil, Natural Gas with automatic NYMEX futures mapping)
- Industrial metals (Copper with automatic COMEX futures mapping)
- Major cryptocurrency pairs
- Index futures and ETFs
**Timeframe recommendations:**
- **Day trading:** 5-minute to 15-minute charts
- **Swing trading:** 1-hour to 4-hour charts
- **Position trading:** Daily charts
**Risk management:**
- Use signals as entry confirmation, not standalone strategy
- Combine with support/resistance levels
- Consider overall market trend direction
- Always use stop-loss orders
### Strategy Examples
**Trend Following Strategy:**
1. Identify overall trend using higher timeframe (e.g., daily chart)
2. Trade only in trend direction
3. Use "Only Buy" filter in uptrends, "Only Sell" in downtrends
4. Enter on signal, exit on opposite signal or at resistance/support
**Volume Breakout Strategy:**
1. Wait for consolidation period (low volume, tight MACD range)
2. Enter when signal appears with high volume (confirms breakout)
3. Target previous swing highs/lows
4. Stop loss below/above recent consolidation
**Forex Scalping Strategy (with automatic CME futures):**
1. The indicator automatically detects forex pairs and uses CME futures volume
2. Trade during active sessions only (use session filter)
3. Focus on quick profits (10-20 pips)
4. Exit at opposite signal or profit target
**Commodities Trading Strategy (Gold, Silver, Oil):**
1. The indicator automatically maps to COMEX and NYMEX futures contracts
2. Trade during high-liquidity sessions (overlap of major markets)
3. Use the high volume confirmation to identify institutional entry points
4. Combine with key support and resistance levels for entries
5. Monitor the information table to confirm futures volume is being used (orange color)
6. Exit on opposite MACD signal or at predefined profit targets
## Why This Combination Works
### The Volume Advantage
Studies consistently show that price movements accompanied by high volume are more likely to continue, while low-volume movements often reverse. This indicator leverages this principle by requiring volume confirmation.
**Key benefits:**
1. **Reduced False Signals:** Eliminates MACD whipsaws during low-volume consolidation
2. **Confirmation Bias:** Two independent indicators (price momentum + volume) agreeing
3. **Institutional Alignment:** High volume often indicates institutional participation
4. **Trend Validation:** Volume confirms that price momentum has "conviction"
### Statistical Edge
By combining two uncorrelated signals (MACD crossovers and volume spikes), the indicator creates a higher-probability setup than either signal alone. The lookback mechanism ensures signals aren't missed if volume spike slightly precedes the MACD cross.
## Supported Exchanges and Automatic Detection
The indicator includes intelligent asset detection that works across multiple exchanges and ticker formats:
**Forex Exchanges (Automatic CME Mapping):**
- FX (TradingView forex feed)
- OANDA
- FXCM
- SAXO
- FOREXCOM
- PEPPERSTONE
- EASYMARKETS
- FX_IDC
**Commodity Exchanges (Automatic COMEX/NYMEX Mapping):**
- TVC (TradingView commodity feed)
- COMEX (directly)
- NYMEX (directly)
- ICEUS
**Other Asset Classes (Native Volume):**
- Stock exchanges (NASDAQ, NYSE, AMEX, etc.)
- Cryptocurrency exchanges (BINANCE, COINBASE, KRAKEN, etc.)
- Index providers (SP, DJ, etc.)
The detection algorithm analyzes three factors:
1. Exchange prefix in the ticker symbol
2. Pattern matching for currency pairs (6-letter codes)
3. Commodity identifiers in the symbol name
This ensures accurate automatic detection regardless of which data feed or exchange you use for charting. The information table in the top-right corner always displays which volume source is being used, providing complete transparency.
## Technical Details
**Calculations:**
- MACD Fast MA: EMA(close, fastLength)
- MACD Slow MA: EMA(close, slowLength)
- MACD Line: Fast MA - Slow MA
- Signal Line: SMA(MACD Line, signalLength)
- Volume MA: Exponential MA of volume
- High Volume: Current volume >= Volume MA × Ratio
**Signal logic:**
```
Buy Signal = (MACD crosses above Signal) AND (High volume in last N bars)
Sell Signal = (MACD crosses below Signal) AND (High volume in last N bars)
```
## Parameters Reference
| Parameter | Default | Description |
|-----------|---------|-------------|
| Volume Symbol | Blank | Manual override for volume source (leave blank for automatic detection) |
| Use CME Futures | False | Legacy option (automatic detection is now built-in) |
| Alert Session | 1530-2200 | Active session time range for alerts |
| Timezone | UTC+1 | Timezone for alert sessions |
| Volume MA Period | 20 | Number of periods for volume moving average |
| High Volume Ratio | 2.0 | Volume threshold multiplier (2.0 = 200% of average) |
| Volume Lookback | 5 | Number of bars to check for high volume confirmation |
| MACD Fast Length | 12 | Fast EMA period for MACD calculation |
| MACD Slow Length | 26 | Slow EMA period for MACD calculation |
| MACD Signal Length | 9 | Signal line SMA period |
| Only Buy | False | Filter to show only bullish signals |
| Only Sell | False | Filter to show only bearish signals |
| Show Signals | True | Display buy and sell labels on chart |
## Optimization Tips
**For volatile markets (crypto, small caps):**
- Increase High Volume Ratio to 2.5-3.0
- Reduce Volume Lookback to 3-4 bars
- Consider faster MACD settings (8, 17, 9)
**For stable markets (large-cap stocks, bonds):**
- Decrease High Volume Ratio to 1.5-1.8
- Increase Volume MA Period to 30-50
- Use standard MACD settings
**For forex (with automatic CME futures):**
- The indicator automatically uses CME futures when forex pairs are detected
- Set appropriate trading session based on your timezone
- Use Volume Lookback of 5-7 bars
- Consider session-based alerts only
- Monitor the information table to verify correct futures mapping
**For commodities (Gold, Silver, Oil, Copper):**
- The indicator automatically maps to COMEX and NYMEX futures
- Increase High Volume Ratio to 2.0-2.5 for metals
- Use slightly higher Volume MA Period (25-30) for smoother analysis
- Trade during active market hours for best volume data
- The information table will show the futures contract being used (orange highlight)
## Limitations and Considerations
**What this indicator does NOT do:**
- Does not predict future price direction
- Does not guarantee profitable trades
- Does not replace proper risk management
- Does not work well in extremely low-volume conditions
**Market conditions to avoid:**
- Pre-market and after-hours sessions (low volume)
- Major news events (volatile, unpredictable volume)
- Holidays and low-liquidity periods
- Extremely low float stocks
## Conclusion
Smart MACD Volume Trader represents a significant evolution of the traditional MACD indicator by combining volume confirmation with automatic institutional volume integration. This dual-confirmation approach significantly improves signal quality by filtering out low-conviction price movements and ensuring traders work with accurate volume data.
The indicator's automatic detection and mapping system supports over 24 instruments across forex, commodities, and metals markets. By intelligently switching to CME and COMEX futures contracts when appropriate, the indicator provides forex and commodity traders with the same quality of volume data that stock traders naturally have access to.
This indicator is particularly valuable for traders who want to:
- Align their entries with institutional money flow
- Avoid getting trapped in false breakouts
- Trade forex pairs with reliable volume data
- Access accurate volume information for gold, silver, and energy commodities
- Combine momentum and volume analysis in a single, streamlined tool
Whether you are day trading stocks, swing trading forex pairs, or positioning in commodities markets, this indicator provides a robust framework for identifying high-probability momentum trades backed by genuine institutional participation. The automatic futures mapping works seamlessly across all supported instruments, requiring no manual configuration or expertise in futures markets.
---
## Support and Updates
This indicator is actively maintained and updated based on user feedback and market conditions. For questions about implementation or custom modifications, please use the comments section below.
**Disclaimer:** This indicator is for educational and informational purposes only. Past performance does not guarantee future results. Always conduct your own analysis and risk management before trading.
Индикатор Pine Script®