W Pattern Finder📊 W Pattern Finder
English:
This indicator automatically detects W-Patterns (Double Bottoms) following the HLHL structure and marks the last four crucial points on the chart.
Additionally, it draws the neckline, a Take Profit (TP) and a Stop Loss (SL) – including a Risk/Reward ratio.
✨ Features
* Automatic detection of W-Patterns (Double Bottoms)
* Draws the neckline and the last 4 key points
* Calculates and displays TP and SL levels (with adjustable RR ratio)
* Auto-Clear: All objects are removed once TP or SL is reached
* Fully customizable colors & widths for pattern, TP and SL lines
* Tolerance filter for lows to improve clean pattern recognition
* Visual marking of the W-pattern directly in the chart
⚙️ Settings
* Pivot Length → controls sensitivity of pattern detection
* Line color & width for the pattern
* Individual colors and widths for TP and SL lines
* Risk/Reward Ratio (RR) freely adjustable
* Tolerance (%) for deviation of lows
📈 Use Case
This indicator is especially useful for chart technicians & pattern traders who trade W-formations (Double Bottoms).
With the automatic calculation of TP & SL, it becomes instantly clear whether a trade is worth taking.
⚠️ Disclaimer:
This indicator is not financial advice. It is intended for educational and analytical purposes only.
Use it in trading at your own risk
Wpattern

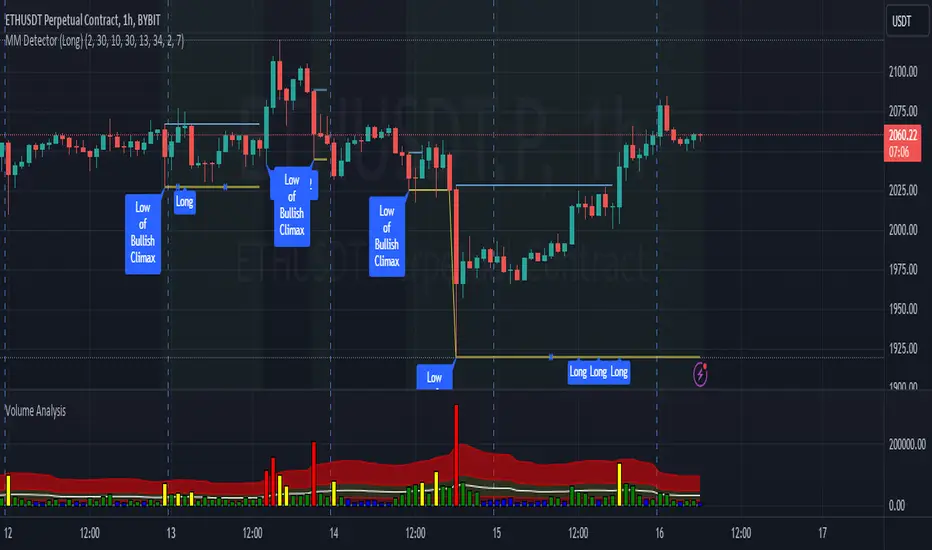
MM Detector (Long)This script tries to detect a market maker pattern.
A market maker pattern is usually made up of a high volume push down followed by a w pattern.
The script finds a market maker low with unusual volume and then looks for a push high (also with high volume) and usually through the ema 50.
The first push is normally a test but can be a good place to go long.
There are often atleast two pushes up in a MM pattern.
How to use.
Wait for the indicator to detect a market maker push low with high volume.
Along with other confirmations, go long when the indicator prints the first or second long push.
V Bottom & V Top Pattern [Misu]█ This indicator shows V bottom & V top patterns as well as potential V bottom & V top.
These V bottom & V top are chart powerful reversal patterns.
They appear in all markets and time-frames, but due to the nature of the aggressive moves that take place when a market reverses direction, it can be difficult to identify this pattern in real-time.
To address this problem, I added potential V pattern as well as the confirmed one.
█ Usages:
You can use V top & V bottoms for reversal zones.
You can use it for scalping strategies, as a main buy & sell signal.
Potential V patterns can be used to anticipate the market, in addition to volatility or momentum indicators, for example.
█ How it works?
This indicator uses pivot points to determine potential V patterns and confirm them.
Paramaters are available to filter breakouts of varying strengths.
Patterns also have a "max number bars" to be validated.
█ Why a Strategy type indicator?
Due to the many different parameters, this indicator is a strategy type.
This way you can overview the best settings depending on your pair & timeframe.
Parameters are available to filter.
█ Parameters:
Deviation: Parameter used to calculate parameters.
Depth: Parameter used to calculate parameters.
Confirmation Type: Type of signal used to confirme the pattern.
> Mid Pivot: pattern will confirm on mid pivot breakout.
> Opposit Pivot: pattern will confirm on opposit pivot breakout.
> No confirmation: no confirmation.
Lenght Avg Body: Lenght used to calculate the average body size.
First Breakout Factor: This factor multiplied by the "body avg" filters out the non-significant breakout of potential V pattern.
Confirmation Breakout Factor: This factor multiplied by the "body avg" filters out the non-significant breakout for the confirmation.
Max Bars Confirmation: The maximum number of bars needed to validate the pattern.
