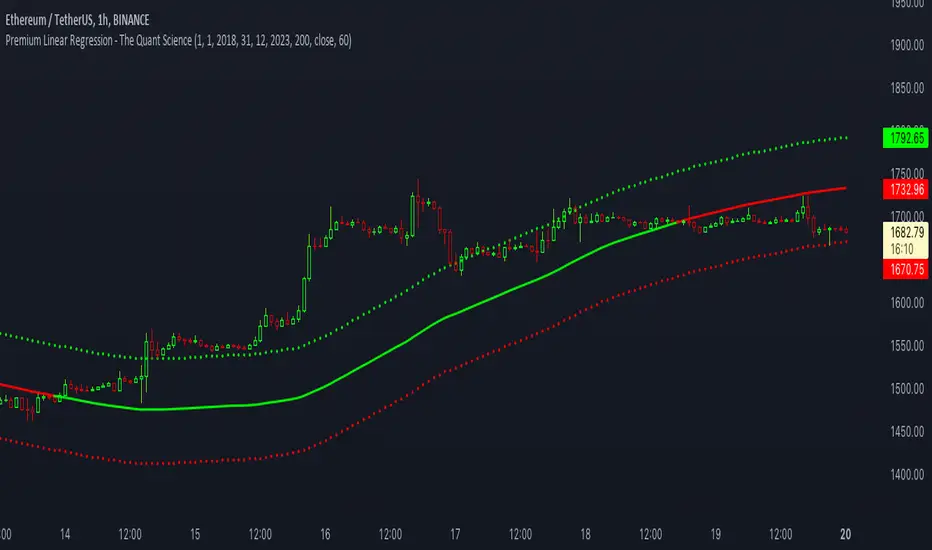
Premium Linear Regression - The Quant ScienceThis script calculates the average deviation of the source data from the linear regression. When used with the indicator, it can plot the data line and display various pieces of information, including the maximum average dispersion around the linear regression.
The code includes various user configurations, allowing for the specification of the start and end dates of the period for which to calculate linear regression, the length of the period to use for the calculation, and the data source to use.
The indicator is designed for multi-timeframe use and to facilitate analysis for traders who use regression models in their analysis. It displays a green linear regression line when the price is above the line and a red line when the price is below. The indicator also highlights areas of dispersion around the regression using circles, with bullish areas shown in green and bearish areas shown in red.
X-indicator
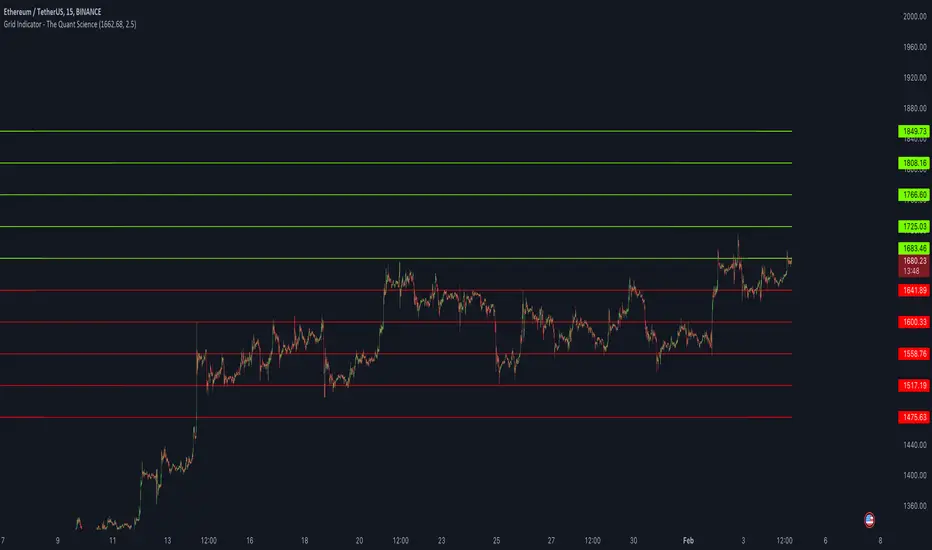
Grid Indicator - The Quant ScienceQuickly draw a 10-level grid on your chart with our open-source tool.
Our grid tool offers a unique solution to traders looking to maximize their profits in volatile market conditions. With its advanced features, you can create customized grids based on your preferred start price and line distance, allowing you to easily execute trades and capitalize on price movements. The tool works automatically, freeing up your time to focus on other important aspects of your trading strategy.
The benefits of using this tool are numerous. Firstly, it eliminates the need for manual calculation, making the analysis process much more efficient. Secondly, the automatic nature of the tool ensures that each grids are draw at precisely prices, giving you the best possible chance of maximizing your analysis. Finally, the ability to easily customize grids means that you can adapt your strategy quickly and effectively, even in rapidly changing market conditions.
So why wait? Take control of your trading and start using our innovative grid tool today! With its advanced features and ease of use, it's the perfect solution for traders of all levels looking to take their trading to the next level.
HOW TO USE
Using it is easy. Add the script to your chart and set the price and distance between the grids.
PinBar Detector [Mr_Zed]Pinbar Detector is a technical analysis tool designed to detect Pinbar patterns in financial markets. Pinbars are reversal patterns that indicate a potential change in trend.
This indicator is based on an existing Pinbar detector in MQ4/5 format, originally developed by "earnforex".
The PineScript version is written to work in TradingView, and can be applied to any chart to identify Pinbar formations. The indicator uses specific criteria to identify Pinbars, such as the length of the wick and the relationship between the wick and the body of the candlestick. By displaying the Pinbars on the chart, traders can make informed decisions about entering or exiting trades based on their analysis of the market's potential trend reversal.
enjoy !

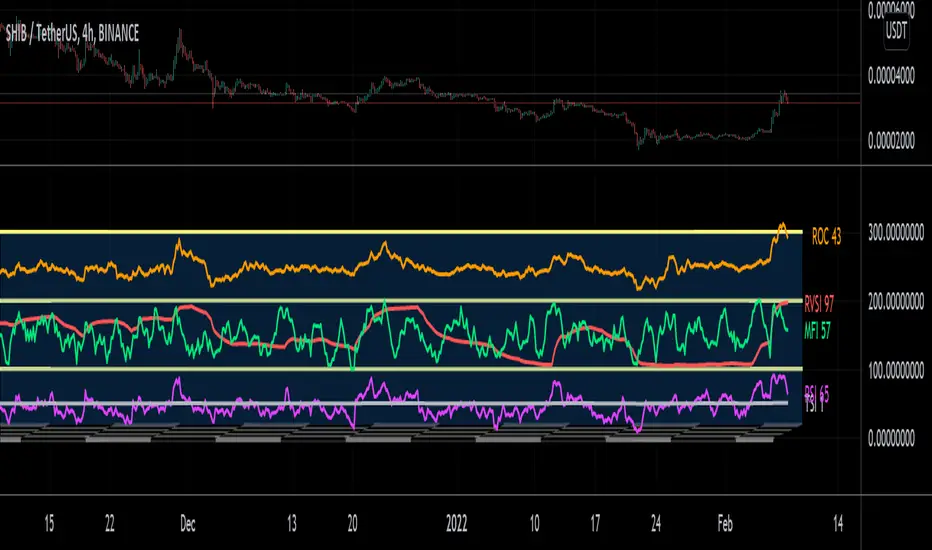
Stoch RSI 15 min - multi time frame tableABOUT THIS INDICATOR
This indicator calculates the Stochastic RSI for the time frames 15 min, 30 min, 1h, 4h, and 12h. However, the 15 min time frame should always be the default time frame for your chart.
IMPORTANT
* NOTE! It's extremely important that the chosen time frame for your chart is 15 min. Otherwise the Stochastic RSI for the longer time frames won’t be correctly calculated.
* Stochastic RSI will be calculated and displayed in a table for the time frames: 15 min, 30 min, 1h, 4h, 12h.
* All time frames are based on closed bars except the "15minR" that are realtime updated values calculated on a 15 min time frame.
ABOUT STOCHASTIC RSI
The Stochastic RSI (StochRSI) is a momentum indicator that ranges between 0 and 100. A Stochastic RSI value above 80 is considered overbought and below 20 is considered oversold.
By using different time frames you can get a better idea of what direction the trade could take in a "longer" perspective.
SETTINGS
1.) Length RSI = 14 (default period)
2.) Smoothing parameter of Stochastic RSI (Length Moving Average = 3) . Moving average of stochastic RSI
* By default the displayed Stochastic RSI values are smoothed values of the actual Stochastic RSI. The smoothnes is formed by a calculated moving average of with the length of 3 by default.
If you want Stochastic RSI with a sharper signal (higher risk for "false alarms" being more sensitive) change the Length Moving Average to = 1 (no smoothness at all)
You can see the selected "Length RSI" and "Length Moving Average" on top of the Stochastic RSI table.
Next version of this script will be updated with more a more flexible solution for different time frames.
* NOTE, Tradingview comes with a inbuilt Stochastic RSI. See the the chart below. The blue line in the Stochastic-RSI chart represents (K value = 3) the same value as the script calculate/display in the table.

CM_SlingShotSystem+_CassicEMA+Willams21EMA13 htc1977 editionThis strategy is a combination of 2 indicators based on EMA(actually x3 EMAs and Williams ind.
We usin this to see where EMA fast is above EMA slow(for long), entry position when price hit fast EMA and exit if trend changes or price overbought, or by stoploss 1%.
The opposite for a short position.
For better result You can change every EMA's, stoploss, Willam's ind and other visualisation in settings.
If You find good combination - please, let me know(if You want).
I will check it with ML, and attach it here.
Original indicators will write in comments

Stochastic Vix Fix SVIX (Tartigradia)The Stochastic Vix or Stochastic VixFix (SVIX), just like the Williams VixFix, is a realized volatility indicator, and can help in finding market bottoms as well as tops without requiring bollinger bands or any other construct, as the SVIX is bounded between 0-100 which allows for an objective thresholding regardless of the past.
Mathematically, SVIX is the complement of the original Stochastic Oscillator, with such a simple transform reproducing Williams' VixFix and the VIX index signals of high volatility and hence of market bottoms quite accurately but within a bounded 0-100 range. Having a predefined range allows to find markets bottoms without needing to compare to past prices using a bollinger band (Chris Moody on TradingView) nor a moving average (Hesta 2015), as a simple threshold condition (by default above 80) is sufficient to reliably signal interesting entry points at bottoming prices.
Having a predefined range allows to find markets bottoms without needing to compare to past prices using a bollinger band (Chris Moody on TradingView) nor a moving average (Hesta 2015), as a simple threshold condition (by default above 80) is sufficient to reliably signal interesting entry points at bottoming prices.
Indeed, as Williams describes in his paper, markets tend to find the lowest prices during times of highest volatility, which usually accompany times of highest fear.
Although the VixFix originally only indicates market bottoms, the Stochastic VixFix can also indicate good times to exit, when SVIX is at a low value (default: below 20), but just like the original VixFix and VIX index, exit signals are as usual much less reliable than long entries signals, because: 1) mature markets such as SP500 tend to increase over the long term, 2) when market fall, retail traders panic and hence volatility skyrockets and bottom is more reliably signalled, but at market tops, no one is panicking, price action only loses momentum because of liquidity drying up.
Compared to Hesta 2015 strategy of using a moving average over Williams' VixFix to generate entry signals, SVIX generates much fewer false positives during ranging markets, which drastically reduce Hesta 2015 strategy profitability as this incurs quite a lot of losses.
This indicator goes further than the original SVIX, by restoring the smoothed D and second-level smoothed D2 oscillators from the original Stochastic Oscillator, and use a 14-period ZLMA instead of the original 20-period SMA, to generate smoother yet responsive signals compared to using just the raw SVIX (by default, this is disabled, as the original raw SVIX is used to produce more entry signals).
Usage:
Set the timescale to daily or weekly preferably, to reduce false positives.
When the background is highlighted in green or when the highlight disappears, it is usually a good time to enter a long position.
Red background highlighting can be enabled to signal good exit zones, but these generate a lot of false positives.
To further reduce false positives, the SVIX_MA can be used to generate signals instead of the raw SVIX.
For more information on Williams' Vix Fix, which is a strategy published under public domain:
The VIX Fix, Larry Williams, Active Trader magazine, December 2007, web.archive.org
Fixing the VIX: An Indicator to Beat Fear, Amber Hestla-Barnhart, Journal of Technical Analysis, March 13, 2015, ssrn.com
For more information on the Stochastic Vix Fix (SVIX), published under Creative Commons:
Replicating the CBOE VIX using a synthetic volatility index trading algorithm, Dayne Cary and Gary van Vuuren, Cogent Economics & Finance, Volume 7, 2019, Issue 1, doi.org
Note: strangely, in the paper, the authors failed to mention that the SVIX is the complement of the original Stochastic Oscillator, instead reproducing just the original equation. The correct equation for the SVIX was retroengineered by comparing charts they published in the paper with charts generated by this pinescript indicator.
For a more complete indicator, see:

München's Momentum WaveMUNICH'S MOMENTUM WAVE:
This momentum tracker has features sampled from Madrid's moving average ribbon but has differentiated many values, parameters, and usage of integers. It is derived using momentum and then creates moving averages and mean lengths to help support the strength of a move in price action, and also has the key mean length that helps determine HL/LH or rejections into trend continuation. This indicator works on ALL TIME FRAMES, ALL ASSET CLASSES ON ALL SETTINGS!!
HOW DO I USE IT?
*First off, I have arranged the input settings into groups based on the parts of the indicator it affects.
*You want to use the aqua/white/yellow (Munich's line) as your leading indicator, this is a combined average of the MoM indicator.
* When using Munich's line you want to look at the relation to the mean line (the flat line that adjusts based on price action. You will often see rejections of this line into trend continuation. I personally have caught perfect LH/HL bounce trades off of this indicator.
* Use the Background and other colored moving averages to help pre-determine moves based on the -3 offset value of Munich's line. This was by design not to create 'accurate' results, but to help predict momentum swings based on sharper moves in price action better than if all values lined up to the current bar.
Cheat Code's Notes:
I hope you guys find this indicator to be useful, this is most likely the best indicator that I have written. Simply for the fact it is useful on any chart, any timeframe with any setting. If you guys have any issues with it, shoot me a pm or drop a comment. Thanks!
-CheatCode1
BINANCE:BTCUSDT BITSTAMP:ETHUSD BITSTAMP:BTCUSD PEPPERSTONE:JPYX TVC:DXY TVC:NDQ AMEX:SPY

CRYPTO MARKET SESSION ANALYZER INDICATORCrypto Market Session Analyzer is an easy-to-use yet powerful analysis tool that helps the trader visualize and analyze price movements over three different trading sessions:
1) European Session
2) US session
3) Asian session
Automatically tracks the corresponding levels for each market session.
This indicator can be used on all timeframes equal to or less than 15 minutes.
Although this is a simple indicator to use, some care must be taken when using it. The trader must be careful to set the correct times for each session according to his UTC timezone. By default the indicator uses UTC. If your console is set to UTC + 2 for example, you will need to take this into account and align the times correctly. You can adjust the time for each session from the user interface. Following the example, if the opening of the UE session is set to 9 and UTC of your console is set to UTC + 2, the script will proceed to create the level at opening time 11.
HOW IT WORK
The indicator automatically draws a horizontal line at the open and a horizontal line at the close of each session. The indicator clears past support and resistance every 24 hours to provide a clean and easy-to-read chart, updating new levels session after session.
Blue indicates the EU session.
Orange indicates the US session.
Purple indicates the Asian session.

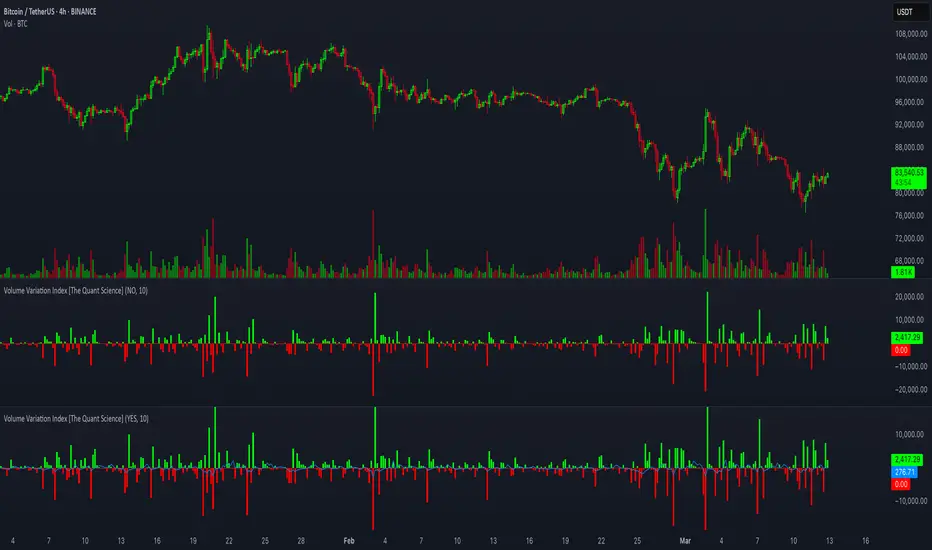
Volume Variation Index IndicatorThis tool is a quantitative tip for analysts who study volumes or create volume based trading strategies.
Like all our projects, we start with a statistical logic to which we add coding logic.
This indicator can save a huge amount of time in calculating the variation of volume between sessions .
How it work
The indicator calculates the difference between the volume of the last closing bar and the volume of the previous closing bar. It shows the difference between the trading volumes.
The session in which the trading volume is up are represented in green.
Red session represent trading volume down.
We have added a third function.
Through the User Interface the trader can activate or deactivate the variation average.
The indicator is able to calculate the average of the volume changes by representing it with a blue line.
To activate the average, simply set it to ON in the User Interface.
By default, the indicator calculates the average of the last 10 periods, but you are free to set this parameter in the User Interface.
Data access
To access the data, simply move the cursor. When you move the cursor over the green bars, the increase data will be displayed in green. By hovering the cursor over the red bars you will see the decrease data in red. By hovering the cursor over the average will show you the average data in blue.
The data is displayed in the top left corner of the indicator dashboard.
If you found this indicator helpful, please like our script.
Display CaseDisplay Case is a customizable multiple Indicator package that is usable right out of the box or can be modified to include your favorite oscillators, moving averages, or anything else! The display case dimensions and colors can be user defined in the Settings menu, as well as the candle length and heights of each indicator so they can be stacked separately or together as desired. Finally, color matched labels are generated to easily reference each indicator and its value without having to clog the scale display or reference the Settings. This is a light resource indicator that won't bog your chart, but allow you to easily switch between some of the most popular indicators quickly and easily!
And, besides, what other indicator has a checkerboard floor?!
FEAR & GREED INDICATORBINANCE:BTCUSDTPERP
Hello
The crypto index, which is currently only for Bitcoin, captures bearish and bullish trends by gauging investor sentiment for the coin. As the name suggests, the market trend is identified based on two emotions – fear and greed.
This configurations are set for 1D BTC charts
This is simple script, based on cheatcountry script
Enjoy ;)


VIX MTF MomentumSweet little momentum gadget to track the VIX Index.
What is the VIX?
The CBOE S&P 500 Volatility Index (VIX) is known as the 'Fear Index' which can measure how worried traders are that the S&P 500 might suddenly drop within the next 30 days.
When the VIX starts moving higher, it is telling you that traders are getting nervous. When the VIX starts moving lower, it is telling you that traders are gaining confidence.
VIX calculation?
The Chicago Board of Options Exchange Market Volatility Index (VIX) is a measure of implied volatility (Of the S&P 500 securities options), based on the prices of a basket of S&P 500 Index options with 30 days to expiration.
How to use:
If VIX Momentum is above 0 (RED) traders are getting nervous.
If VIX Momentum is below 0 (GREEN) traders are gaining confidence.
Follow to get updates and new scripts: www.tradingview.com

Fearzone (Expo) - Contrarian Indicator"Be fearful when others are greedy, and greedy when others are fearful" - Warren Buffett. Fearzone is a contrarian indicator that gives us an indication when fear begins to take over in the market. Traders should be prepared for increased volatility and good trading opportunities.
The Fearzone is visualized with red candlesticks below the price.
This version of the FearZone indicator is slightly different from the one ©kruskakli has published.
HOW TO USE
1. Use the indicator to identify when investors are fearful.
2. Use the indicator to identify potential reversal points.
INDICATOR IN ACTION
1 hour chart
5 min chart
I hope you find this indicator useful , and please comment or contact me if you like the script or have any questions/suggestions for future improvements. Thanks!
I will continually work on this indicator, so please share your experience and feedback as it will enable me to make even better improvements. Thanks to everyone that has already contacted me regarding my scripts. Your feedback is valuable for future developments!
-----------------
Disclaimer
Copyright by Zeiierman.
The information contained in my scripts/indicators/ideas does not constitute financial advice or a solicitation to buy or sell any securities of any type. I will not accept liability for any loss or damage, including without limitation any loss of profit, which may arise directly or indirectly from the use of or reliance on such information.
All investments involve risk, and the past performance of a security, industry, sector, market, financial product, trading strategy, or individual’s trading does not guarantee future results or returns. Investors are fully responsible for any investment decisions they make. Such decisions should be based solely on an evaluation of their financial circumstances, investment objectives, risk tolerance, and liquidity needs.
My scripts/indicators/ideas are only for educational purposes!

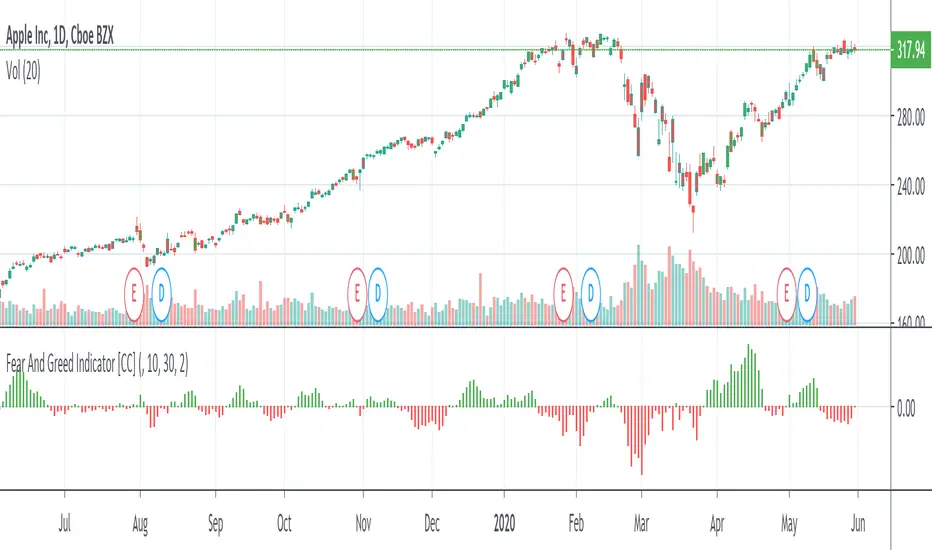
Fear And Greed IndicatorThe Fear And Greed Indicator is a very popular indicator on the Bloomberg platform and since I didn't have actual source code to work with, this is a very close approximation of that indicator. Let me know if you spot any discrepancies with the original and I will do my best to fix them.
For buy and sell signals it is pretty straightforward. Just buy when the green (greed) is in control and sell when the fear (red) is in control
This was a special request so let me know if you want to see more scripts from me or if you want something custom!

VWAP y Standar DeviationThis script presents the real VWAP (Yellow line), in 50 period VWAP (Blue Line) and the 120 period VWAP (Red Line). Additionally, it presents the values of 1 and 1,618 standard deviations of the VWAP of 50 periods.
This confirmation allows to visualize the behavior of the price in realicon to the VWAP key indicator that represents the midpoint of the operating volumes in a period.
This script evaluates the deviation of the price in relation to the average of the volume traded in the different periods.
The indicator settings allow changing the length of the VWAP for custom settings. Standard deviations are determined based on VWAP 2. VWAP 1 is a reference for determining the global trend of movement in the established period.
The upper and lower limits of the representative Standard Deviation of 1.618 (Fibonacci Number) are used as confirmation of continuation of a trend once crossed by the price.
During the ranges the 1.618 limits of the Dev. Standard are used as entry and exit points of the operation (For this it is necessary to adjust the VWAP 2 to the studied temporality and the operated asset)

Logistic DifferenceLogistic Difference Indicator uses logistic function (sigmoid), which stabilizes the variance of data.

All-In-One EMA Boll Cross SignalsThis one combines many commonly used indicators and signals into one.
1. EMA lines
2. SMA lines
3. Bolling Bands (EMA based)
4. Ichimoku cloud
5. 3/8, 10/20 EMA crosses
6. 5/10 SMA crosses
7. MACD crosses


Anomaly Indicator V1.1 The Anomaly Indicator is an idea I recently come up with. Its very simple, yet it can be extremely useful. The Anomaly indicator detects the current and general trend channels. When the yellow line which is the current channel, exits the general channel this will usually mean an anomaly. Anomalies can vary within meaning, from a trend reversal, a market change (trending or rangebound) and lastly it can also give you an entering point. You can even use it to know the volatility of the market.
This is a very early version of the indicator and has pre-set values. I personally use it among a 5 minute chart for daytrading.
NOTE : Have in mind my indicator as ny other is not perfect, it might give fake signals. I suggest using Williams Alligator, and RSI with it. Best of luck. Follow my predictions under your own risk.

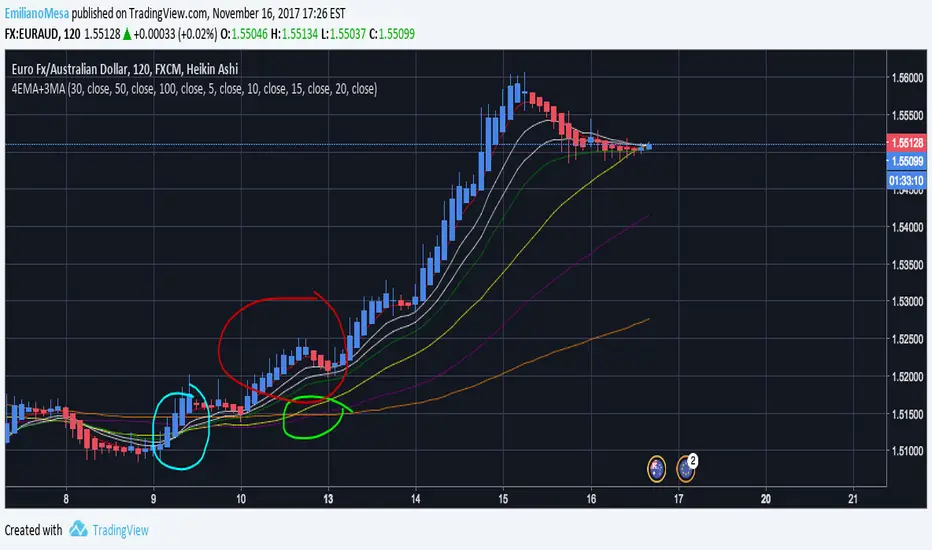
4EMA+3MABased on LazyBear 8MA I decided to do something similar for my personal use. I created an "Alligator" which works with 4 EMA lines and without "future" prediction, it will show you the most recent trend only, creating a later call than the original alligator yet a more precise one. Then there are the 3 MA with huge periods, including 30,50,100. This allows the trader to have a more general idea of the trend compared to that of the 4EMA's which in fact give more value to the current trend. You can change all colors and values.
Details:
As you can see in the graph both EMA & MA work great together. For instance look the blue circle, EMA "Alligator" was crossed giving entry for an early call (which was right), and later on the MA's crossed too! Giving the indication a huge trend was about to appear.
NOTE: Follow my predictions under your own risk. I apreciate all constructive feedback and support on how to improve. Thank you.
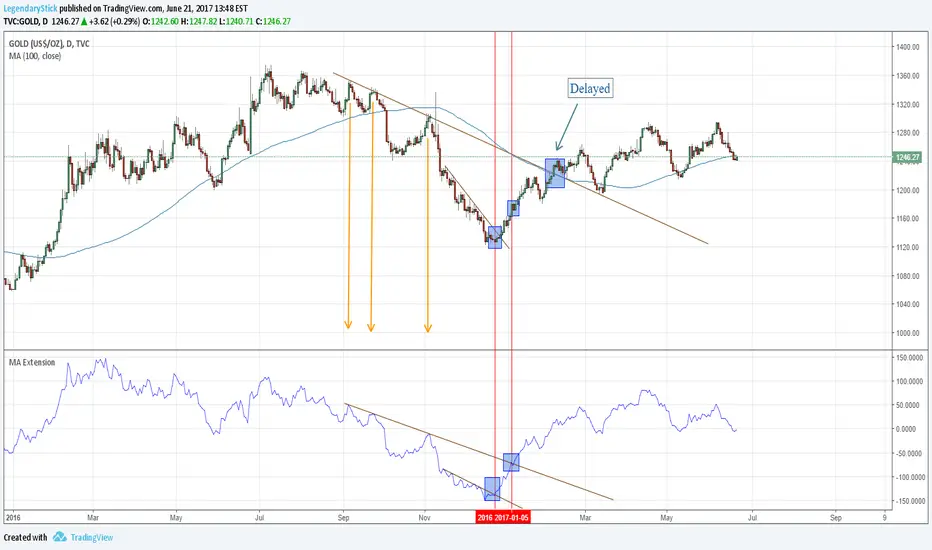
MA ExtensionThis indicator measures the vertical distance form the current close to the MA of your choice. I find that it does not work best as an oscillator, but it works well for providing early signals for taking profits when trend continuating. For example, if you go short due to a retracement to the MA (of your choice) take profits when a bearish trendline is broken (signalling the start of a bullish correction) that corresponds to the highs of the chart. The logic behind this indicator is that the breakouts of trendlines of an assets difference from an MA will precede corresponding breakouts of trendlines drawn on raw price. Kind of like Momentum, except it takes trend into account. Momentum has the same leading feature when it comes to drawing trendlines , but trendlines will be harder to draw due to the Momentum indicators oscillatory behavior.