Volume With ColorVolume with color helps to quickly identify accumulation or distribution.
An accumulation day is an up day with volume greater than a user selected average.
A distribution day is a down day with volume greater than a user selected average.
This indicator will highlight those days by changing the volume bar colors for an easy visual.
X-volume
[potatoshop] Volume Profile lower timeframeThis script is a volume profile that displays the volume of transactions in price blocks over a recent period of time.
For a more detailed representation, OHCLV values on the time frame lower than the time zone on the chart were called and expressed.
Low time frames are adjustable.
You can adjust the number of blocks and the most recent time period that you want to view.
Although it cannot be compared to the volume indicators provided for paid users of Trading-View, it has functioned by displaying transactions that are difficult to find on open source.
Displays the amount traded in each block and the percentage of the total over a given period.
POC represents the middle value of the block with the highest transaction volume as a line.
TPOC represents the block that stayed the longest regardless of the volume of transaction.
The reversal line appears when you determine the trading advantage of the rising and falling closing on a block basis and then have a different value from the neighboring blocks.
(I didn't mean it much, but I just put it in for fun.)
It represents the total volume of transactions traded in each block, and there are also check boxes in the settings window that represent the volume of transactions that closed higher and closed lower.
You can specify the color of each block.
The highest and lowest values for the set period and the total sum of each block are displayed at the bottom of the box.
Because it was made using a lot of arrays, the total transaction volume was marked separately to check the value.
When expressing the price block according to the trading volume percentage, it was a pity that the minimum pixel was 1 bar, so it could not be expressed delicately.
Although set to bar_time in Box properties xloc, 1 bar was actually the minimum unit of the X-axis value.
The logic used to place the transaction volume for each block is as follows.
1. Divide the difference between the high and low values of 1 LTF bar by the transaction volume .
2. Find the percentage of this LTF bar within each block.
3. Multiply the ratio by the transaction volume again.
4. Store the value in each block cell.
Below are the codes of the people I referred to this time.
1. ‘Time & volume point of control (TPOC & VPOC)’ by quantifytools
2. ‘Volume Profile ’ by LuxAlgo
3. ‘Volume Profile and Volume Indicator by DGT’ by dgtrd
The script is for informational and educational purposes only.
이 스크립트는 최근 일정 기간동안의 거래량을 가격 블록단위로 표시해 주는 볼륨 프로화일입니다.
좀 더 자세한 표현을 위해 차트상의 시간대보다 낮은 시간 프레임상의 OHCLV 값들을 호출하여 표현하였습니다.
낮은 시간 프레임은 조절 가능합니다..
보고 싶은 최근 일정 기간과 블럭 갯수를 조절할 수 있습니다.
트뷰 유료 사용자들을 위해 제공하는 지표와는 비교할 수는 없지만, 오픈 소스상에서는 찾기 힘든 거래량을 표시해 기능을 넣었습니다.
각 블럭에서 거래되었던 양 과 주어진 기간 동안의 총량 대비 퍼센트를 표시해 줍니다.
POC는 거래량이 가장 많았던 블럭의 중간값을 라인으로 표현해 줍니다.
TPOC는 거래량에 상관없이 가장 오랜 시간 머물렸던 블럭을 표현해 줍니다.
반전선은 블럭 단위로 상승 마감과 하락 마감의 거래량 우세를 결정한 뒤, 이웃 블럭들하고 다른 값을 가질 때 나타납니다.
(어떤 뜻을 갖고 만든 건 아니고 그냥 재미로 넣어 보았습니다.)
각 블럭에서 거래되었던 총거래량을 표현해 주며, 또한 설정창에서 상승 마감한 거래량과 하락 마감한 거래량을 표현하는 체크 박스가 있습니다.
각 블럭의 색깔을 지정하실 수 있습니다.
설정된 기간 동안의 최고값과 최저값, 각 블럭을 합친 총량을 박스 하단에 표시해 두었습니다.
어레이를 많이 사용하여 만들었기 때문에 값의 확인을 위해 전체 거래량을 따로 표시하였습니다.
가격 블럭을 거래량 퍼센트에 따라 표현할 때, 최소 픽셀이 1bar 이어서 섬세하게 표현 할 수 없어 안타까웠습니다.
박스 속성을 xloc.bar_time 로 설정하였지만 실제로는 1 bar가 X축 값의 최소 단위였습니다.
각 블록 별로 거래량을 배치 할 때 쓰인 로직은 다음과 같습니다.
1. 1 LTF bar의 하이 와 로우 값의 차이를 거래량으로 나누어 줍니다.
2. 각 블록 안에서 이 LTF bar가 차지 하는 비율을 구합니다.
3. 그 비율에 다시 거래량을 곱해 줍니다.
4. 그 값을 각 블록 셀에 저장해 줍니다.
밑에 제가 이번에 참고한 분들의 코드들입니다.
1. ‘Time & volume point of control (TPOC & VPOC)’ by quantifytools
2. ‘Volume Profile ’ by LuxAlgo
3. ‘Volume Profile and Volume Indicator by DGT’ by dgtrd

Power Indicator - EMAs + VWAP + Volume BarThe Power Indicator is intended to return some exponential moving average, vwap, volume bar, and others. With this compilation, you will be able to use them as one indicator in Trading View.
The components are:
- EMA9 - Exponential Moving Average of 9 days
- EMA21 - Exponential Moving Average of 21 days
- EMA50 - Exponential Moving Average of 50 days
- EMA200 - Exponential Moving Average of 200 days
- Volume Bar - This indicator provides the volume of the candle and its strength by showing different colors. It's a way to check expressive volume in one bar.
- Vwap line
- Indicator
If you have any questions, let me know!
Money Flow IntensityThis indicator works very similarly to Elder's Force Index (EFI) and builds on top of what I have for the Money Flow Line (see my other scripts). It combines price movements with volume to create sort of "dollar flow" pressure up and down, looking for "smart money" ("big money") to make their move.
The indicator uses a lookback period to calculate a standard deviation of the movement intensity, then creates gradients to visualize how intense the movement is relative to other movements. This helps measure the pull away from the average more easily than with the Money Flow Line alone.
Much like with EFI, high intensity moves can indicate two things:
1. Strength and conviction in the current direction OR...
2. A reversal is coming soon
You can also watch for waning volume in the current direction, indicating that a trend is losing interest and may be due for a pullback.
There is no way to know, but combining this with price action and a trend indicator can help give you some good educated guesses about what could happen next. Combine with averaging in or out and managing risk appropriately. Good luck :)
Aggregated Volume Spot & Futures ⚉ OVERVIEW ⚉
The indicator presents a comprehensive approach to Aggregated Volume Data . Works on almost all CRYPTO Tickers!
The script also includes several input parameters that allow the user to control which exchanges and currencies are included in the aggregated data.
This script allows the user to choose from several data display modes, including volume, spot & perp, delta, cumulative delta, and others.
The user can also choose how volume is displayed (in assets, U.S. dollars or euros) and how it is calculated (sum, average, median, or dispersion).
WARNING Indicator is for CRYPTO ONLY.
______________________
⚉ SETTINGS ⚉
‾‾‾‾‾‾‾‾‾‾‾‾‾‾‾‾‾‾‾‾‾‾
Mode — Choose Mode.
• Volume — This displays the Volume
• Volume (Colored) — Shows aggregated volume but applying different volume colors for different exchanges.
• Delta — This displays the difference between the number of sellers and buyers.
• Cumulative Delta — This displays the cumulative delta between sellers and buyers.
• Spot & Perp — Shows Spot and Futures volume at the same time.
• Delta (Spot - Perp) — Shows the difference between Spot and Futures Volume.
• Liquidations — Displays Potential Liquidations. (Calculated between the difference in volume between Futures and Spots)
• OBV — On Balance Volume.
• MFI — Money Flow Indicator.
• Data Type — Choose Single or Aggregated data.
• Single — Show only current Volume.
• Aggregated — Show Aggregated Volume.
Volume By — You can also select how the volume is displayed.
• COIN — Volume in Actives.
• USD — Volume in United Stated Dollar.
• EUR — Volume in European Union.
• RUB — Volume in Russian Ruble.
Calculate By — Choose how Aggregated Volume it is calculated.
• SUM — This displays the total volume from all sources.
• AVG — This displays the average price of the volume from all sources.
• MEDIAN — This displays the median volume from all sources.
• VARIANCE — This displays the variance of the volume from all sources.
* 🡅 Be Careful, Reacts to Every Mode.
Additional features
• Show MA — Show Movieng Average of Volume.
• MA Period — Period of MA.
• Lookback — Lookback period for 'Cumulative Delta' and for 'MFI'.
• Liquidation Filter — Filters out small or negative difference values.
• Show Table — Table shows the current volume of the last candle. Also in the Mode "Colored" shows the color of exchanges if they have volume.
________________
⚉ NOTES ⚉
‾‾‾‾‾‾‾‾‾‾‾‾‾‾‾‾
I don't pretend to be the best choice for calculating CVD , Delta and Liquidations, the calculations are chosen to be optimal from what I have seen and know.
If you have any ideas what to add to my work to add more sources or make calculations cooler, suggest in DM .

On Balance Volume CrossoversCheck on balance volume but with crossover. You can choose the smoothing method, which is set by default to use the Volume Weighted Moving Average (bringing volume to the equation is always a good idea) but you can change to SMA, MA, EMA, ...
Hope you guys enjoy it and don't forget to rate it up! :)
I plan to include % from 0-100 OBV in here later! Stay tuned.
Feedback is cool.
Igniting CandlesDisplays (and alerts) abrupt changes in volume, by default it compares previous candle volume to the current one but average volume over custom look-back period can be specified. Simply adjust filter to the volume change (or average volume) required before visual indication and alert will fire.
The theory is that large changes in volume forecast the future movement; certainly combine this indicator with other tools to build a more sound trading plan.

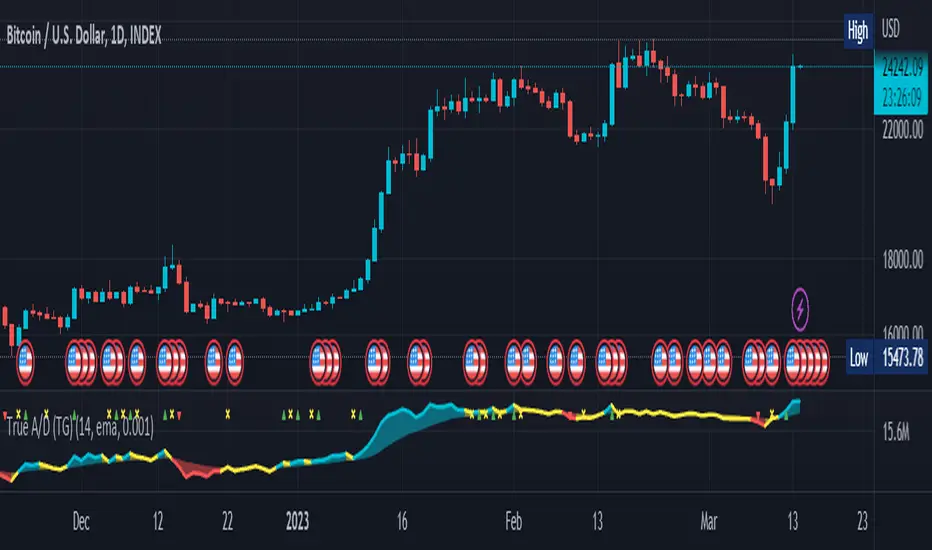
True Accumulation/Distribution (TG fork)An accumulation/distribution indicator that works better against gaps and with trend coloring.
Accumulation/Distribution was developed by Marc Chaikin to provide insight into strength of a trend by measuring flow of buy and sell volume .
The fact that A/D only factors current period's range for calculating the volume multiplier causes problem with price gaps. They are ignored or even misinterpreted.
True Accumulation/Distribution solves the problem by using True Range instead of only relying on current period's high and low.
Most of the time, True A/D reverts to producing the same values as the original A/D. The difference between True A/D and original A/D can be better seen when a gap has occurred, True A/D has handles it better than Accumulation/Distribution which a bearish close in period's range cause it to misinterpret the strong buy pressure as sell volume
The Moving Average Cloud is simply the filling between the moving average and the True A/D. This feature was inspired by D7R ACC/DIST closed-source indicator, kudos to D7R for making such neat visual indicators (but unfortunately all closed source!).
This indicator was made to extend the original work by adding MTF support and a moving average cloud and coloring.
If you like this indicator, please show the original author RezzaHmt some love:
Liquidations by volume (TG fork)Shows actual liquidations on a per-candle basis by using the difference in volume between spot and futures markets.
i.e. volume on a futures market will be much higher if there are many liquidations.
By default, green represents short liquidations (hence a bullish move, hence why it's green), whereas red is for long liquidations (bearish move). The colors can be changed in the settings if you prefer an inverted theme.
Long liquidation data should in theory be more accurate than short liquidation data due to the inability to short on a spot market.
This indicator should be able to help identify trends by determining liquidation points in the chart.
Extended by Tartigradia to automatically detect the symbol (only for crypto assets found on Binance with a USDTPERP pair, so it works for ETH, BNB, etc) and add multi-timeframe support (MTF).
If you like the indicator, please show the original author Thomas_Davison some love:

Volume composition / quantifytools— Overview
While net volume is useful information, it can be a blunt data point. Volume composition breaks down the content of volume, allowing a more detailed look inside each volume node. Volume composition consists of the following information:
Total volume (buy and sell). By default gray node.
Dominating volume (buy or sell). By default dark green/dark red node.
Dominating active volume (buy or sell). By default light green/light red node.
Dominating volume as percentage of total volume.
Dominating active volume as percentage of total active volume.
Buy and sell volume is defined by volume associated with lower timeframe up/down moves. This classification is further broken down to passive/active, standing for decreasing/increasing volume, e.g. a move up with volume higher than previous bar volume = active buy volume, a move up with volume lower than previous bar volume = passive buy volume.
Volume data is fetched from a lower timeframe that is automatically adjusted to fit the timeframe you're using. By default, the following settings are applied:
Charts <= 30 min: 1 minute timeframe
Charts > 30 min & <= 3 hours : 5 minute timeframe
Charts > 3 hours & <= 8 hours : 15 minute timeframe
Charts > 8 hours & <= 1D: 1 hour timeframe
Charts > 1D & <= 3D : 2 hour timeframe
Charts > 3D: 4 hour timeframe
Timeframe settings can be changed via input menu. The lower the timeframe, the more precision you get but with the cost of less historical data and slower loading time. Users can also choose which source to use for determining buy/sell volume, e.g. using close as source, a close that is higher than previous close would be considered as buy volume. This could be replaced with OHLC4 for example, resulting in a volume direction based on OHLC average.
Volume composition of current chart can also be replaced with any other chart volume composition:
— Visuals
Breakdown of visual elements:
1. Symbol and timeframe used for volume composition calculations. By default the chart that is viewed and automatically selected lower timeframe.
2. Dominating volume threshold exceeded. Can be defined via input menu, 70% of total volume by default.
3. Dominating volume as percentage of total volume. Plotted below volume nodes, without % symbol.
4. Dominating active volume, + or - symbol, standing for buy and sell. Plotted below dominating volume percentage. When dominating volume and dominating active volume sides are in a disagreement (e.g. dominating volume is on buy side while dominating active volume is on sell side) this symbol will appear inside brackets, (+) or (-).
5. Dominating active volume as percentage of total active volume. Plotted below +/- symbol.
6. Dominating active volume threshold exceeded. Can be defined via input menu, 70% by default.
Dominating volume & active volume percentages can be rounded to single numbers to avoid clutter caused by overlapping values. The percentage values will be rounded to closest single number value, e.g. dominating volume percentage at 54% = 5, dominating volume percentage at 55% = 6.
Volume anomalies can be highlighted on the chart with a color for studying the events and their past implications in greater detail. Available anomalies for highlights are the following:
Buy volume threshold exceeded
Sell volume threshold exceeded
Active buy volume threshold exceeded
Active sell volume threshold exceeded
Volume & active volume divergence
— Practical guide
Volume is arguably one of the most important data points as it directly relates to liquidity. High volume can be an indication of strength (price likely to continue moving) or absorption (price likely to halt/turn). Same applies to active volume, but with an element of aggression. High active volume serves as an indication of exuberance or otherwise forceful transacting, like stop losses triggering. With these principles in mind, the composition of volume allows distinguishing potentially important events.
Example #1 : Identifying areas of trapped market participants
Often when volume spikes distinctively, we can make the case that price has found sufficient liquidity to halt/turn. Since we know which side was absorbed, in what quantity and type (passive/active), we can identify areas of trapped market participants. In such scenarios, the higher the dominant active volume and volume spike itself, the better.
Example #2 : Identifying a healthy trend
A healthy trend is one that has an active and consistent bid driving it. When this is the case, it can be seen in consistently supportive active volume.
Example #3 : Identifying inflection points
When dominant side of volume and dominant side of active volume diverge, something is up. A divergence often marks an area of indecision, hinting an imminent move one way or the other.

Volume CVD and Open InterestVolume, Cumulative Delta Volume and Open Interest are great indications of strength and sentiment in the market. Until now they have required separate indicators, but this indicator can show them all.
With a clean and aesthetic plot, this indicator has the option to choose the data source:
- Volume - the total volume of transactions, buys and sells
- Up Volume - the total volume from buys only
- Down Volume - the total volume from sells only
- Up/Down Volume (Net) - the difference in the Buy Volume and Sell Volume
- Cumulative Delta - the sum of the up/down volume for the previous 14 bars
- Cumulative Delta EMA - a smoothed average of the sum of the up/down volume for the previous 14 bars, over a 14 period EMA
- Open Interest - a user defined ticker, whose value is added to the plot, while this is designed to be used with Open Interest tickers, you can actually choose any ticker you want, perhaps you want to see DXY while charting Bitcoin!
There are several customization features for the colour of the plot, with a nice gradient colouring from high to low. You can choose the lookback which defines only the highest and lowest values for the colour gradient. There is also an option for how the Open Interest value is determined, based on Close, Open or differences between previous values.
While similar, Volume and Open Interest are not the same. To me the simplest explanation is Volume shows the trades that have been executed and the buy/sell direction, while Open Interest shows the value of open trades that are yet to be completed.
Volume shows strength, sentiment and volatility.
Open Interest does not show direction, but does indicate momentum and liquidity in the market.

Volume ChartVolume data can be interpreted in many different ways. This is a very basic script and novel idea to display volume as a chart. The purpose of this script is to visually help identify volume breakouts and other common chart patterns. While this indicator could be useful for finding big moves and early reversals it not reliable for determining the direction of the move.
Below is an example of a volume breakout:
Below is confirmation of the second ear in the batman pattern:
Lower highs and higher lows can give early signs of a reversal:
Below we can see retailers getting pumped and dumped on during the gaps while they sleep:

Combined Moving Averages + Squeeze & Volume Spike SignalsThis is a set of 4 combined moving averages. Each moving average is a combination of an EMA, SMA, HMA, RMA, WMA and VWMA with the same length as set in your input settings. All 6 of them are added together and then divided by 6 for an average of all of them. This is based on the theory that most traders use their own preference of moving averages, so combining them all should give us a better idea of where price should actually react since we are using the average of what most traders are using on their charts. It also smooths the moving averages out as well so you get a much easier to read moving average than any of them on their own which should help you hold positions longer and time your entries better.
The default lengths used for this indicator are as follows: 10, 50, 100 and 500. These lengths can be updated in the settings. The 10 and 500 will change colors when the individual moving average is less than or greater than its previous value. Price above or below the moving average does not affect the colors. The 50 and 100 are colored based on whether the 50 is greater/less than the 100.
The two middle length moving averages by default are the 50 and 100. This has been turned into a cloud because it is the area where price typically bounces, since tons of traders use the 50 and 100 moving averages. This should be your long/short zone when price is trending.
Each moving average can be set to use a different source such as close, open, high, low, ohlc4, etc. You can also adjust the length of each moving average. Default settings work well, but feel free to customize them to your liking. You can also change the colors of the lines in the settings.
Beware that changing the lengths of MA #2 and MA #3 will change the signals, squeezes and the cloud.
VOLUME SPIKES
The cloud will change to a brighter color when a volume spike is detected. When a major volume spike is detected, it will turn very bright colored green/red according to the direction of the cloud. This notifies you of volume spikes so you have a better idea of how strong the trend is. If the cloud is a dark green/red then that means that volume is less than or equal to the recent median volume.
SIGNALS
There are also signals that will be given when the current candle is in the cloud, the candle is going in the same direction as the cloud, the MA #2 and MA #3 is going in the same direction and a volume spike is detected. These help you identify good entries when markets are trending. Be cautious of these signals when the trend is sideways and not clearly moving in one direction. The signals can be turned on or off in the settings.
SQUEEZE
Many times when moving averages squeeze together, a big move happens shortly after. Because of this I added a yellow background color when a squeeze is detected. It looks at the median value difference of the MA #2 and MA #3 and if the current value difference is less than the median multiplied by the multiplier in the settings then it will change the background color to notify you. The default value of the multiplier is .6, meaning the squeeze signal will only show if the current value difference of the cloud is less than .6 of the median difference. The multiplier can be adjusted in the settings to suit your preferences. Lower values will only show tighter squeezes.
MARKETS
This indicator can be used on all markets including stocks, crypto, futures and forex.
TIMEFRAMES
This indicator can be used on all timeframes.
PAIRINGS
We recommend pairing this combined moving average with Trend Friend Swing Trade And Scalp Signals for extra confluence. Look for price to bounce in the cloud with good volume and a confirming signal from Trend Friend for highly probable moves.
Volume Candles Standardized (VCS)This is an indicator that shows the inflow and outflow of volume into a financial instrument. Volume is likely one of the most underrated source of data in trading unfortunately so there seems to be a lack of studies on it. The size of the candle is related to the strength of the move. The calculations for this are: cumulative sum of +volume if open < close OR -volume if open > close. I have added percentile bands so you know where the neutral zones and strong zones are. Interestingly you can also see what the volume is doing by watching where the neutral zone is. If the volume is in the red or green it is a strong move. This is standardized to make it more useful. Now you can see where the exhaustion points are on the short term. Dont forget you can change the settings and you wont die. Thank you for your interest in this release I hope you find great piles of money with it.
Up/Down Vol RatioThe Up/Down Volume Ratio is a tool utilized by investors.com. They describe it as "A 50-day ratio that is derived by dividing total volume on up days by the total volume on down days. A ratio greater than 1.0 implies positive demand for a stock."
It is best used to confirm buying or selling pressure in your stock in conjunction with price analysis.
Acknowledgment
The formula is obtained from the investors.com education section: education.investors.com
Thank you to @JohnMuchow for upgrading my code for best practices when publishing.

Volume Profile Volume Delta OI Delta [Kioseff Trading]Hello!
This script serves to distinguish volume delta for any asset and open interest delta for Binance perpetual futures.
The image above provides further explanation of functionality and color correspondence.
The image above shows the indicator calculating volume at each tick level and displaying the metric.
The label color outline (neon effect) is configurable; the image above is absent the feature.
The image above shows Open Interest (OI) Delta calculated - similar to how the script calculates volume delta - for a Binance Perpetual Future pair.
This feature only works for Binance Futures pairs; the script will not load when trying to calculate OI Delta on other assets.
Additionally, a heatmap is displayable should you configure the indicator to calculate it.
The image above shows a heatmap using volume delta calculations.
The image above shows a heatmap using OI delta calculations.
Of course, these calculations - when absent requisite data - require some assumptions to better replicate calculations with access to requisite data.
The indicator assumes a 60/40 split when a tick level is traded at and only one metric - "buy volume" or "sell volume" is recorded. This means there shouldn't be any levels recorded where "buy volume" is greater than 0 and "sell volume" equals 0 and vice versa. While this assumption was performed arbitrarily, it may help better replicate volume delta and OI delta calculations seen on other charting platforms.
This option is configurable; you can select to have the script not assume a 60/40 split and instead record volume "as is" at the corresponding tick level.
The script also divides volume and open interest if a one-minute bar violates multiple tick levels. The volume or open interest generated on the one-minute bar will be divided by the number of tick levels it exceeds. The results are, subsequently, appended to the violated tick levels.
Further, the script can be set to recalculate after a user-defined time threshold is exceeded. You can also define the percentage or tick distance between levels.
Also, it'd be great if this indicator can nicely replicate volume delta indicators on other charting platforms. If you've any ideas on how price action can be used to better assume volume at the corresponding price area please let me know!
Thank you (:

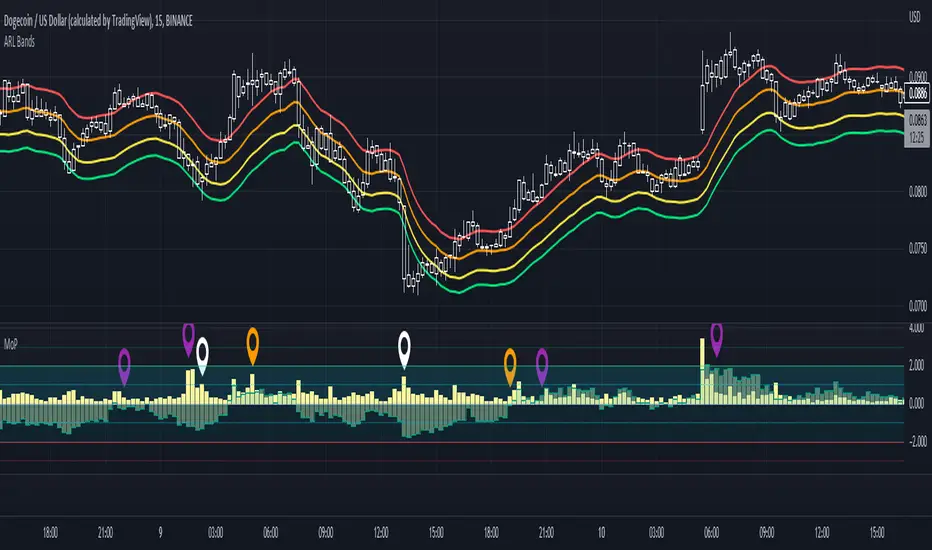
Movement Polarization (MoP)This shows the negative or positive charge of price movement and volume .
The "Polarization" shows how much negativity or positivity the movement of the price and volume have.
IMPORTANT:
Use with crypto currencies only is highly recommended.
If the volume in a currency is not visible, adjust the "Factor" number higher in the "Inputs" tab.
Adjust it until there is a balance between the vertical spread of the volume and polarization.
There will be a noticeable jump in the scale of the indicator if it is set too high.
The "Factor" is scaled at a baseline for SHIB prices. Any lower price scales than SHIB's will not show the volume .
Version:
This is a forked codebase to conserve the functionality of "RSI TV". The "RSI TV" focuses only on the RSI trend, this focuses on price and volume movement.
As such, there is no need for the MA of the RSI. Also, the TV Line from the "RSI TV" is used to show polarization of movement in this context.
The Trend Veracity line from the "RSI TV" has a broad scope in verifying different, particular trends, not just the RSI trend.
The RSI, volume, and polarization are all conveniently placed within the same scale to facilitate longer-term trading with price action. See also: "RSI TV" .
How this indicator is original; what it does, and how it does it:
This indicator has an original, unique ability to give the volume a further-projecting forecast.
The MoP does this by placing the volume on a vertical scale. It then compares it to a polarization level.
This gives 3 reference points: 1) Past data of volume, 2) volume vertical thresholds, and 3) polarization levels.
The volume by itself has no reference but its own past data. This gives a short-sighted forecast.
How to use it:
Useful with a trend finding indicator and price-action trading. See notes in picture above (scroll chart left to see first note).
Extra indicator shown in chart is an adjusted "ARL Bands" .
1) A condensing of volume and polarization usually means that an uptrend will soon turn.
2) A widening of volume and polarization usually means that a downtrend will soon turn.
3) A weak uptrend is indicated when volume falls while low, positive polarization also falls.
4) A growing uptrend is indicated when volume and positive polarization grow together.
5) Overlapping volume and positive polarization usually signifies oncoming peaks.
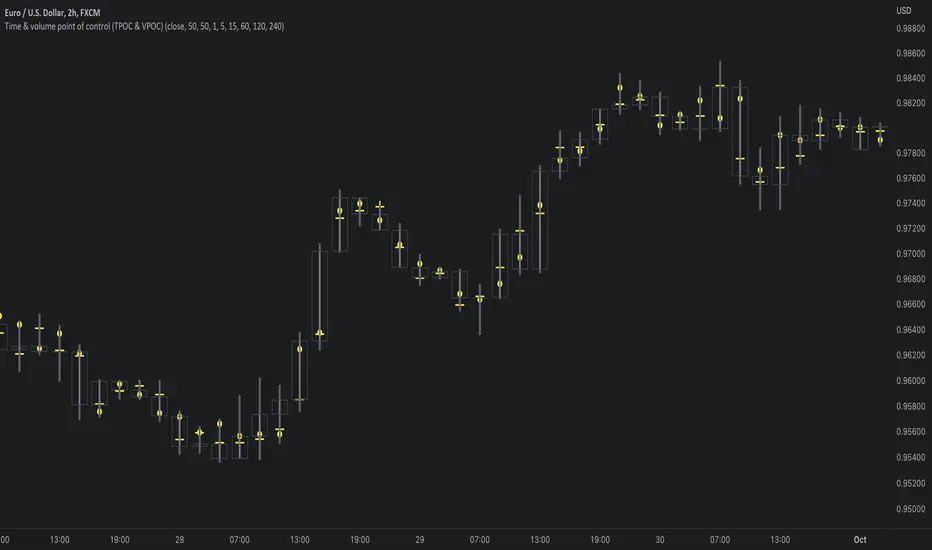
Time & volume point of control / quantifytoolsWhat are TPOC & VPOC?
TPOC (time point of control) and VPOC (volume point of control) are points in price where highest amount of time/volume was traded. This is considered key information in a market profile, as it shows where market participant interest was highest. Unlike full fledged market profile that shows total time/volume distribution, this script shows the points of control for each candle, plotted with a line (time) and a dot (volume). The script hides your candles/bars by default and forms a line in the middle representing candle range. In case of candles, borders will still be visible. This feature can be turned off in the settings.
Volume and time data are fetched from a lower timeframe that is automatically adjusted to fit the timeframe you're using. By default, the following settings are applied:
Charts <= 30 min: 1 minute timeframe
Charts > 30 min & <= 3 hours : 5 minute timeframe
Charts > 3 hours & <= 8 hours : 15 minute timeframe
Charts > 8 hours & <= 1D: 1 hour timeframe
Charts > 1D & <= 3D : 2 hour timeframe
Charts > 3D: 4 hour timeframe
Timeframe settings can be changed via input menu. The lower the timeframe, the more precision you get but with the cost of less historical data and slower loading time. Users can also choose which source to use for determining price for points of control, e.g. using close as source, the point of control is set to match the value of lower timeframe candle close. This could be replaced with OHLC4 for example, resulting in a point of control based on OHLC average.
To identify more profound points of market participant interest, TPOC & VPOC as percentage of total time/volume thresholds can be set via input menu. When a point of control is equal to or greater than the set percentage threshold, visual elements will be highlighted in a different color, e.g. 50% VPOC threshold will activate a highlight whenever volume traded at VPOC is equal to or greater than 50% of total volume. All colors are customizable.
VPOC is defined by fetching lower timeframe candle with the most amount of volume traded and using its close (by default) as a mark for point of control. For TPOC, each candle is divided into 10 lots which are used for calculating amount of closes taking place within the bracket values. The lot with highest amount of closes will be considered a point of control. This mark is displayed in the middle point of a lot:
How to utilize TPOC & VPOC
Example #1: Trapped market participants
One or both points of control at one end of candle range (wick tail) and candle close at the other end serves as an indication of market participants trapped in an awkward position. When price runs away further from these trapped participants, they are eventually forced to cover and drive price even further to the opposite direction:
Example #2: Trend initiation
A large move that leaves TPOC behind while VPOC is supportive serves as an indication of a trend initiation. Essentially, this is one way to identify an event where price traded sideways most of the time and suddenly moved away with volume:
Example #3: POC supported trend
A trend is healthy when it's supported by a point of control. Ideally you want to see either time or volume supporting a trend:
Market sessions and Volume profile - By LeviathanThis script allows you to keep track of Forex market sessions (Tokyo, London and New York), as well as Daily, Weekly and Monthly sessions. All of them are accompanied by Volume Profile options where you can view VP Histogram, Point of Control, Value Area High and Value Area Low.
Colors, lines and other design preferences are fully customizable.
* Volume Profile of shorter sessions (eg. Tokyo, London, New York) works better when using lower timeframes such as 15min, 5min, etc.
** Use timeframe higher than 15min when viewing Monthly sessions
Indicator settings overview:
SESSION TYPE
- Tokyo session (1:00 - 9:00 UTC/ GMT )
- London session (7:00 - 16:00 UTC/ GMT )
- New York session (13:00 - 22:00 UTC/ GMT )
- Daily session
- Weekly session
- Monthly session
DISPLAY
- Show Volume Profile (Show or hide Volume Profile histogram)
- Show POC (Show or hide Point Of Control line)
- Show VAL (Show or hide Value Area Low line)
- Show VAH (Show or hide Value Area High line)
- Show Live Zone (Show or hide the ongoing session)
VOLUME PROFILE SETTINGS
- Resolution (The higher the value, the more refined of a profile, but less profiles are shown on the chart)
- Smooth Volume Data (Useful for assets that have very large spikes in volume over large bars, helps create better profiles)
APPEARANCE
- Up Volume color (Pick a custom color for up/ bullish volume profile nodes)
- Down Volume color (Pick a custom color for down/ bearish volume profile nodes)
- POC color and thickness (Pick a custom color and thickness for Point Of Control line)
- VAH color and thickness (Pick a custom color and thickness for Value Area High line)
- VAL color and thickness (Pick a custom color and thickness for Value Area Low line)
- Session box thickness (Pick a custom thickness for the session box. Color is provided automatically with optimal contrast)
** Some VP elements are inspired by @LonesomeTheBlue's volume profile script

Volume HIGH/CLIMAX
Volume is the number of shares of a security traded during a given period of time.
Generally securities with more daily volume are more liquid than those without, since they are more "active".
Volume is an important indicator in technical analysis because it is used to measure the relative significance of a market move.
The higher the volume during a price move, the more significant the move and the lower the volume during a price move, the less significant the move.
A climax occurs at the end of a bull or bear market cycle and is characterized by escalated trading volume and sharp price movements.
Climaxes are usually preceded by extreme sentiment readings, either excessive euphoria at market peaks, or excessive pessimism at market bottoms.
Essentially, climaxes are a result of a resolution in supply and demand factors.
Buying Climaxes
One of the clearest signals of the end of a bull market is a buying climax, during which volume escalates to extreme levels and bullish euphoria permeates media coverage of stocks, market indices, or commodities . The key trait of a buying climax is the exhaustion of demand as the last buyers enter the market. The final surge of buying typically leads to price spikes, which may last for days, weeks, or months. As demand wanes, buyers become less willing to pay higher prices. There may be a brief period of stagnation in prices before a combination of profit-taking and new sellers set in motion the start of a sharp reversal.
Selling Climaxes
The beginning of a selling climax is often signaled by steadily increasing volume on the sell side of the market as growing pessimism accelerates the downtrend. As the selling climax approaches, the last buyers finally capitulate, driving shares sharply lower. Once the supply side of the market abates, demand at support levels can cause the price to level off before a combination of profit-taking and new buyers set in motion the start of a sharp reversal.
NIFTY IT volumeKEY TAKEAWAYS
-Uses NIFTY IT Index Stocks Volume .
-NIFTY IT Volume Indicator is created by adding all 10 NIFTY IT Stocks Volume together.
-NIFTY IT Volume will be an important indicator in NIFTY IT Index technical analysis because it is used to measure the relative significance of a market move.
-The higher the volume during a NIFTY IT index price move, the more significant the move and the lower the volume during a NIFTY IT index price move, the less significant the move.
-Moving Average is also added.

BetterVolumeAvgPinescript 5 version of buy/sell volume indicator with average. This script is original in that there are no versions of this study written in Pinescript 5 that I know of and while I've seen other buy/sell volume scripts this one includes a moving average.

BTC Agg VolumeBTC Volumes for stablecoin trading pairs from multiple exchanges. Volume is grouped by exchanged and appears as stacked bars. Volume data can be filtered by exchange and stablecoin pair. Appearance can be resized over with an option to apply standard deviations.
