Moving average convergence divergence (MACD) indicator
The moving average convergence divergence is a momentum indicator that measures the difference between two moving averages, providing a direct, unbounded view of how two averages converge and diverge over time. It also offers a gauge of price momentum and short-term trends.
CONTENTS:
What is moving average convergence divergence
The MACD indicator was originally created by Gerald Appel in the 1970s. In 1986, Thomas Aspray added a histogram line, which represents the difference between the MACD and signal line.
Now, the MACD consists of three parts:
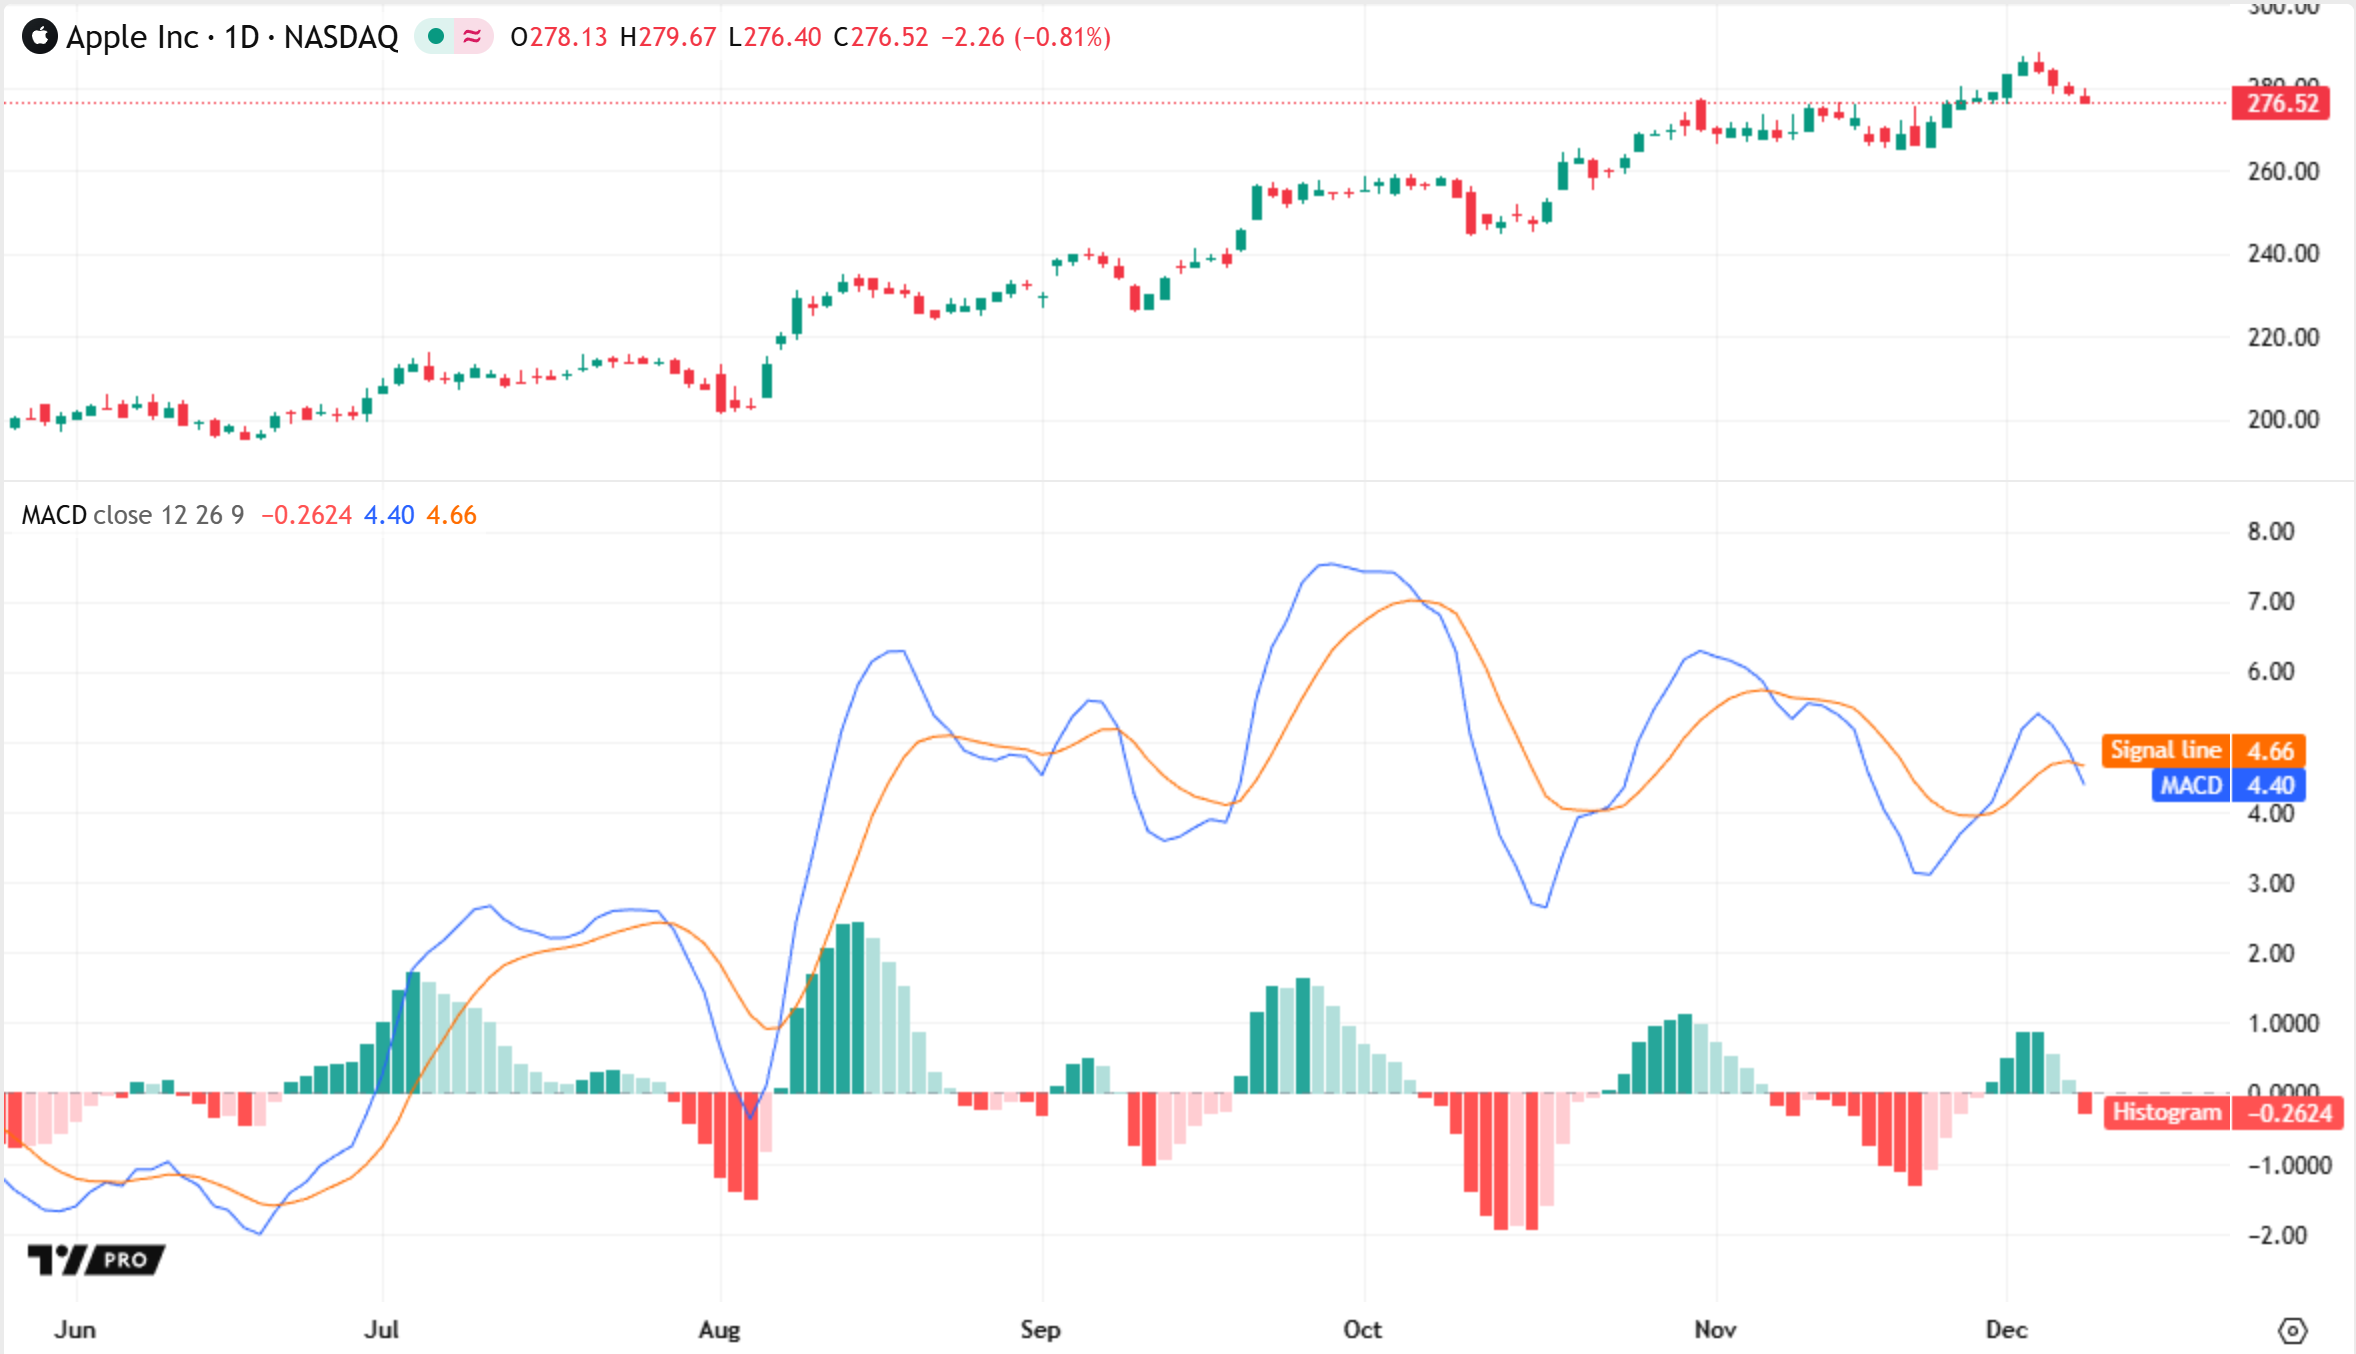
- The MACD line, which oscillates around zero as the two moving averages converge and diverge
- A smoothed signal line, which follows the MACD and provides crossing points for identifying potential reversals
- A histogram that provides a visualization to help identify strengthening or weakening momentum and anticipate possible MACD-signal crossovers
Our indicator displays all three series — the MACD, the signal line, and the histogram — in a separate chart pane.
By analyzing these values together, you can:
- Determine trend direction
- Assess price movement strength
- Identify potential turning points
- Spot momentum divergences and other patterns
How MACD is calculated
The indicator calculates the difference between two moving averages of different lengths to create the main MACD series. It smooths the MACD to derive a signal line and then computes the histogram by taking the difference between the MACD and signal line values.
MACD = Fast MA − Slow MASignal = Moving average of MACDHistogram = MACD − SignalWhere:
- Fast MA is the moving average with the lowest length
- Slow MA is the moving average with the highest length
The indicator plots the MACD and signal values as lines, and the histogram values as color-coded columns. It also displays a horizontal zero line to distinguish positive and negative values.
By using these values you can analyze momentum and trends in multiple ways. A few of the most common interpretations:
- The MACD moving above 0 indicates that the fast MA is greater than the slow MA. This suggests average upward momentum or a potential uptrend
- The MACD moving below 0 indicates that the fast MA is smaller than the slow MA. This suggests average downward momentum or a potential downtrend
- A histogram value above 0 or the MACD moving above the signal line, suggests that upward momentum is increasing or downward momentum is decreasing
- A histogram value below 0 or the MACD moving below the signal line, suggests that downward momentum is increasing or upward momentum is decreasing
What is MACD divergence
Divergences are discrepancies between price movement and the movement of a technical indicator. There are two types of divergences:
- Regular: Suggests weakening of the current trend or preparing to reverse
- Hidden: Suggests continuation of the current trend
Divergences between the relative movements of the market price and the MACD might help to identify turning points or shifts in trends. For example, falling peaks in the MACD as the price rises might indicate the exhaustion of an uptrend. Likewise, rising dips in the MACD while the price drops might signal the exhaustion of a downtrend.
Divergences between the movements of the MACD and the histogram can signal potential shifts in momentum. For example, falling histogram values as the MACD rises indicate that the MACD is increasing at a slower rate, suggesting the possible exhaustion of upward momentum. Rising histogram values while the MACD falls indicate that the MACD is decreasing at a slower rate, suggesting the potential exhaustion of downward momentum.
This indicator includes alert conditions for when the histogram changes from positive to negative, and vice versa, to signal the points where momentum might be shifting between rising and falling states. Refer to the Getting started with technical alerts article to learn how to use them.
MACD settings

- Source: The series of values for which to calculate the oscillator
- Fast length: The length value for the fast moving average
- Slow length: The length value for the slow moving average
- Signal length: The length value for the moving average of the MACD (signal line).
- Oscillator MA type: Specifies the type for the fast and slow averages in the MACD calculation. Select "EMA" to use two exponential moving averages, or "SMA" to use simple moving averages instead
- Signal MA type: Specifies which type of moving average the indicator applies to the MACD to calculate the signal line. Select "EMA" for an exponential moving average, or "SMA" for a simple moving average
- Timeframe: Sets the timeframe that the indicator uses for its calculations. The "Wait for timeframe closes" checkbox below determines whether the indicator shows results only when a bar on the specified timeframe closes. This can be especially helpful for multi-timeframe analysis
Also read: