TradingView ETF Screener: your shortcut to top funds
ETF Screener can help you navigate through various funds investing in indices, stocks, crypto, commodities, and other assets. There are so many of them that choosing the right one may be a challenge. With the ETF Screener, you can explore them and find those that help you feel more confident in your investments.
CONTENTS:
What is the ETF Screener
The ETF Screener is a financial analysis tool that allows you to apply various filters on multiple ETF aspects such as net asset value, holdings region, management style, and more. It displays both fundamental and technical information, as well as ETF charts — all in a single tool for your analysis.
Funds are helpful when you need to diversify your portfolio and minimize risk exposure. They can track the performance of indices or hold multiple stocks, so if one is losing its value, others may cover your loss. Also, funds can help you access certain assets like crypto, removing the burden of storing private keys and dealing with seed phrases or cold storage — just exposure to the price of the crypto assets.
How to access the ETF Screener
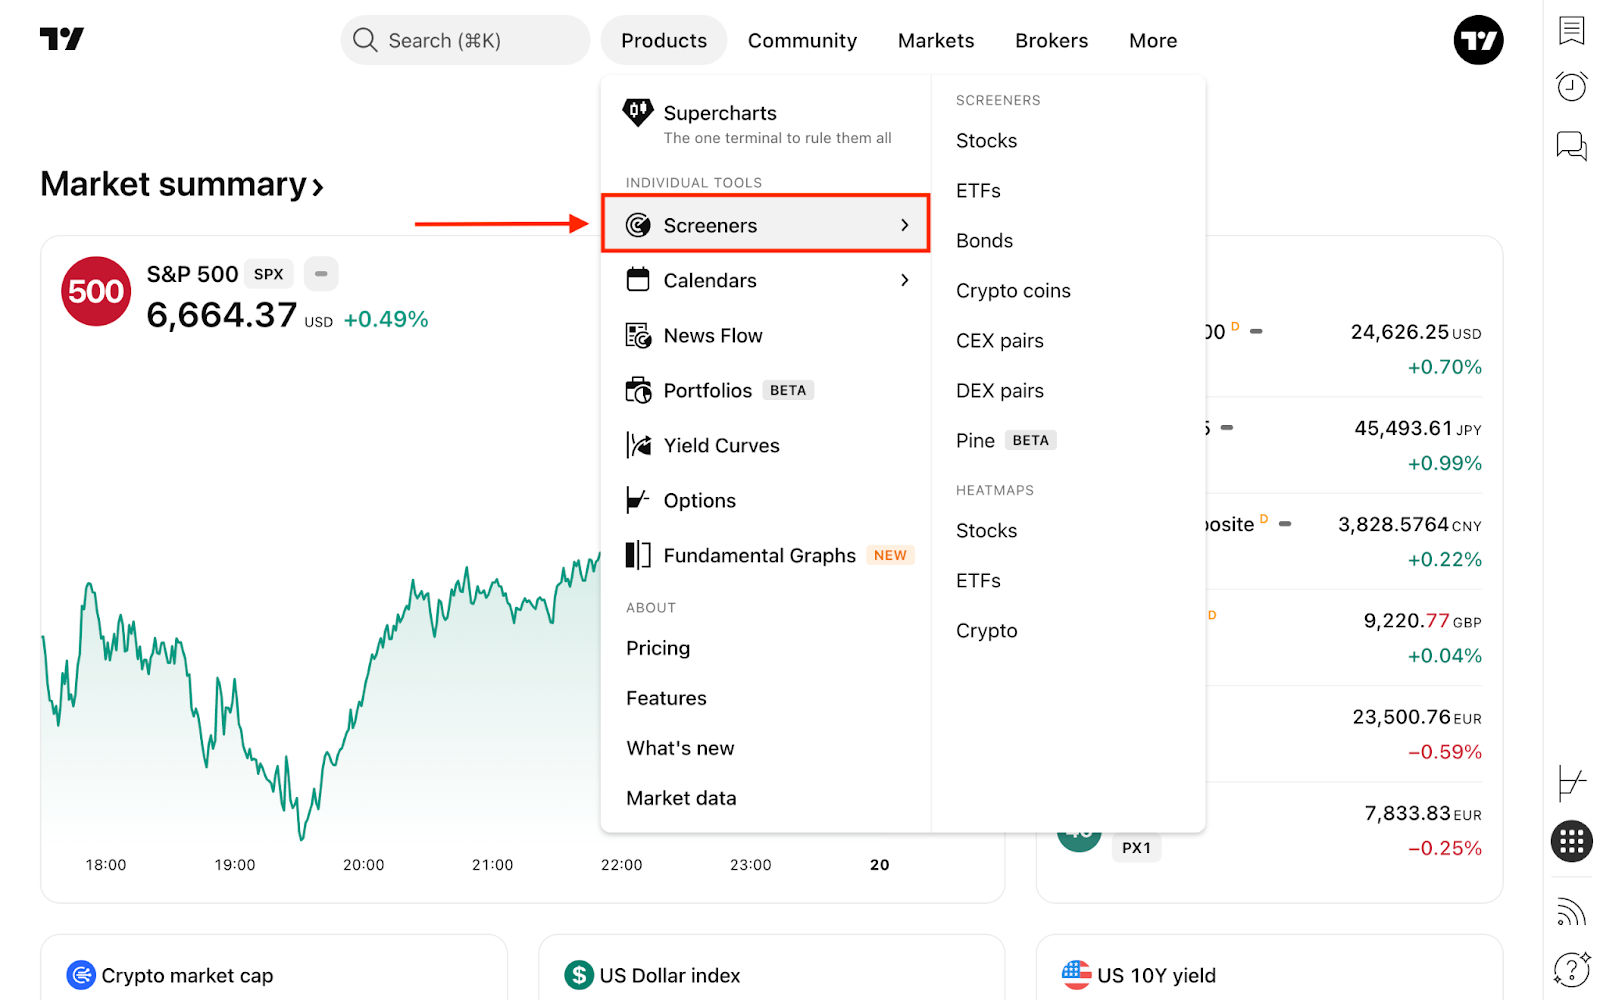
From the main page, click the "Products" dropdown, hover over Screeners, and click "ETFs."
Another way is from Supercharts. On the right toolbar, click "Products" → "Screeners." At the top, click "Stock Screener" and click "ETF Screener."

Regardless of the page you access it from, these are the same screeners with identical functionality — so pick the one you prefer.
How to use the ETF Screener
By default, you'll see the US ETF market sorted by assets under management (AUM), which shows how much money has been invested in the ETF.
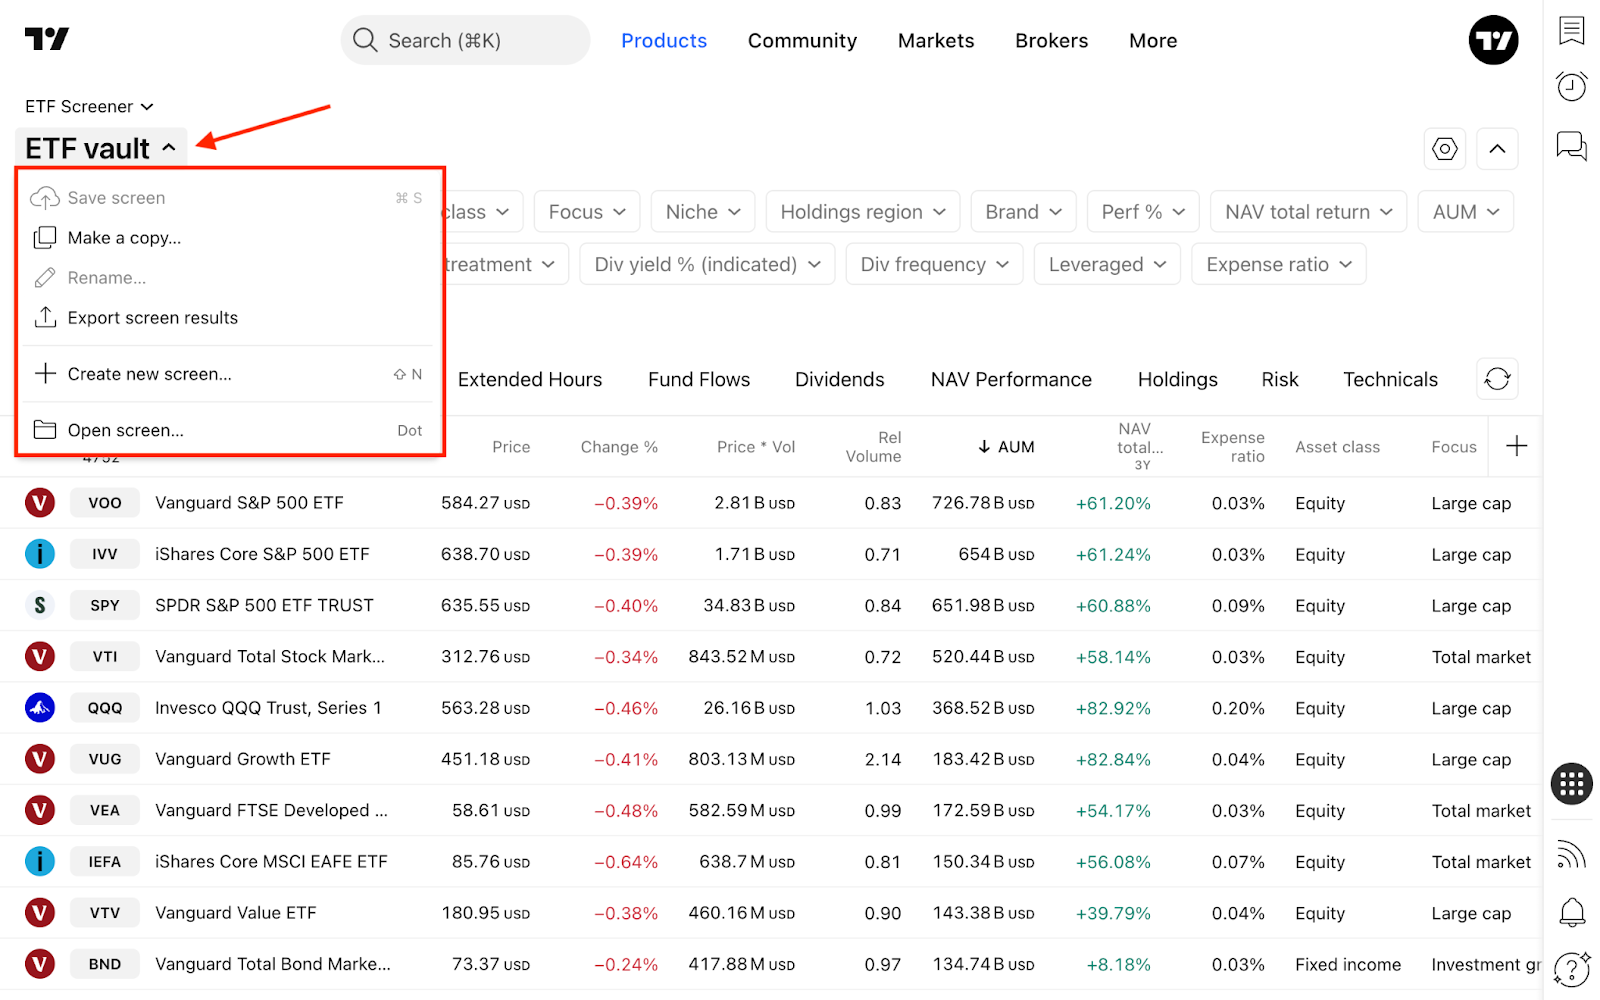
One main feature of the ETF Screener is the ability to create multiple screens and save them for further analysis. You can also use preconfigured sets of filters we've selected to help you discover funds that may interest you. In the top-left corner, click "ETF vault" → "Open screen…".

In the same dropdown, you can access recently used screens, export results as a CSV file, create a new screen, and make other adjustments.
To change the region, click on the currently selected market → "More markets…". In the top-right corner, you can select "Multi-select" to screen two or more regions.
Consider toggling the "Primary listing" option, which displays only ETFs from the main exchange to avoid cluttering your workspace. You may also disable it depending on your analysis.

You can create personalized screens by selecting desired filters, clicking the blue "Save" button, and naming your screen.

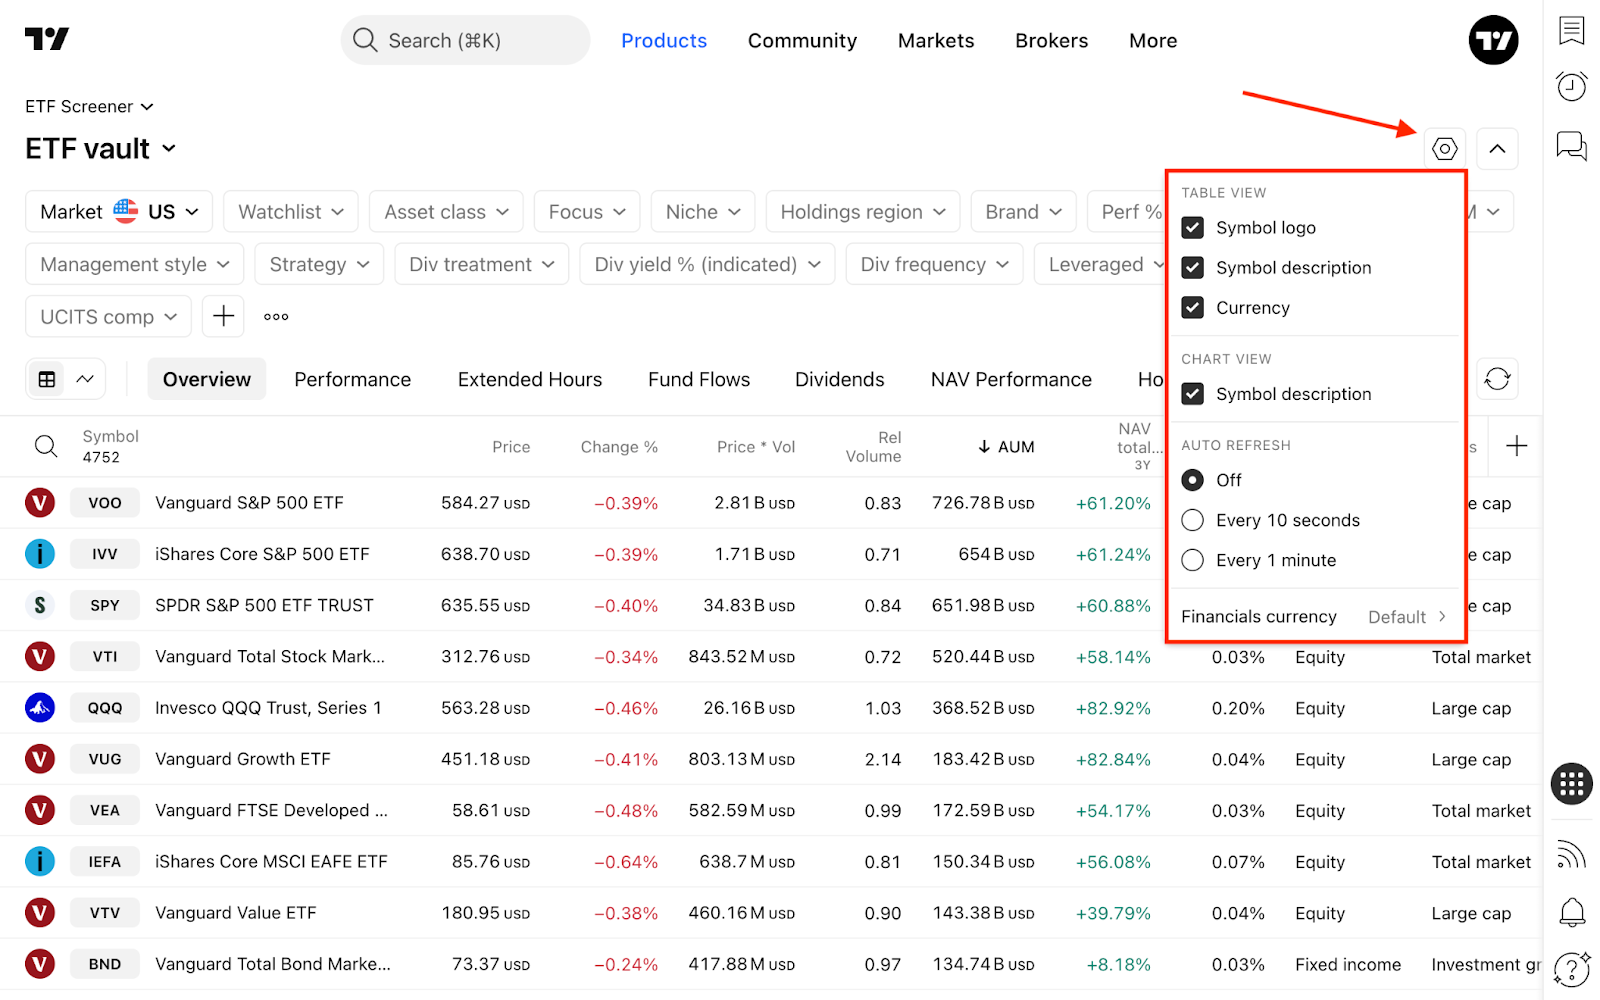
On the right, you'll find Screener settings, where you can choose what to display — symbol logo, description, type, and currency — and how often to refresh. Also, choose the currency for financial metrics such as market cap or diluted EPS — USD, EUR, JPY, GBP, and others.
Next to it is the "Hide filters" button — when you've configured your screener, hide the upper part to see and analyze more funds.
Filters
The ETF Screener offers numerous metrics that can be applied as filters and added to the table. In the filter editing dialog, select the filtering condition.
To add new filter conditions, click the "+" button or press Shift + F.
- Security info: General information such as exchange, issuer, tax form, strategy, and other
- Market data: Access metrics about regular or extended hours trading activity
- Technicals: Select technical indicators to add them as a filtering parameter
- Analysis: Here, choose from key fund features and fund metrics
- Dividends: Add frequency, treatment, yield, or annual dividend filters
For some technical indicators including RSI, Stoch RSI, Momentum, EMA, SMA, Keltner Channels, you can access an expanded set of parameters.

Column sets
Below the filters, you can find column sets, each containing the information for a specific type of analysis. You can always add a new column set using the "+" button on the right.
Default column set configuration:
- Overview: Key ETF metrics — price, price×volume, AUM, asset class, and other critical information
- Performance: Historical view of ETFs' profitability or losses
- Extended hours: Pre- and post-market price, change, gaps, and volume
- Fund flows: Money ETFs attracted over time
- Dividends: Dividend yield, frequency, and treatment
- NAV performance: Percentage change in funds' net asset value
- Holdings: Region, management style, index, and leverage
- Risk: Beta and volatility of funds
- Technicals: Key indicator overview — allows analyzing multiple assets in one table without checking each chart individually
! Important: Do not rely solely on an indicator's technical ratings for financial decisions. They only show what indicators suggest and do not replace your own market analysis.Oh, and one more ETF…
On TradingView, you can access ETFs not only in the Screener but also on the ETFs market page. There, you can get a comprehensive view of recent trade ideas, community trends, ETF news, and other relevant information to complement your financial analysis.
Also read: