Начало работы с Суперграфиками
Суперграфики — сердце TradingView. С ними вы можете отслеживать изменение цены, изучать индикаторы, использовать инструменты рисования и исследовать другие продукты, такие как скринеры и Лента новостей, чтобы проводить полноценный финансовый анализ. Это ваше персонализированное пространство, в котором вы также можете практиковать торговлю и совершать реальные сделки через наших проверенных брокеров.
Верхняя панель инструментов
Здесь вы можете настроить ваш график, выбрав инструмент, интервал и тип графика, а также индикаторы, расположение графиков и др.

Поиск инструментов
Позволяет выбрать инструмент для отображения на графике. Есть два способа открыть окно поиска:
- Нажмите на кнопку с иконкой лупы.
- Просто начните вводить название инструмента. Например, чтобы открыть график акций Apple, наберите “AAPL”.

Сравнение и добавление инструментов
Эта кнопка позволяет вам выбрать дополнительный инструмент для отображения на графике помимо текущего. Так вы можете сравнивать активы на одном графике для более подробного анализа.

Интервал графика
Каждый интервал графика представляет «шаг» во времени для цены — он может составлять от одной секунды до нескольких месяцев. У разных типов графика свой подход к визуализации данных — он и определяет, как будут представлены интервалы: в виде баров, свечей и т.д.
Например, на линейном графике линия формируется путём соединения цен внутри выбранного интервала. А на графиках баров и свечей каждый бар/свеча будет отображать значение цены за выбранный период.

Тип графика
Здесь вы можете выбрать из 20+ типов графиков, каждый из которых можно настроить под ваш стиль анализа. Выбирайте любой — от классических баров и свечей до более продвинутых опций, как графики Ренко. Читайте подробнее о разных типах графиков в нашей базе знаний.

Индикаторы, показатели и стратегии
Мощные инструменты в этом меню могут помочь улучшить вашу торговлю — они предоставляют ключевую информацию, чтобы вам было проще ориентироваться на рынке.
- Индикаторы. Функции, используемые в техническом анализе для прогноза будущих цен на основании их движения и торгового объёма активов.
- Фундаментальные показатели. Финансовые данные для проведения фундаментального анализа, полученные из отчётов компании.
- Стратегии. Специальные скрипты, написанные на языке Pine Script®. Они могут отправлять, изменять, выполнять и отменять заявки на покупку и продажу и симулировать реальную торговлю прямо на вашем графике.
Сохраните любой из них в избранное, нажав на иконку звезды, для быстрого доступа.

С шаблонами индикаторов вы можете сохранить выбранные индикаторы для использования в будущем. При сохранении вы также можете сохранить инструмент и интервал, чтобы загрузить их одновременно с шаблоном. Нажмите Открыть шаблон, чтобы увидеть окно шаблонов индикаторов и управлять ими.

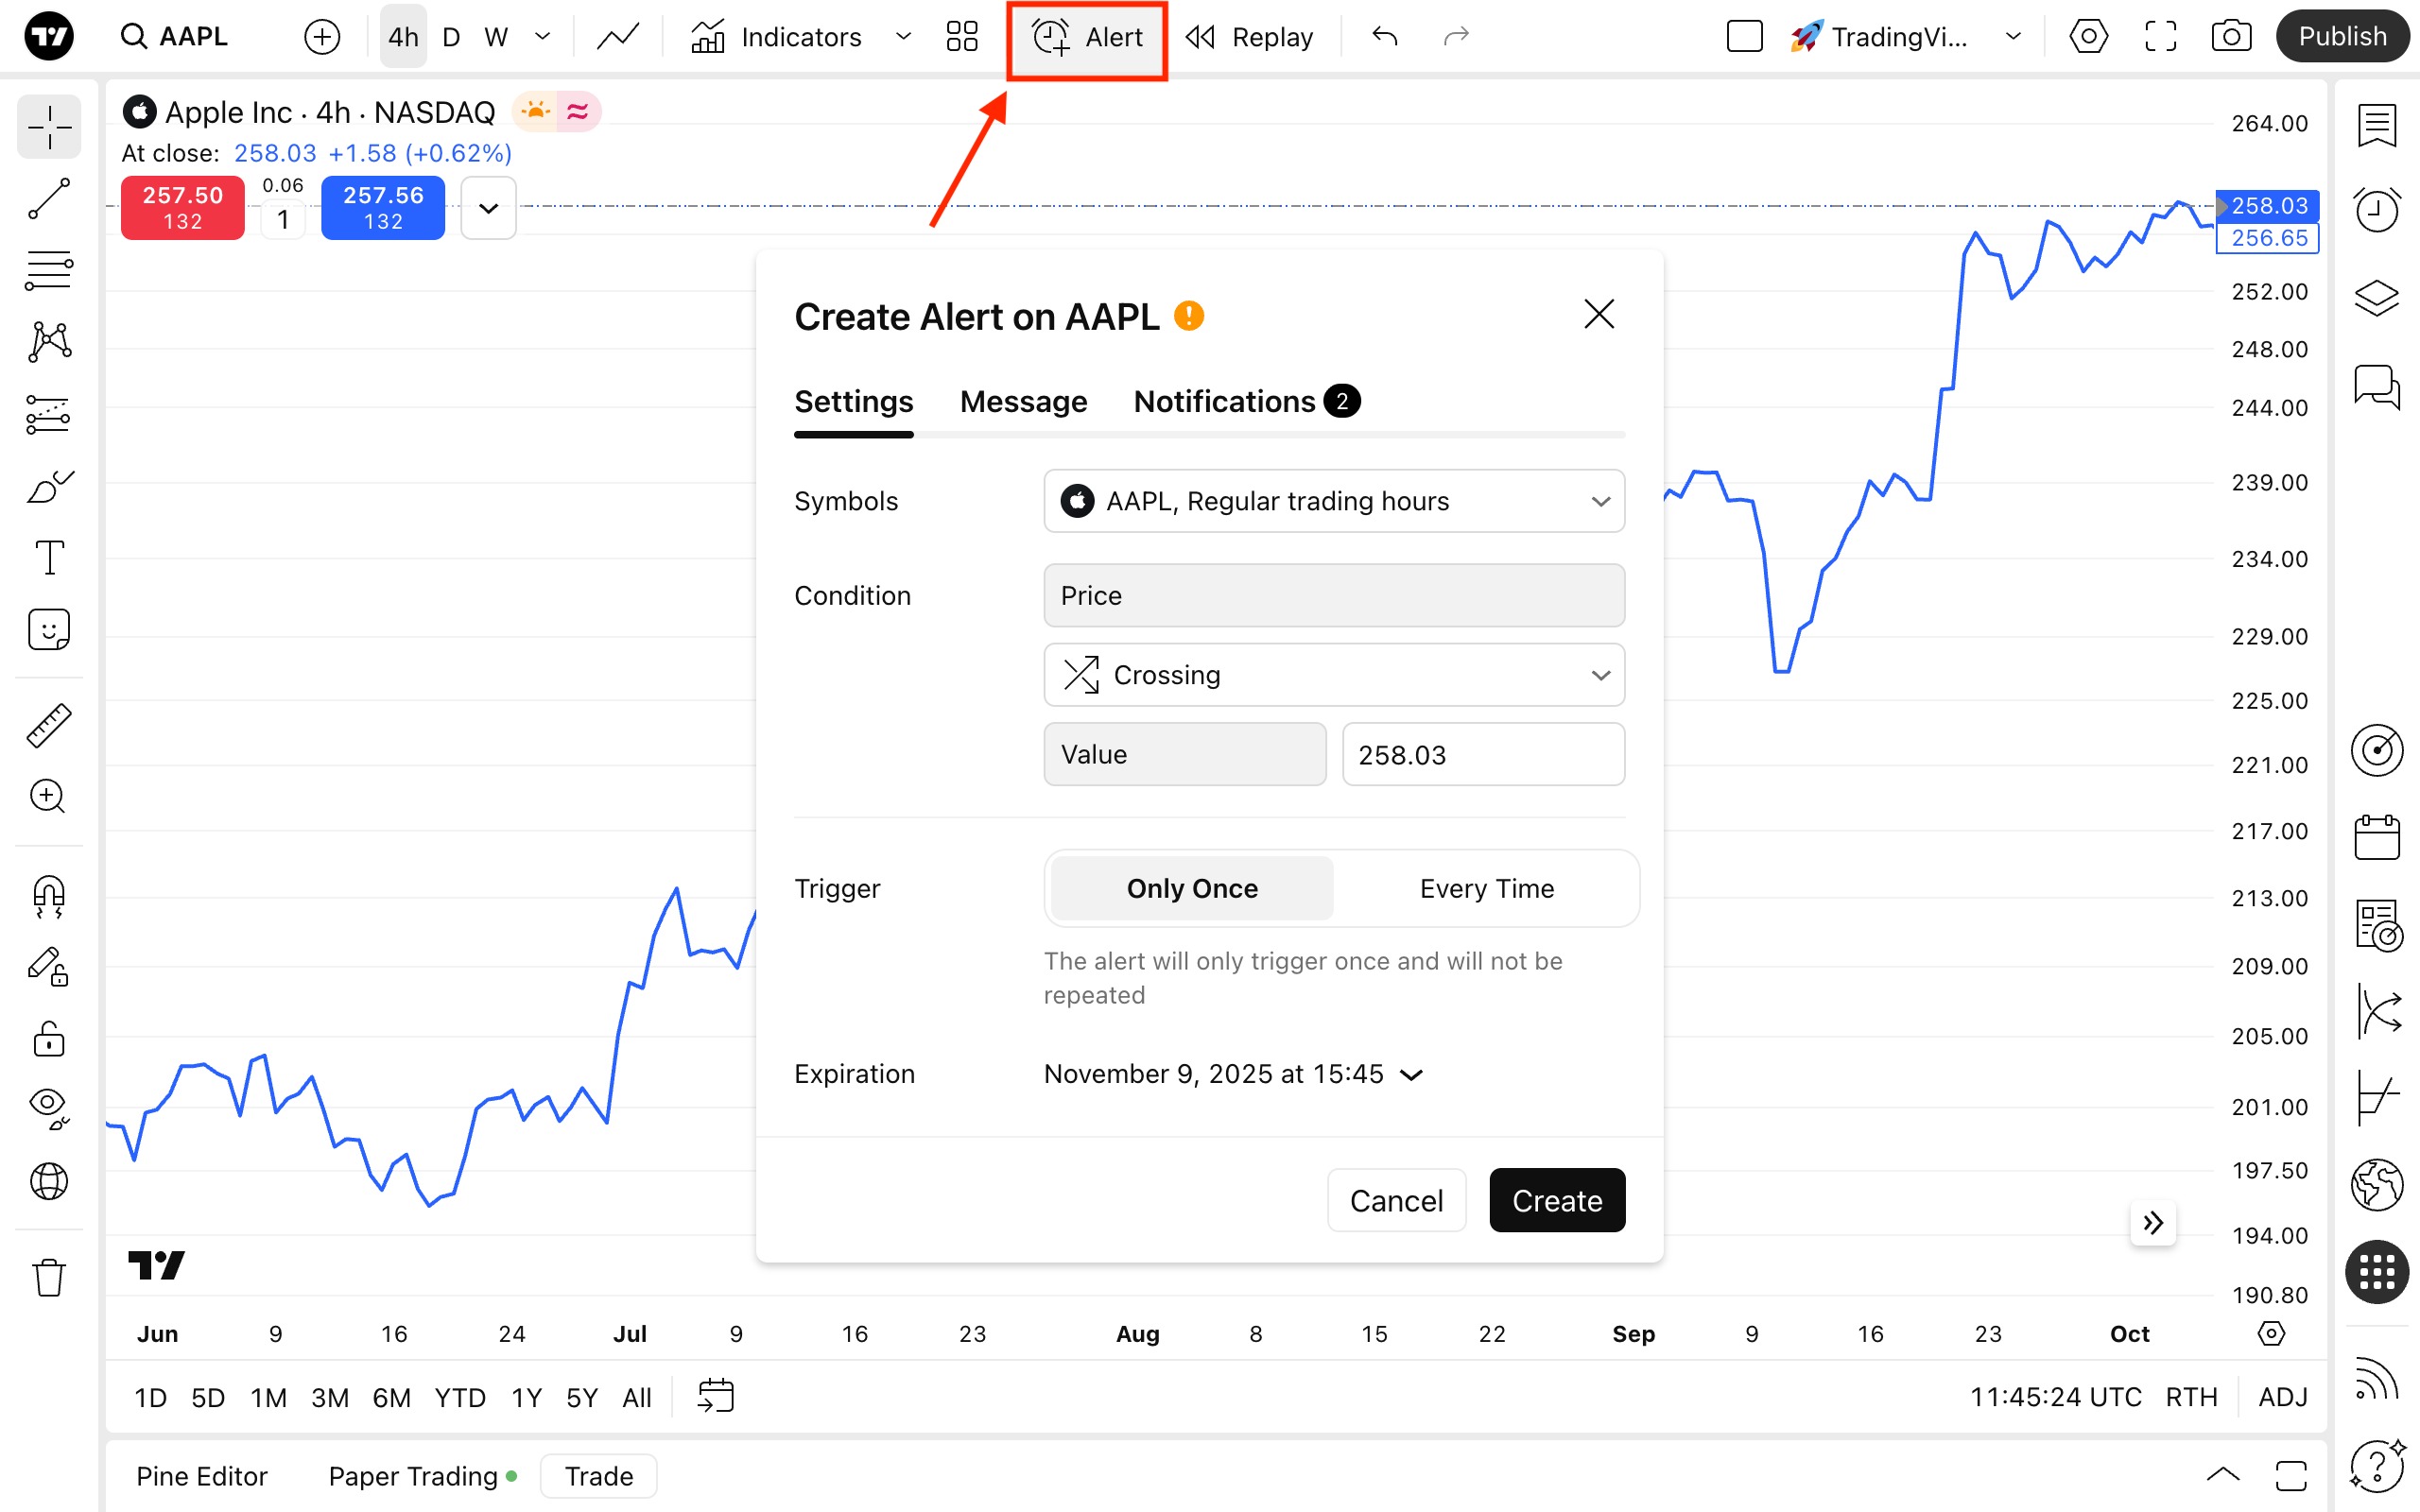
Оповещения
Эта функция позволяет вам настраивать оповещения и контролировать уведомления об их срабатывании. С этими важными инструментами вы всегда сможете следить за ценами, индикаторами, стратегиями или объектами рисования. Вы можете выбрать условие, при котором сработает оповещение, и истечение срока, а также указать сообщение для этого оповещения и многое другое.
Симулятор рынка
Симулятор рынка позволяет пользователям воспроизводить движения цены в прошлом, чтобы протестировать стратегию. Вы можете вернуться назад во времени, чтобы анализировать поведение исторического рынка, практиковать принятие торговых решений и тестировать стратегии без реального финансового риска.
Все изменения на графике можно контролировать с помощью кнопок Отменить и Повторить.
Расположение графиков
В меню расположения графиков вы можете выбрать число графиков и их размещение. По сути, расположение — это отдельное сохраненное рабочее пространство. Каждый график при этом имеет свои собственные параметры и может быть настроен отдельно, но вы также можете выбрать синхронизировать графики в пространстве.

Стрелка рядом с названием рабочего пространства открывает выпадающее меню, где вы можете управлять расположением графиков. Не забывайте сохранять ваши изменения, чтобы не потерять свой прогресс. Здесь вы также можете переименовать ваш график, поделиться им и скопировать, выгрузить данные, создать новое рабочее пространство или открыть одно из сохранённых ранее.
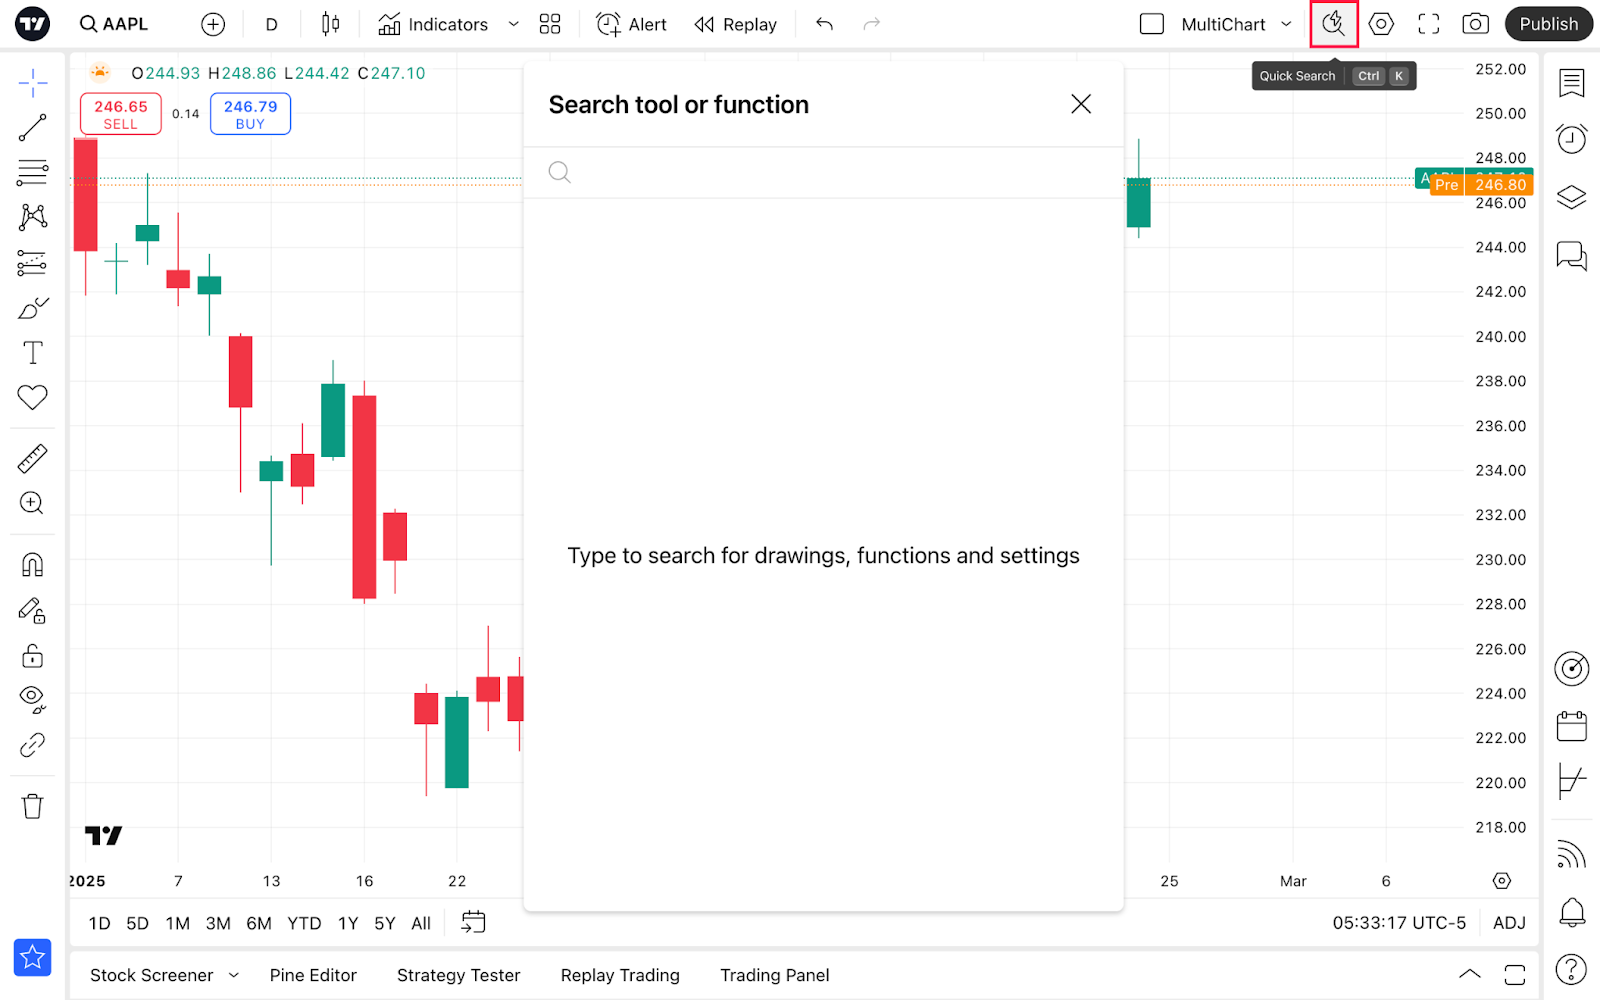
Быстрый поиск
Чтобы вам было проще ориентироваться на графике, вы можете воспользоваться быстрым поиском. Это самый простой способ найти нужные инструменты, функции, объекты рисования или настройки.
Настройки
Вы можете настроить график так, как захотите. Чтобы начать, нажмите на кнопку Настройки в правом верхнем углу или кликните дважды по линии цены/бару/свече.

В меню настроек вы можете менять следующее:
- Инструмент. Настройте параметры для типа графика — каждый ведёт себя по-разному и для каждого здесь есть уникальные настройки.
- Строка статуса. Выберите, какие значения отображать рядом с названием инструмента вверху графика.
- Шкалы и линии. Выбирайте отображение линий и шкал, их цвета, а также форматы даты и времени.
- Оформление. Меняйте стиль фона графика, размер текста, отображение кнопок и полей.
- Торговля. Включайте/отключайте отображение кнопок покупки и продажи, активируйте уведомления и настраивайте оформление.
- Оповещения. Управляйте их видимостью и громкостью.
- События. Отображайте или скрывайте идеи, экономические события или новости прямо на графике
После настройки графика вы можете открыть его в полноэкранном режиме. Для этого есть специальная кнопка рядом с настройками графика — она позволяет анализировать его без лишнего шума.
Снимок экрана
Эта кнопка позволяет вам сделать снимок текущего графика. Скачивайте его, сохраняйте и публикуйте — используйте каждую возможность поделиться идеями и получить реакцию на них.
Публикация
Мы уверены, что торговля должна быть социальной. Благодаря кнопке Опубликовать вы можете делиться своими идеями — постами с анализом рынка, которые формируют сообщество TradingView. Узнайте, как стать лучшим автором, постоянно создавая и публикуя качественные идеи.
Левая панель инструментов
Здесь вы можете использовать инструменты рисования, чтобы создавать заметки, добавлять комментарии, отмечать тренды и паттерны, выполнять измерения, строить прогнозы и рассчитывать уровни цен.

На этой панели представлено множество полезных инструментов:
- Курсоры. Выбирайте тип курсора, который поможет вам лучше ориентироваться на графике.
- Линии тренда. Используйте линии, каналы или вилы, чтобы отмечать направление движения и уровни цен.
- Инструменты Ганна и Фибоначчи. Автоматически стройте уровни на основании формул Фибоначчи и теории Ганна. Настраивайте число уровней и коэффициенты, как вам удобно.
- Паттерны. Используйте волны Эллиотта, чтобы отмечать максимумы, минимумы, расстояние между ними и определять рыночные циклы.
- Инструменты для измерения и прогнозирования. Измеряйте расстояния на графике, прогнозируйте движение цены и оценивайте торговые позиции.
- Геометрические фигуры. Используйте кисти, стрелки и другие классические фигуры.
- Инструменты комментирования. Добавляйте текстовые заметки сразу на график, делая технический анализ более наглядным.
- Иконки. Добавляйте эмодзи и стикеры. Переключайтесь между группами, используя вкладки внизу меню.
- Линейка. Оценивайте расстояние между барами графика.
- Увеличить масштаб. Рассмотрите ближе выбранную область.
- Магниты. Привязывайте рисунки к ближайшим максимальным и минимальным ценам, а также к ценам открытия и закрытия.
- Продолжить в режиме рисования. Последовательно добавляйте различные объекты на график.
- Зафиксировать все объекты. Чтобы ваши объекты рисования не смещались случайно.
- Скрыть параметры. Скройте рисунки, индикаторы, позиции или заявки — или всё сразу.
- Синхронизировать параметры объектов рисования. Все дополнительные рабочие пространства будут повторять объекты рисования с основного.
- Удалить параметры. Удалить объекты рисования, индикаторы или и то, и другое одновременно.
Правая панель инструментов
На ней доступны список котировок, новости, оповещения и другие наши продукты в выезжающей боковой панели.
Эта панель позволяет вам отслеживать инструменты в списке котировок, создавать и редактировать оповещения, эффективно использовать скринеры и календари и многое другое.

Среди доступных инструментов:
- Котировки, информация и новости. Легко отслеживайте инструменты, проверяйте их финансовые и технические показатели, и будьте в курсе последних новостей. Создавайте или импортируйте новые списки, просматривайте текущие и управляйте ими. Вы также можете настроить оповещения специально для списка котировок.
- Оповещения. Управляйте вашими оповещениями на цены, индикаторы и стратегии.
- Дерево объектов и окно данных. Управляйте объектаи рисования и индикаторы, размещенные на графике.
- Скринер. Открывайте и переключайтесь между скринерами TradingView, чтобы исследовать рынки, не покидая график.
- Календари: Следите за наиболее важными экономическими событиями и активностью компаний.
- Опционы. Финансовые инструменты как для спекулятивной торговли, так и для хеджирования.
- Сообщество. Здесь вы найдёте свои посты, выбор редакции и популярные сейчас.
- Уведомления. Проверяйте ваши комментарии, упоминания и другие действия в социальной сети TradingView.
- Чат-ассистент. Предоставляет информацию о продуктах TradingView, графиках, индикаторах и подписках. Если вам требуется помощь, пока вы анализируете график, вы можете оттуда же обратиться к базе знаний.
Нижняя панель инструментов
На этой панели вы можете переключаться между интервалами, устанавливать часовой пояс и настраивать шкалу цены.
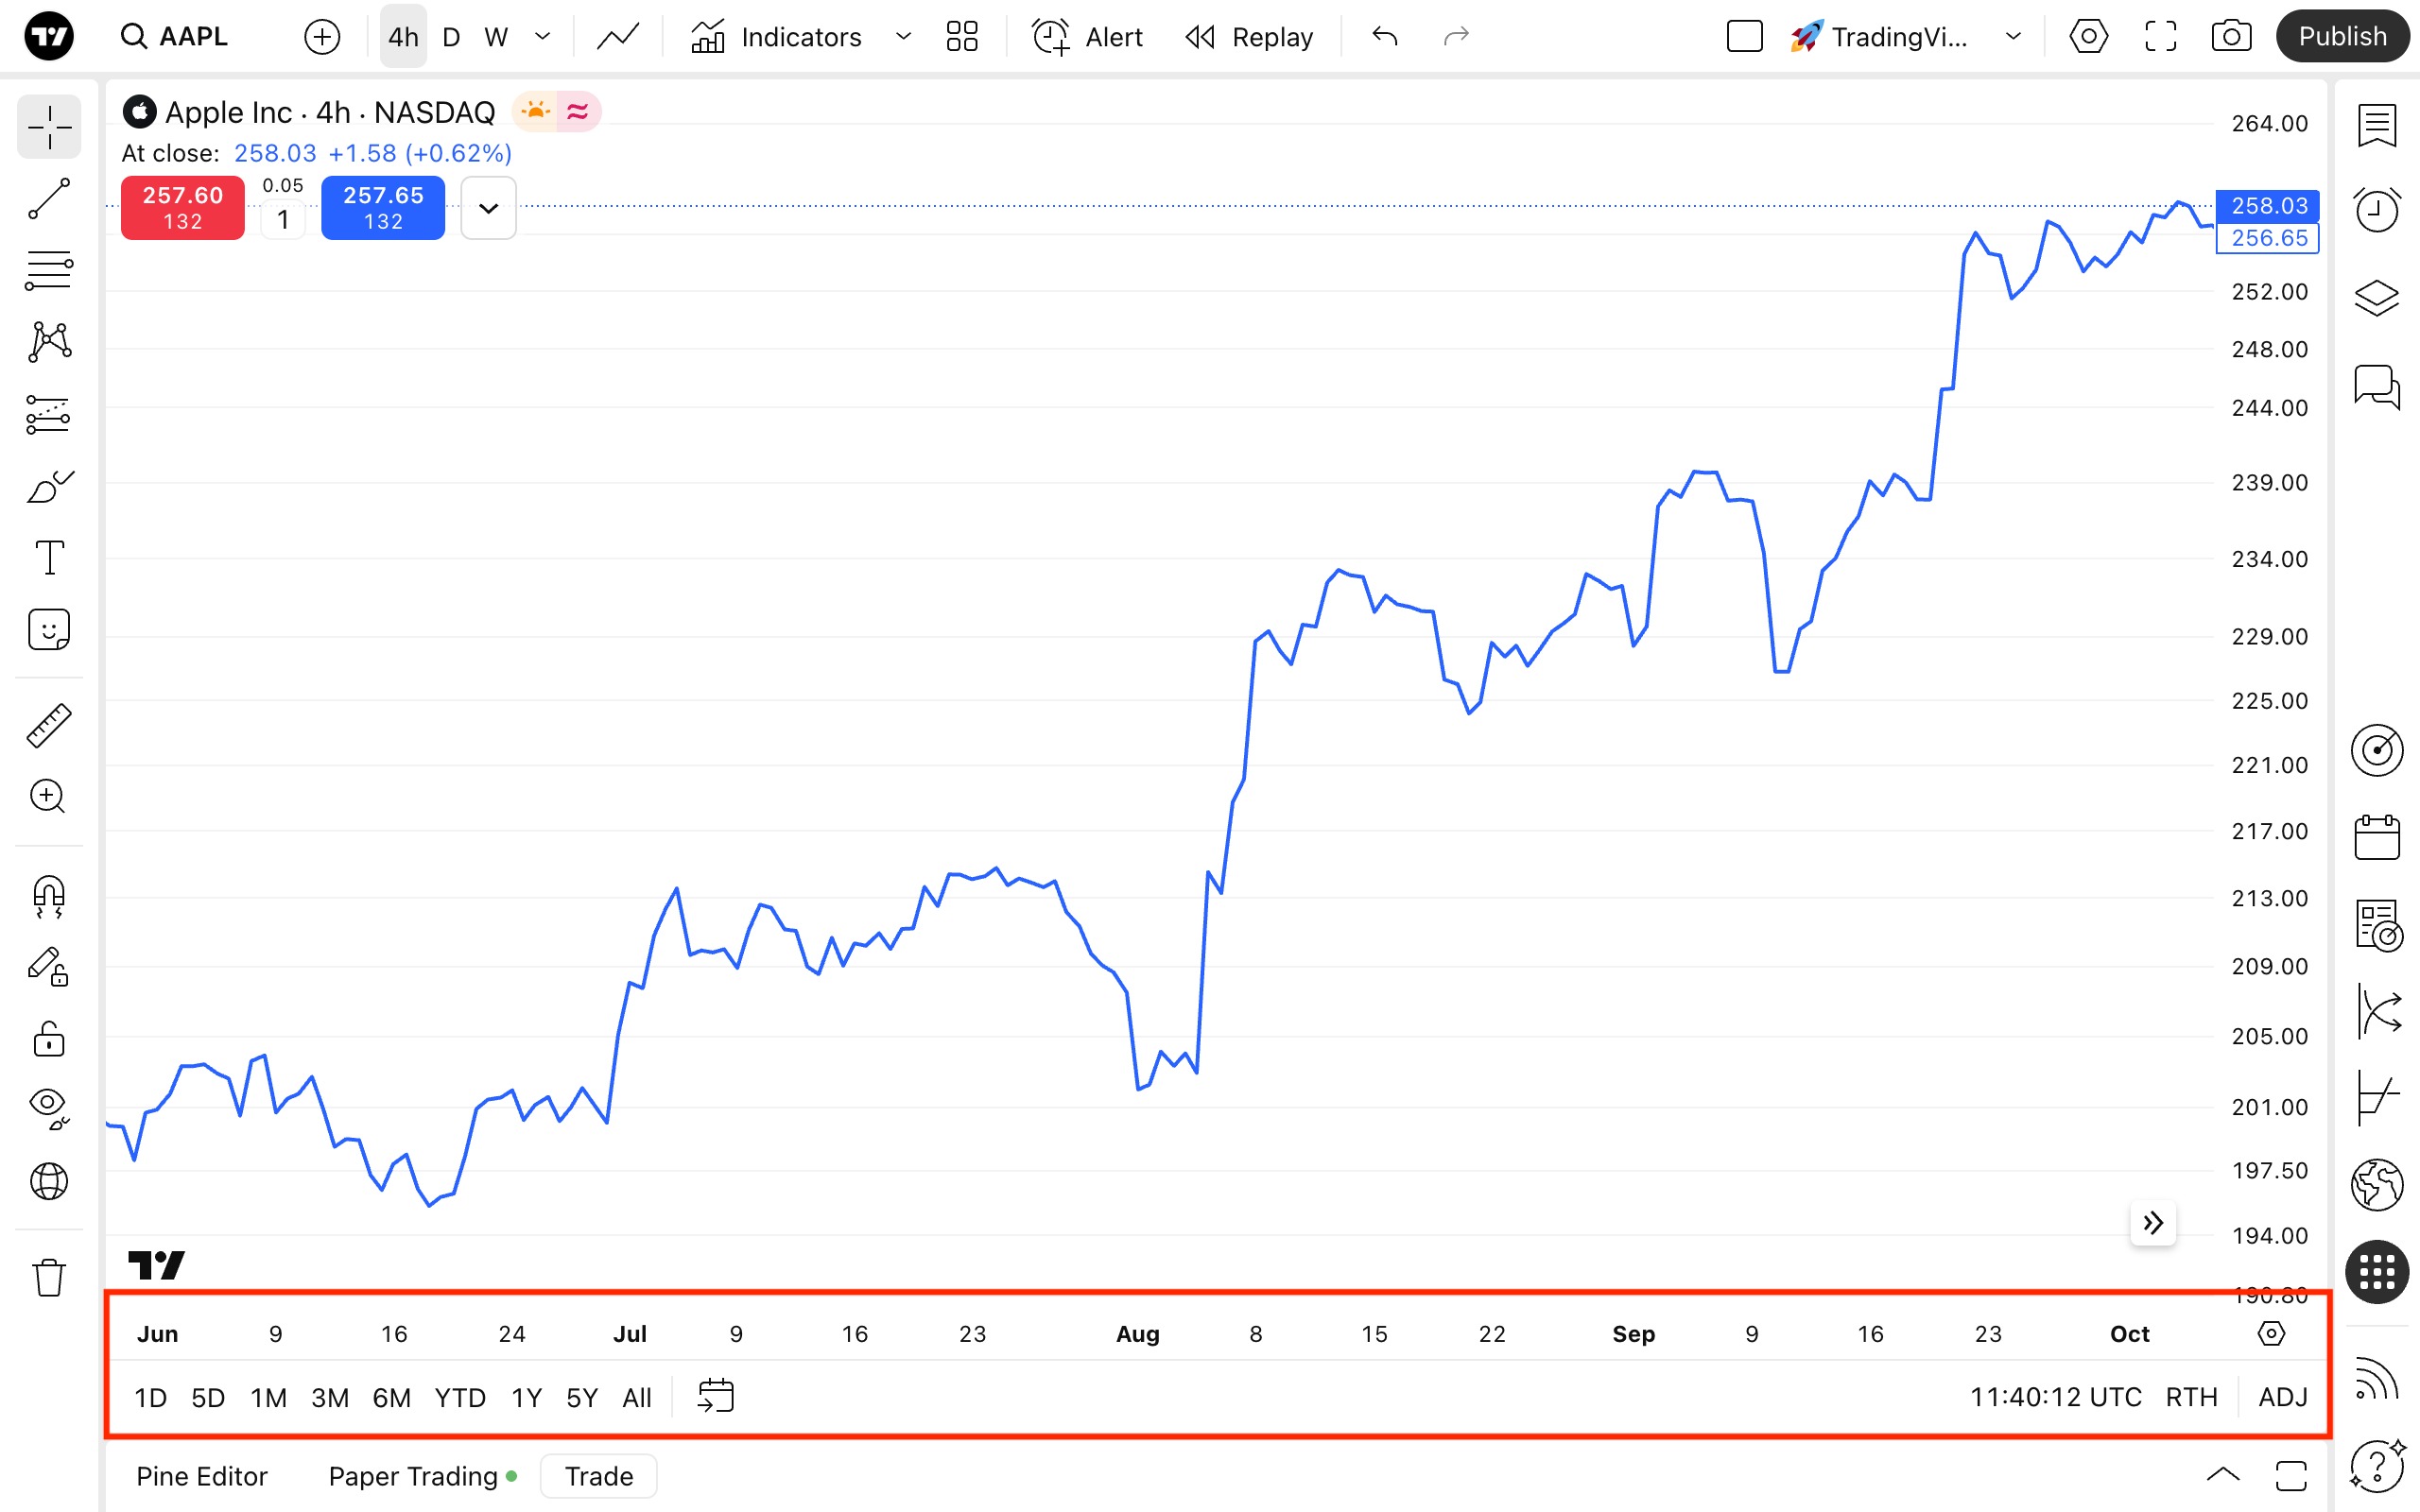
Под временной шкалой вы можете найти предзаданные интервалы под ваш экран. При выборе 1Д, например, график будет отображать один торговый день интервалами в одну минуту. Нажав на Все, вы отобразите все доступные исторические данные, представленные месячными интервалами. Если ни один из этих интервалов не подходит вам, вы можете перейти к конкретной дате или задать собственный, используя меню Перейти к дате.

В настройках часового пояса вы можете выбрать, какое время отображать на графике. Выберите «Биржа», чтобы настроить время под соответствующую торговую биржу.
Рядом с настройками часового пояса вам также будет доступна иконка шестерёнок. Она открывает настройки ценовой шкалы, где вы можете выбрать её режим, метки для отображения и многое другое.

В всплывающей панели ниже будут доступны:
- Редактор Pine, который позволяет создавать уникальные индикаторы и стратегии на Pine Script, мгновенно добавлять их на график, управлять и делиться ими с другими трейдерами.
- Торговая панель, где вы можете подключиться к вашему любимому брокеру, чтобы торговать напрямую с графика.
Суперграфики TradingView дают вам доступ к техническим и финансовым данным, идеям сообщества и информации о ключевых экономических событиях. Также они позволяют торговать через вашего брокера.