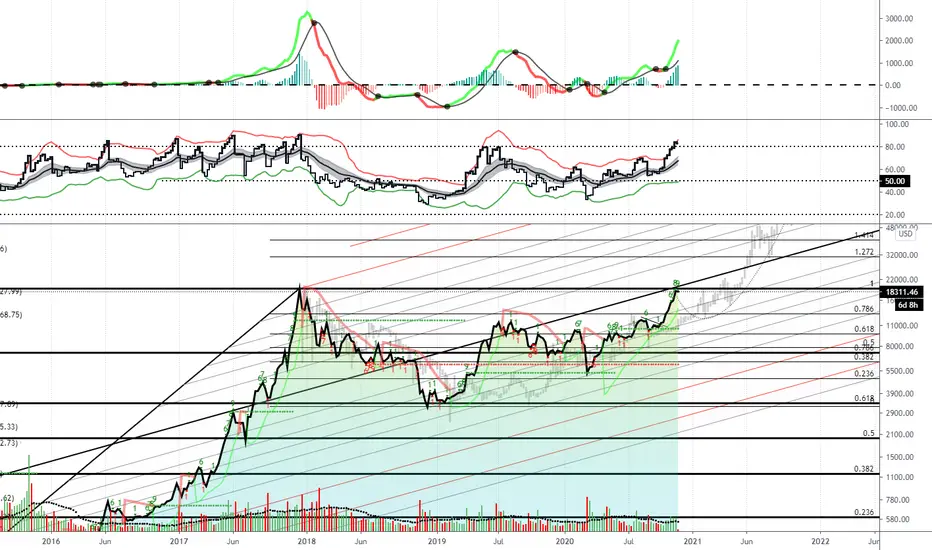
As BTC tests 20K levels, we are looking for this previous ath to come in as hard resistance initially. The TD indicator flashing a green 9 on the weekly time frame, suggesting the end of the bullish weekly count. RSI is over 80% buyers, stretching out the 2 st. deviations on this indicator - suggesting overbought. Ghost bars from 2015-2017 market cycle layered on top of this chart (grey bars) shows the last battle BTC saw as it approached the ath. Looking for this to repeat. I hope you are ready to buy this dip!
Похожие публикации
Отказ от ответственности
Информация и публикации не предназначены для предоставления и не являются финансовыми, инвестиционными, торговыми или другими видами советов или рекомендаций, предоставленных или одобренных TradingView. Подробнее читайте в Условиях использования.
Отказ от ответственности
Информация и публикации не предназначены для предоставления и не являются финансовыми, инвестиционными, торговыми или другими видами советов или рекомендаций, предоставленных или одобренных TradingView. Подробнее читайте в Условиях использования.