An Examination of DOGEBTC Price Cycles, Pt. 1
About a year ago, I told a friend that I'd discovered a cycle in the peaks of DOGEBTC. He agreed and later sent me a chart that had a similar interpretation as one I came across a few days ago by InvestingScope:
 I never looked at the cycles on a one week resolution so it was really neat to see our observation (the existence of a cycle) confirmed by someone else in a different way. Dunno how far down the rabbit hole I'll go with this but, here's a bit of my interpretation of the DOGEBTC cycle. Since charts are cool, I'll start there....
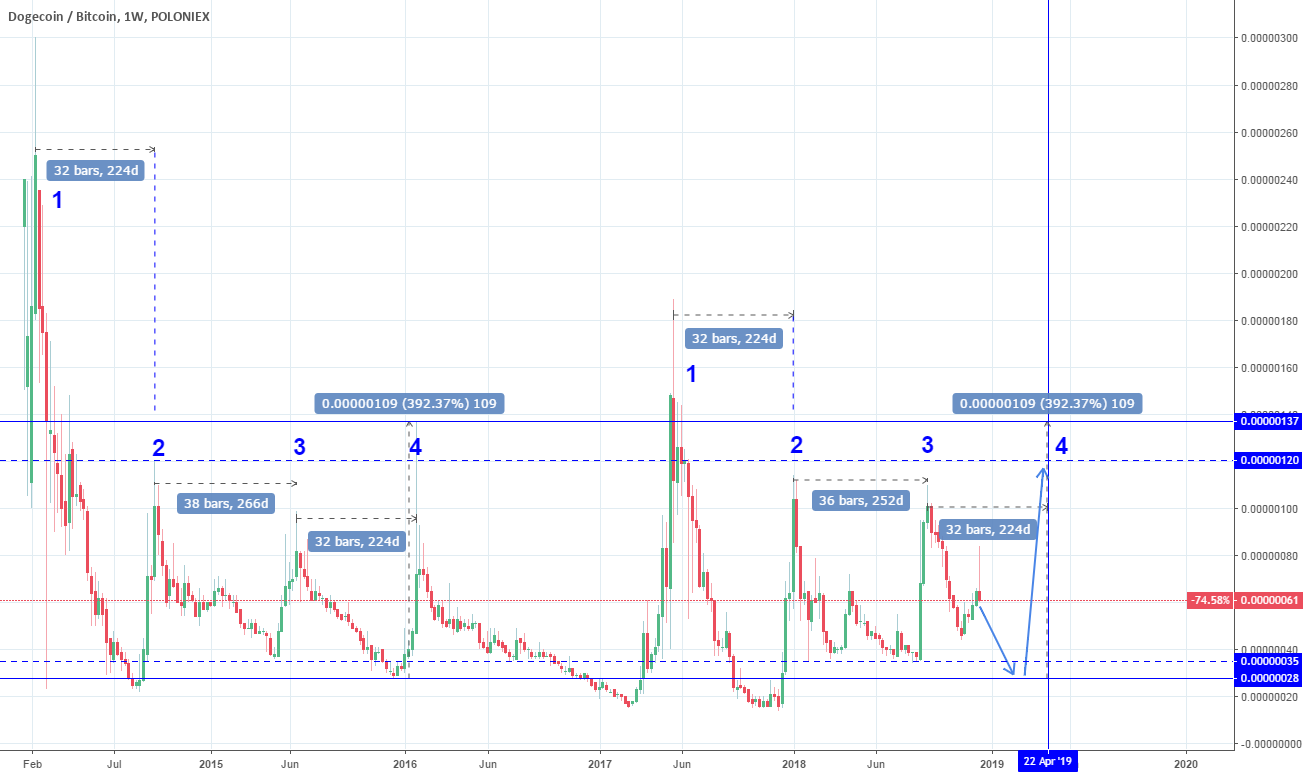
The first point of difference I have with the InvestingScope chart is the identification of a first peak. InvestingScope (and my friend) used Feb 10, 2014 @ 300 while I use Sep 7, 2014 @ 120 instead. My reason for rejecting the high on 2/10/2014 is simple: It doesn't fit my theory. Just kidding. Actually, I don't count it as the first for a number of reasons. I may discuss them in a future update or the comments section below, but for now, they are a distraction primarily because I end up with the same result either way. This might not be true for everyone else's theory though.
I never looked at the cycles on a one week resolution so it was really neat to see our observation (the existence of a cycle) confirmed by someone else in a different way. Dunno how far down the rabbit hole I'll go with this but, here's a bit of my interpretation of the DOGEBTC cycle. Since charts are cool, I'll start there....
The first point of difference I have with the InvestingScope chart is the identification of a first peak. InvestingScope (and my friend) used Feb 10, 2014 @ 300 while I use Sep 7, 2014 @ 120 instead. My reason for rejecting the high on 2/10/2014 is simple: It doesn't fit my theory. Just kidding. Actually, I don't count it as the first for a number of reasons. I may discuss them in a future update or the comments section below, but for now, they are a distraction primarily because I end up with the same result either way. This might not be true for everyone else's theory though.
From peaks A to C there are 488 bars and peak B is roughly half way between the two. From E to G there are 476 bars, and peak F is roughly half way between the two. From peak C to peak E there are 480 bars, however there is not a corresponding peak D roughly halfway between the two. Because of this gap, it's easy to draw the same conclusion both InvestingScope and my friend did: that there is a recurring cycle of four peaks. However... before I get to that, there are a couple things I want to point out. Peak E seems to mark the point where DOGE transitioned from a downward slope to an upward one. And with the upward trend a new set of peaks (e,f,g) emerged. Peak (e) is roughly halfway between E and F, and peak (f) is roughly halfway between F and G:
And while peaks E, F, G progressively get smaller, peaks (e), (f), and (g) grow progressively higher with an average time of 101 bars after the larger peaks E, F, and G.
That's a clue if I ever saw one, so.... I looked to see if there were corresponding peaks (a), (b), and (c) about 101 bars after A, B, and C. Since DOGEBTC was trending down during this time, I would expect peaks (a), (b), and (c) to be flattened and harder to recognize.
It wasn't too hard to find good candidates for (a) and (b) but (c) creates a dilemma. The 101 block is deserted and the best visual candidate is only 62 bars away. Forty bars is too much of a variation to be accepted without a good explanation as to why it was shortened by 40%. And the alternative, that the pattern dies during the 480 bars from C to E, needs just as much of an explanation.
Of course I have one. You've just got to wait until I make another cup of coffee. Take a gander at these while you wait:
From peaks A to C there are 488 bars and peak B is roughly half way between the two. From E to G there are 476 bars, and peak F is roughly half way between the two. From peak C to peak E there are 480 bars, however there is not a corresponding peak D roughly halfway between the two. Because of this gap, it's easy to draw the same conclusion both InvestingScope and my friend did: that there is a recurring cycle of four peaks. However... before I get to that, there are a couple things I want to point out. Peak E seems to mark the point where DOGE transitioned from a downward slope to an upward one. And with the upward trend a new set of peaks (e,f,g) emerged. Peak (e) is roughly halfway between E and F, and peak (f) is roughly halfway between F and G:
And while peaks E, F, G progressively get smaller, peaks (e), (f), and (g) grow progressively higher with an average time of 101 bars after the larger peaks E, F, and G.
That's a clue if I ever saw one, so.... I looked to see if there were corresponding peaks (a), (b), and (c) about 101 bars after A, B, and C. Since DOGEBTC was trending down during this time, I would expect peaks (a), (b), and (c) to be flattened and harder to recognize.
Of course I have one. You've just got to wait until I make another cup of coffee. Take a gander at these while you wait: