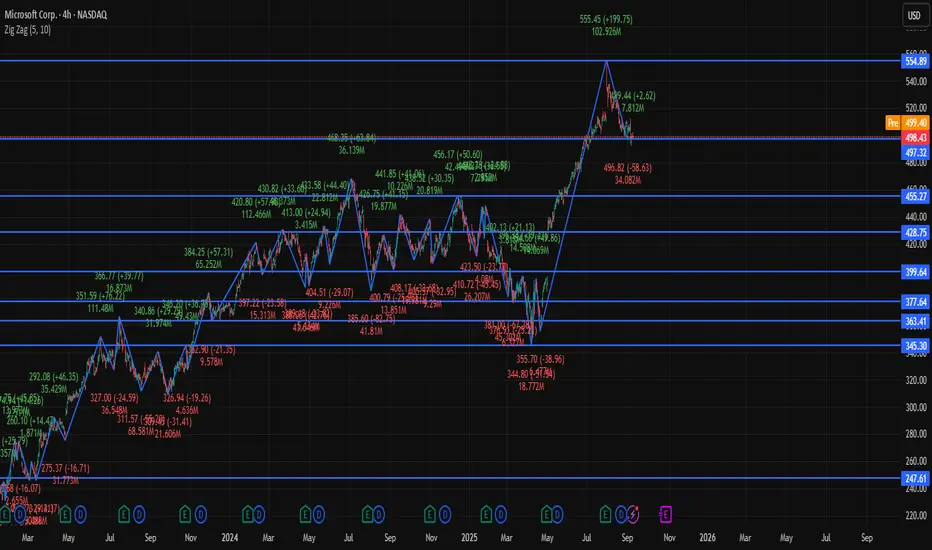
MSFT Snapshot (as of latest session)
Current Price: Around $498.40
Day Range: $497.0 – $502.2
Open: ~$501.4
Market Cap: ~$2.79 Trillion
P/E Ratio: ~28.9
EPS: ~12.93
Pivot Levels (Daily basis, useful for 4-Hour analysis)
Pivot Point: ~$498.9
Resistance Levels:
R1: ~$499.5
R2: ~$500.0
R3: ~$500.6
Support Levels:
S1: ~$498.4
S2: ~$497.8
S3: ~$497.3
Technical View (4-Hour Frame)
Momentum: Price is consolidating near the pivot (~$498–499).
Indicators:
RSI around 45 → neutral to slightly bearish.
MACD negative → bearish bias.
Moving Averages (short and long) → leaning bearish.
Bias:
A breakout above $500 may open short-term upside toward ~$500.6 or higher.
If MSFT falls below $498, pullback risk increases toward $497.8 → $497.3.
✅ Conclusion: On the 4-hour timeframe, MSFT is in a neutral-to-bearish phase, stuck around its pivot. Buyers need a clear move above $500 to regain strength; otherwise, it risks drifting lower toward support.
Отказ от ответственности
Информация и публикации не предназначены для предоставления и не являются финансовыми, инвестиционными, торговыми или другими видами советов или рекомендаций, предоставленных или одобренных TradingView. Подробнее читайте в Условиях использования.
Отказ от ответственности
Информация и публикации не предназначены для предоставления и не являются финансовыми, инвестиционными, торговыми или другими видами советов или рекомендаций, предоставленных или одобренных TradingView. Подробнее читайте в Условиях использования.