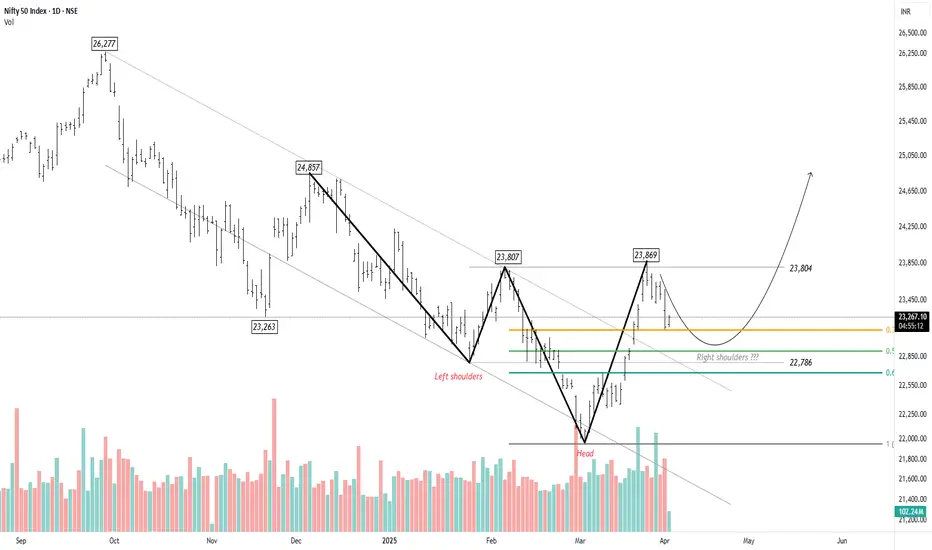
Nifty recently hit a low of 21,905, marking a key reversal point in the trend. A well-defined Head and Shoulders pattern is emerging, with the right shoulder currently forming. The ongoing pullback has retraced to the 38.2% level, but there is potential for it to extend towards the 50% mark at 22,906. However, the upward move appears to be losing momentum, with buying interest remaining subdued.
Based on the chart, the head of the pattern signifies the beginning of a new impulse wave. This appears to be the fourth wave within the larger first wave. Once Nifty completes this corrective phase, the fifth wave is expected to present a trading opportunity. If wave equality holds, Nifty could potentially rise to 24,857.
Based on the chart, the head of the pattern signifies the beginning of a new impulse wave. This appears to be the fourth wave within the larger first wave. Once Nifty completes this corrective phase, the fifth wave is expected to present a trading opportunity. If wave equality holds, Nifty could potentially rise to 24,857.
To eliminate these delays and give priority access to serious traders, we’ve launched an exclusive Premium EDU + Wave Count Group.
💰 Annual Fee: $115
BUY NOW: t.me/moneydictators/148
Lifetime Free - t.me/moneydictators
💰 Annual Fee: $115
BUY NOW: t.me/moneydictators/148
Lifetime Free - t.me/moneydictators
Похожие публикации
Отказ от ответственности
Информация и публикации не предназначены для предоставления и не являются финансовыми, инвестиционными, торговыми или другими видами советов или рекомендаций, предоставленных или одобренных TradingView. Подробнее читайте в Условиях использования.