
With SPX approaching its All Time Highs (ATH), having risen non-stop on the 1M chart since the December low, we try to answer this question: How SPX behaves near its All Time Highs?
In this attempt, we thought it would be useful to back-test two long term periods, which share remarkable similarities: the 1966 - 1990 period with the 1998 - 2019 (current).
Initially and for almost a decade each, both periods share two major crisis events: For 1966 - 1990 the 68 - 70 and 72 - 74 bear markets, for 1998 - 2019 the 00 - 02 and 07 - 09 bear markets. What followed this period of turbulence was a strong bull market. The first was the one that actually led to the 2000 - 2002 crisis (Dot com bubble). The second one is still ongoing and based on the similarities of the two periods SPX should keep rising to new highs.
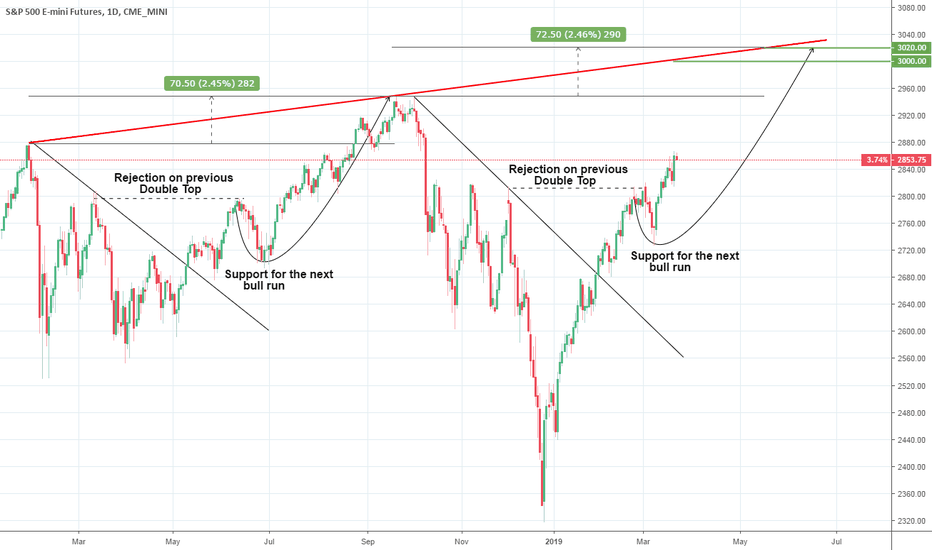
Will we have a pull back upon the ATH test? Well let's look at what happened during the last times SPX tested its ATH. In the modern era (1998 - 2019), SPX pulled back 2 out of the 3 times, but stayed on its strong bull channel since the bottom of the Housing Bubble. During the previous era (1966 - 1990), it pulled back 2 out of 4 times.
Since however the last ATH test was so recent, it is unlikely to make another pull back so soon, unless it follows the 2015 - 2016 example.
So in conclusion, SPX has much more chances breaking its current ATH (2,940) with in fact every bearish monthly candle being a buy opportunity.
More related material:

** If you like our free content follow our profile (tradingview.com/u/InvestingScope) to get more daily ideas. **
Comments and likes are greatly appreciated.
In this attempt, we thought it would be useful to back-test two long term periods, which share remarkable similarities: the 1966 - 1990 period with the 1998 - 2019 (current).
Initially and for almost a decade each, both periods share two major crisis events: For 1966 - 1990 the 68 - 70 and 72 - 74 bear markets, for 1998 - 2019 the 00 - 02 and 07 - 09 bear markets. What followed this period of turbulence was a strong bull market. The first was the one that actually led to the 2000 - 2002 crisis (Dot com bubble). The second one is still ongoing and based on the similarities of the two periods SPX should keep rising to new highs.
Will we have a pull back upon the ATH test? Well let's look at what happened during the last times SPX tested its ATH. In the modern era (1998 - 2019), SPX pulled back 2 out of the 3 times, but stayed on its strong bull channel since the bottom of the Housing Bubble. During the previous era (1966 - 1990), it pulled back 2 out of 4 times.
Since however the last ATH test was so recent, it is unlikely to make another pull back so soon, unless it follows the 2015 - 2016 example.
So in conclusion, SPX has much more chances breaking its current ATH (2,940) with in fact every bearish monthly candle being a buy opportunity.
More related material:
** If you like our free content follow our profile (tradingview.com/u/InvestingScope) to get more daily ideas. **
Comments and likes are greatly appreciated.
Telegram: t.me/investingscope
investingscope.com
Over 65% accuracy on Private Signals Channel.
Over 15% return monthly on our Account Management Plan.
Account RECOVERY services.
Free Channel: t.me/investingscopeofficial
investingscope.com
Over 65% accuracy on Private Signals Channel.
Over 15% return monthly on our Account Management Plan.
Account RECOVERY services.
Free Channel: t.me/investingscopeofficial
Похожие публикации
Отказ от ответственности
Все виды контента, которые вы можете увидеть на TradingView, не являются финансовыми, инвестиционными, торговыми или любыми другими рекомендациями. Мы не предоставляем советы по покупке и продаже активов. Подробнее — в Условиях использования TradingView.