OPEN-SOURCE SCRIPT
Обновлено Ehler's Autocorrelation Periodogram - RSI/MFI
Warning! Frequently hits the execution time limit for scripts.
Especially on initially adding to your chart. Often requires toggling show/hide indicator to get it to complete script execution within the time limit. YMMV!
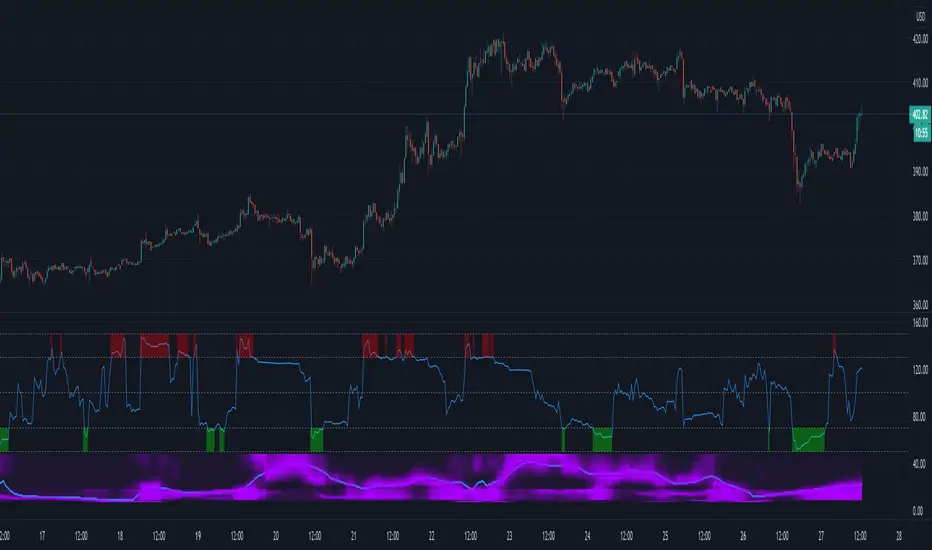
From TASC Sept 2016 this is Ehler's Autocorrelation periodogram. A means of determining the dominant cycle ("ideal" indicator length / dynamic length).
As an example it's applied here to RSI or MFI. Lower indicator segment displays the autocorrelation spectrum and the computed dominant cycle. Upper segment is RSI/MFI.
Especially on initially adding to your chart. Often requires toggling show/hide indicator to get it to complete script execution within the time limit. YMMV!
From TASC Sept 2016 this is Ehler's Autocorrelation periodogram. A means of determining the dominant cycle ("ideal" indicator length / dynamic length).
As an example it's applied here to RSI or MFI. Lower indicator segment displays the autocorrelation spectrum and the computed dominant cycle. Upper segment is RSI/MFI.
Информация о релизе
Corrected error in calculationИнформация о релизе
Another fix and initial r valuesИнформация о релизе
Corrected HP filterСкрипт с открытым кодом
В истинном духе TradingView, создатель этого скрипта сделал его открытым исходным кодом, чтобы трейдеры могли проверить и убедиться в его функциональности. Браво автору! Вы можете использовать его бесплатно, но помните, что перепубликация кода подчиняется нашим Правилам поведения.
Отказ от ответственности
Информация и публикации не предназначены для предоставления и не являются финансовыми, инвестиционными, торговыми или другими видами советов или рекомендаций, предоставленных или одобренных TradingView. Подробнее читайте в Условиях использования.
Скрипт с открытым кодом
В истинном духе TradingView, создатель этого скрипта сделал его открытым исходным кодом, чтобы трейдеры могли проверить и убедиться в его функциональности. Браво автору! Вы можете использовать его бесплатно, но помните, что перепубликация кода подчиняется нашим Правилам поведения.
Отказ от ответственности
Информация и публикации не предназначены для предоставления и не являются финансовыми, инвестиционными, торговыми или другими видами советов или рекомендаций, предоставленных или одобренных TradingView. Подробнее читайте в Условиях использования.