Money Flow Index (MFI) w/ Multi Time Frame DivergencesBack color MTF
Money Flow Index (MFI) w/ Multi Time Frame Divergences
MFI

3D Isometric MFI (Christmas Edition) [Kodexius]3D Isometric MFI (Christmas Edition) is a visual-first interpretation of the classic Money Flow Index, rendered as a projected 3D-style ribbon using an isometric mapping. Instead of plotting a standard oscillator line, the script reconstructs recent MFI history as a depth-aware ribbon that moves from back to front, producing a layered perspective effect that helps you read momentum shifts, regime transitions, and relative strength changes as a continuous structure.
This Christmas Edition was also built for fun and as a creative seasonal experiment. The goal is to keep the underlying indicator logic familiar, while presenting it in a playful, “3D showroom” style that looks great in a separate oscillator panel.
The indicator is designed for presentation quality and chart readability. It uses controlled object management (lines, polylines, labels) and renders only the most recent portion of the MFI history (user-defined depth). A decorative snow background effect adds atmosphere.
🔹 Features 🎄
🔸 Isometric 3D Projection Engine
The ribbon is produced by projecting 3D points (time offset, MFI value, depth) into 2D chart coordinates.
- X represents bar offset into history
- Y represents the MFI value
- Z introduces depth and perspective
Angle controls the projection direction, and Vertical Zoom scales the perceived amplitude.
🔸 Depth-Limited Ribbon Rendering (Back to Front)
Only the most recent History Depth values are drawn to keep performance and readability stable.
- Each segment connects two consecutive MFI values
- A top edge, bottom edge, and filled face are drawn to simulate thickness
- Older segments fade into the background
🔸 Dynamic Gradient Coloring + Depth Fade
Ribbon color follows a value-based gradient:
- Lower values lean red (risk-off pressure)
- Higher values lean green (risk-on pressure)
- Mid values blend naturally
Transparency increases with depth so older history is less dominant but still readable.
🔸 Tip Label (Value + Candy Marker) 🍭🍬
The most recent ribbon tip displays current MFI value.
A candy symbol that switches based on the 50 midpoint
The label is offset so it does not cover the ribbon tip.
🔸 Projected Reference Grid (80, 50, 20)
A projected grid is drawn at classic MFI reference levels to improve orientation:
- 80 Overbought reference
- 50 Midpoint reference
- 20 Oversold reference
These grid lines use the same projection math, so they stay aligned at any angle or zoom.
🔸 Seasonal Snow Background Effect ❄️
Randomized snow is rendered behind the ribbon using lightweight labels. This is purely decorative and does not alter MFI values or logic.
🔸 Object Lifecycle Management
Because 3D-style drawing uses many objects, the script manages them explicitly by storing references in arrays, deleting old objects, and redrawing on the last bar. This helps prevent visual stacking artifacts and keeps the panel clean.
🔹 Calculations
1) Money Flow Index Computation
The script separates “positive” and “negative” money flow based on the direction of change in the selected source, then converts their ratio into the standard 0 to 100 oscillator. Classic MFI Calculations.
calc_mfi(int length, float source) =>
float upper = math.sum(volume * (ta.change(source) <= 0 ? 0 : source), length)
float lower = math.sum(volume * (ta.change(source) >= 0 ? 0 : source), length)
float mfi = 100.0
if lower != 0
float r = upper / lower
mfi := 100 - (100 / (1 + r))
mfi
Interpretation:
upper accumulates volume-weighted source values on up moves
lower accumulates volume-weighted source values on down moves
if lower is zero, MFI defaults to 100 to avoid division errors
otherwise, MFI is computed from the ratio transform
2) History Buffer Management
The current MFI value is pushed into the front of an array every bar. The array is trimmed to History Depth so rendering stays bounded.
array.unshift(ctx.history_val, mfi_curr)
if ctx.history_val.size() > depth
ctx.history_val.pop()
3) 3D Point Model and Ribbon Thickness
Each segment is built from four projected points to form a filled face (a simple quad). A small thickness is applied to create the “ribbon” look, and depth is used to simulate perspective.
4) Isometric Projection to Chart Coordinates
3D points are mapped into chart coordinates with an angle rotation and scaling for zoom and depth.
method project(Point3 p, int anchor_bar, float angle_rad, float zoom, float z_scale) =>
float x_world = -float(p.x) * 2.0
float z_val = p.z * z_scale
float screen_x_offset = (x_world * math.cos(angle_rad)) - (z_val * 1.0)
float screen_y_offset = (p.y * zoom) + (x_world * math.sin(angle_rad)) * 0.5
int final_x = anchor_bar + int(math.round(screen_x_offset))
float final_y = screen_y_offset
chart.point.from_index(final_x, final_y)
5) Gradient and Depth Transparency
Color is derived from MFI value via a gradient, and transparency increases with segment depth so recent data remains dominant while older context stays visible.
6) Projected Reference Grid Construction
The 80, 50, 20 levels are drawn as dotted segments across the same historical span, using the same projection and depth fade logic for consistent alignment.
🎆 Wishing you a great year ahead 🎄✨
May your charts be clear, your risk be controlled, and your next year be filled with health, peace, and good trades. Happy Holidays and Happy New Year.

MFI Volume Profile [Kodexius]The MFI Volume Profile indicator blends a classic volume profile with the Money Flow Index so you can see not only where volume traded, but also how strong the buying or selling pressure was at those prices. Instead of showing a simple horizontal histogram of volume, this tool adds a money flow dimension and turns the profile into a price volume momentum heat map.
The script scans a user controlled lookback window and builds a set of price levels between the lowest and highest price in that period. For every bar inside that window, its volume is distributed across the price levels that the bar actually touched, and that volume is combined with the bar’s MFI value. This creates a volume weighted average MFI for each price level, so every row of the profile knows both how much volume traded there and what the typical money flow condition was when that volume appeared.
On the chart, the indicator plots a stack of horizontal boxes to the right of current price. The length of each box represents the relative amount of volume at that price, while the color represents the average MFI there. Levels with stronger positive money flow will lean toward warmer shades, and levels with weaker or negative money flow will lean toward cooler or more neutral shades inside the configured MFI band. Each row is also labeled in the format Volume , so you can instantly read the exact volume and money flow value at that level instead of guessing.
This gives you a detailed map of where the market really cared about price, and whether that interest came with strong inflow or outflow. It can help you spot areas of accumulation, distribution, absorption, or exhaustion, and it does so in a compact visual that sits next to price without cluttering the candles themselves.
Features
Combined volume profile and MFI weighting
The indicator builds a volume profile over a user selected lookback and enriches each price row with a volume weighted average MFI. This lets you study both participation and money flow at the same price level.
Volume distributed across the bar price range
For every bar in the window, volume is not assigned to a single price. Instead, it is proportionally distributed across all price rows between the bar low and bar high. This creates a smoother and more realistic profile of where trading actually happened.
MFI based color gradient between 30 and 70
Each price row is colored according to its average MFI. The gradient is anchored between MFI values of 30 and 70, which covers typical oversold, neutral and overbought zones. This makes strong demand or distribution areas easier to spot visually.
Configurable structure resolution and depth
Main user inputs are the lookback length, the number of rows, the width of the profile in bars, and the label text size. You can quickly switch between coarse profiles for a big picture and higher resolution profiles for detailed structure.
Numeric labels with volume and MFI per row
Every box is labeled with the total volume at that level and the average MFI for that level, in the format Volume . This gives you exact values while still keeping the visual profile clean and compact.
Calculations
Money Flow Index calculation
currentMfi is calculated once using ta.mfi(hlc3, mfiLen) as usual,
Creation of the profileBins array
The script creates an array named profileBins that will hold one VPBin element per price row.
Each VPBin contains
volume which is the total volume accumulated at that price row
mfiProduct which is the sum of volume multiplied by MFI for that row
The loop;
for i = 0 to rowCount - 1 by 1
array.push(profileBins, VPBin.new(0.0, 0.0))
pre allocates a clean structure with zero values for all rows.
Finding highest and lowest price across the lookback
The script starts from the current bar high and low, then walks backward through the lookback window
for i = 0 to lookback - 1 by 1
highestPrice := math.max(highestPrice, high )
lowestPrice := math.min(lowestPrice, low )
After this loop, highestPrice and lowestPrice define the full price range covered by the chosen lookback.
Price range and step size for rows
The code computes
float rangePrice = highestPrice - lowestPrice
rangePrice := rangePrice == 0 ? syminfo.mintick : rangePrice
float step = rangePrice / rowCount
rangePrice is the total height of the profile in price terms. If the range is zero, the script replaces it with the minimum tick size for the symbol. Then step is the price height of each row. This step size is used to map any price into a row index.
Processing each bar in the lookback
For every bar index i inside the lookback, the script checks that currentMfi is not missing. If it is valid, it reads the bar high, low, volume and MFI
float barTop = high
float barBottom = low
float barVol = volume
float barMfi = currentMfi
Mapping bar prices to bin indices
The bar high and low are converted into row indices using the known lowestPrice and step
int indexTop = math.floor((barTop - lowestPrice) / step)
int indexBottom = math.floor((barBottom - lowestPrice) / step)
Then the indices are clamped into valid bounds so they stay between zero and rowCount - 1. This ensures that every bar contributes only inside the profile range
Splitting bar volume across all covered bins
Once the top and bottom indices are known, the script calculates how many rows the bar spans
int coveredBins = indexTop - indexBottom + 1
float volPerBin = barVol / coveredBins
float mfiPerBin = volPerBin * barMfi
Here the total bar volume is divided equally across all rows that the bar touches. For each of those rows, the same fraction of volume and volume times MFI is used.
Accumulating into each VPBin
Finally, a nested loop iterates from indexBottom to indexTop and updates the corresponding VPBin
for k = indexBottom to indexTop by 1
VPBin binData = array.get(profileBins, k)
binData.volume := binData.volume + volPerBin
binData.mfiProduct := binData.mfiProduct + mfiPerBin
Over all bars in the lookback window, each row builds up
total volume at that price range
total volume times MFI at that price range
Later, during the drawing stage, the script computes
avgMfi = bin.mfiProduct / bin.volume
for each row. This is the volume weighted average MFI used both for coloring the box and for the numeric MFI value shown in the label Volume .

Delta Money Flow IndexThe Delta Money Flow Index is a modified version of the traditional Money Flow Index that uses directional volume instead of total volume to measure buying and selling pressure in a different way.
It helps traders identify overbought/oversold conditions based on actual buy/sell pressure rather than just total volume. It's designed for traders who want to see if price movements are backed by genuine buying or selling activity.
How to use it:
- Values above 80 indicate overbought conditions
- Values below 20 indicate oversold conditions
- The 50 level acts as a neutral zone. Above suggests buyers are in control, below suggests sellers are in control.
- Traders can check for divergences for potential reversal signals
- Works best on intraday timeframes where delta volume is most meaningful
What makes it different:
Unlike the standard MFI which uses total volume, the Delta MFI calculates an approximation of volume delta by assigning positive volume to up-closing candles and negative volume to down-closing candles.
This means:
- It focuses on directional pressure, not just activity
- Filters out low-conviction volume that doesn't move price
- Provides clearer signals when actual buying/selling dominates
The indicator includes visual aids like background colors for overbought/oversold and a fill showing whether the Delta MFI is above or below the 50 midpoint for quick interpretation.

RSI + MFIRSI and MFI combined, width gradient fields if OS or OB, shows divergences separate for wicks and bodies, shows dots when mfi and rsi oversold at the same time.

Hyper Strength Index | QuantLapse🧠 Hyper Strength Index (HSI) | QuantLapse
Overview:
The Hyper Strength Index (HSI) is a composite momentum oscillator designed to unify multiple strength measures into a single, adaptive framework. It combines the Relative Strength Index (RSI), Chande Momentum Oscillator (CMO), Money Flow Index (MFI), and Stochastic RSI to deliver a refined, multidimensional view of market momentum and overbought/oversold conditions.
Unlike traditional oscillators that rely on a single formula, the HSI averages four distinct momentum perspectives — price velocity, directional conviction, volume participation, and stochastic behavior — offering traders a more balanced and noise-resistant reading of market strength.
⚙️ Calculation Logic:
The Hyper Strength Index is computed as the normalized average of:
📈 RSI — classic measure of relative momentum.
💪 CMO — captures directional bias and intensity of moves.
💵 MFI — integrates volume and money flow pressure.
🔄 Stochastic RSI (K-line) — identifies momentum extremes and short-term turning points.
This fusion creates a smoother, more comprehensive signal, mitigating the weaknesses of any single oscillator.
🎯 Interpretation:
Overbought Zone (Default: > 75):
Indicates potential exhaustion of bullish momentum — a cooling phase or reversal may follow.
Oversold Zone (Default: < 7):
Suggests bearish exhaustion — a rebound or accumulation phase may emerge.
Neutral Zone (Between 7 and 75):
Represents balanced market conditions or trend continuation phases.
Visual cues highlight key conditions:
🔺 Red Highlights — Overbought regions or downward inflection points.
🔻 Green Highlights — Oversold regions or upward inflection points.
Neutral zones are shaded with subtle gray backgrounds for clarity.
💡 Key Features:
🔹 Multi-factor strength analysis (RSI + CMO + MFI + StochRSI).
🔹 Adaptive overbought/oversold detection.
🔹 Visual alerts via colored backgrounds and bar markers.
🔹 Customizable smoothing and length parameters for fine-tuning sensitivity.
🔹 Intuitive visualization ideal for both short-term scalping and swing trading setups.
🧭 Usage Notes:
Works best as a momentum confirmation tool — pair with trend filters like EMA, SuperTrend, or ADX.
In trending markets, use crossovers from extreme zones as potential continuation or exhaustion signals.
In ranging markets, exploit overbought/oversold reversals for high-probability mean reversion trades.
📘 Summary:
The Hyper Strength Index | QuantLapse distills multiple dimensions of market strength into a single, cohesive oscillator. By merging price, volume, and directional momentum, it provides traders with a more robust, responsive, and context-aware perspective on market dynamics — a next-generation evolution beyond the limitations of RSI or CMO alone.

Volume-Weighted Money Flow [sgbpulse]Overview
The VWMF indicator is an advanced technical analysis tool that combines and summarizes five leading momentum and volume indicators (OBV, PVT, A/D, CMF, MFI) into one clear oscillator. The indicator helps to provide a clear picture of market sentiment by measuring the pressure from buyers and sellers. Unlike single indicators, VWMF provides a comprehensive view of market money flow by weighting existing indicators and presenting them in a uniform and understandable format.
Indicator Components
VWMF combines the following indicators, each normalized to a range of 0 to 100 before being weighted:
On-Balance Volume (OBV): A cumulative indicator that measures positive and negative volume flow.
Price-Volume Trend (PVT): Similar to OBV, but incorporates relative price change for a more precise measure.
Accumulation/Distribution Line (A/D): Used to identify whether an asset is being bought (accumulated) or sold (distributed).
Chaikin Money Flow (CMF): Measures the money flow over a period based on the close price's position relative to the candle's range.
Money Flow Index (MFI): A momentum oscillator that combines price and volume to measure buying and selling pressure.
Understanding the Normalized Oscillators
The indicator combines the five different momentum indicators by normalizing each one to a uniform range of 0 to 100 .
Why is Normalization Important?
Indicators like OBV, PVT, and the A/D Line are cumulative indicators whose values can become very large. To assess their trend, we use a Moving Average as a dynamic reference line . The Moving Average allows us to understand whether the indicator is currently trending up or down relative to its average behavior over time.
How Does Normalization Work?
Our normalization fully preserves the original trend of each indicator.
For Cumulative Indicators (OBV, PVT, A/D): We calculate the difference between the current indicator value and its Moving Average. This difference is then passed to the normalization process.
- If the indicator is above its Moving Average, the difference will be positive, and the normalized value will be above 50.
- If the indicator is below its Moving Average, the difference will be negative, and the normalized value will be below 50.
Handling Extreme Values: To overcome the issue of extreme values in indicators like OBV, PVT, and the A/D Line , the function calculates the highest absolute value over the selected period. This value is used to prevent sharp spikes or drops in a single indicator from compromising the accuracy of the normalization over time. It's a sophisticated method that ensures the oscillators remain relevant and accurate.
For Bounded Indicators (CMF, MFI): These indicators already operate within a known range (for example, CMF is between -1 and 1, and MFI is between 0 and 100), so they are normalized directly without an additional reference line.
Reference Line Settings:
Moving Average Type: Allows the user to choose between a Simple Moving Average (SMA) and an Exponential Moving Average (EMA).
Volume Flow MA Length: Allows the user to set the lookback period for the Moving Average, which affects the indicator's sensitivity.
The 50 line serves as the new "center line." This ensures that, even after normalization, the determination of whether a specific indicator supports a bullish or bearish trend remains clear.
Settings and Visual Tools
The indicator offers several customization options to provide a rich analysis experience:
VWMF Oscillator (Blue Line): Represents the weighted average of all five indicators. Values above 50 indicate bullish momentum, and values below 50 indicate bearish momentum.
Strength Metrics (Bullish/Bearish Strength %): Two metrics that appear on the status line, showing the percentage of indicators supporting the current trend. They range from 0% to 100%, providing a quick view of the strength of the consensus.
Dynamic Background Colors: The background color of the chart automatically changes to bullish (a blue shade by default) or bearish (a default brown-gray shade) based on the trend. The transparency of the color shows the consensus strength—the more opaque the background, the more indicators support the trend.
Advanced Settings:
- Background Color Logic: Allows the user to choose the trigger for the background color: Weighted Value (based on the combined oscillator) or Strength (based on the majority of individual indicators).
- Weights: Provides full control over the weight of each of the five indicators in the final oscillator.
Using the Data Window
TradingView provides a useful Data Window that allows you to see the exact numerical values of each normalized oscillator separately, in addition to the trend strength data.
You can use this window to:
Get more detailed information on each indicator: Viewing the precise numerical data of each of the five indicators can help in making trading decisions.
Calibrate weights: If you want to manually adjust the indicator weights (in the settings menu), you can do so while tracking the impact of each indicator on the weighted oscillator in the Data Window.
The indicator's default setting is an equal weight of 20% for each of the five indicators.
Alert Conditions
The indicator comes with a variety of built-in alerts that can be configured through the TradingView alerts menu:
VWMF Cross Above 50: An alert when the VWMF oscillator crosses above the 50 line, indicating a potential bullish momentum shift.
VWMF Cross Below 50: An alert when the VWMF oscillator crosses below the 50 line, indicating a potential bearish momentum shift.
Bullish Strength: High But Not Absolute Consensus: An alert when the bullish trend strength reaches 60% or more but is less than 100%, indicating a high but not absolute consensus.
Bullish Strength at 100%: An alert when all five indicators (MFI, OBV, PVT, A/D, CMF) show bullish strength, indicating a full and absolute consensus.
Bearish Strength: High But Not Absolute Consensus: An alert when the bearish trend strength reaches 60% or more but is less than 100%, indicating a high but not absolute consensus.
Bearish Strength at 100%: An alert when all five indicators (MFI, OBV, PVT, A/D, CMF) show bearish strength, indicating a full and absolute consensus.
Summary
The VWMF indicator is a powerful, all-in-one tool for analyzing market momentum, money flow, and sentiment. By combining and normalizing five different indicators into a single oscillator, it offers a holistic and accurate view of the market's underlying trend. Its dynamic visual features and customizable settings, including the ability to adjust indicator weights, provide a flexible experience for both novice and experienced traders. The built-in alerts for momentum shifts and trend consensus make it an effective tool for spotting trading opportunities with confidence. In essence, VWMF distills complex market data into clear, actionable signals.
Important Note: Trading Risk
This indicator is intended for educational and informational purposes only and does not constitute investment advice or a recommendation for trading in any form whatsoever.
Trading in financial markets involves significant risk of capital loss. It is important to remember that past performance is not indicative of future results. All trading decisions are your sole responsibility. Never trade with money you cannot afford to lose.

MTF Oscillator Stack [BigBeluga]🔵 OVERVIEW
The MTF Oscillator Stack brings powerful multi-timeframe momentum analysis directly into your price chart. You can select one oscillator— RSI , MFI , or Stochastic RSI —and display it across up to 4 different timeframes. Each panel is neatly stacked horizontally above price , offering quick insight into cross-timeframe conditions like trend direction, exhaustion zones, and momentum shifts.
🔵 CONCEPTS
Single Oscillator Mode: Select one oscillator type (RSI, MFI, or Stoch RSI) to analyze across all selected timeframes.
Top-Chart Horizontal Panels: Oscillator plots are aligned horizontally at the top of the chart for seamless top-down reading.
Signal Comparison Arrows: Arrows (🢁 / 🢃) indicate oscillator position relative to its signal line.
Overbought/Oversold Zones: Transparent 30–70 fill zones highlight key reversal areas.
Dynamic Display Logic: Only enabled panels are shown; spacing adjusts based on active timeframes.
Timeframe Tagging: Each oscillator panel is labeled with its corresponding timeframe (e.g., 1H, 2H, 4H).
🔵 FEATURES
Choose one oscillator (RSI, MFI, or Stoch RSI) and apply it across up to 4 timeframes.
Each oscillator panel includes: price-synced plot, signal line, and zone shading.
Scale alignment allows users to place charts at the bottom or top.
Clear arrow signals show whether oscillator is bullish or bearish.
Individual length and signal settings per timeframe.
Toggle for alignment mode: evenly spaced or floating layout.
All panels use a consistent layout for faster decision-making.
🔵 HOW TO USE
Select your preferred oscillator and activate 2–4 key timeframes (e.g., 1H, 4H, D1, W1).
Use signal crossovers as a bullish (🢁) or bearish (🢃) trend cue.
Look for aligned extremes (e.g., all timeframes overbought) to spot momentum exhaustion.
Ideal for momentum confluence strategies and top-down confirmation.
Use horizontal layout to stay focused on price while assessing broader structure.
🔵 CONCLUSION
MTF Oscillator Stack simplifies complex multi-timeframe momentum analysis into one clean, actionable visual. Whether you're tracking RSI, MFI, or Stoch RSI, this tool helps you stay aligned with the broader trend—without ever leaving your main chart.

Range Breakout [sgbpulse]Range Breakout
1. Overview
The "Range Breakout " indicator is a powerful tool designed to identify and visually display price ranges on your chart using pivot points. It dynamically draws two distinct boxes – an External Range and an Internal Range – helping traders pinpoint potential support and resistance zones. Beyond its visual representation, the indicator offers a comprehensive set of 12 unique breakout alerts, providing real-time notifications for significant price movements outside these defined ranges. Additionally, it integrates RSI and MFI metrics for momentum confirmation.
2. How It Works
The indicator operates by identifying pivot points based on user-defined "left" and "right" bar lengths. A high pivot is a bar with a specified number of lower highs both to its left and right, and similarly for a low pivot.
External Range: Calculated using longer pivot lengths (default: 15 bars left, 6 bars right). This range represents broader, more significant price consolidation areas.
Internal Range: Calculated using shorter pivot lengths (default: 4 bars left, 3 bars right). This range captures tighter, more immediate price consolidations within the broader trend.
The External Range will always be greater than or equal to the Internal Range, as it's based on a wider historical context. Both ranges are displayed as transparent boxes on your chart, dynamically adjusting as new pivots are formed.
3. Key Features and Settings
Customizable Pivot Lengths:
External Range (Left/Right Bars): Adjust sensitivity for identifying the broader price range. Longer lengths lead to more stable, but less frequent, range updates.
Internal Range (Left/Right Bars): Adjust sensitivity for the tighter, more immediate price range.
Tool Tips: Minimum 6 bars for the External Range, and minimum 2 bars for the Internal Range.
Customizable Range Colors: Easily change the background colors of the External and Internal Range boxes to match your chart's aesthetic.
Dynamic Range Display: The indicator automatically updates the range boxes as new pivot highs and lows are formed, always presenting the most current valid ranges.
RSI / MFI Settings:
Timeframe Source: Select the timeframe for RSI and MFI calculation.
- Chart: Calculation based on the current chart timeframe.
- Daily: Always calculated based on the daily ("D") timeframe, even if the chart is on a lower timeframe.
RSI Length: Period length for RSI calculation (default: 14).
RSI Overbought Level: Overbought level for RSI (default: 70.0).
RSI Oversold Level: Oversold level for RSI (default: 30.0).
MFI Length: Period length for MFI calculation (default: 14).
MFI Overbought Level: Overbought level for MFI (default: 80.0).
MFI Oversold Level: Oversold level for MFI (default: 20.0).
4. Synergy of Ranges & Breakout Strength
The interaction between the External and Internal Ranges provides deep insights into price movement and breakout strength:
Immediate Direction: The movement of the Internal Range (up or down) indicates the short-term directional bias within the broader framework of the External Range.
Strength Confirmation: A breakout of the External Range, followed by a breakout of the Internal Range, confirms the strength of the move and increases confidence in the breakout.
Strong Momentum ("Leaving" Ranges Behind): When price breaks out with exceptionally strong momentum, it continues to move aggressively and does not immediately form new pivots. In such situations, the existing ranges (External and Internal) remain in place while the candles "leave them behind." A "Full Candle" breakout, where the entire candle moves past both ranges, indicates a particularly powerful and decisive move.
Momentum (RSI / MFI) as Confirmation:
- RSI (Relative Strength Index): Measures the speed and change of price movements. Extreme values (above 70 or below 30) indicate overbought/oversold conditions respectively, confirming strong momentum in a breakout.
- MFI (Money Flow Index): Similar to RSI but incorporates volume. Extreme values (above 80 or below 20) indicate strong money flow in/out, reinforcing breakout confirmation.
- Importance of Confirmation: If a breakout occurs but momentum indicators do not confirm it (for example, an upside breakout while RSI is declining), this could signal weakness in the move and the risk of a false breakout (Fakeout).
5. Visuals
The indicator provides clear visual representations on the chart:
Range Boxes:
Two dynamic boxes are drawn on the chart: one for the External Range and one for the Internal Range.
These boxes update continuously, displaying the current range boundaries based on the latest pivots. They provide an immediate visual indication of support and resistance levels.
RSI/MFI Status Labels:
Small text labels appear to the right of the current bar, vertically centered.
They display the status of RSI and MFI: RSI OB (Overbought), RSI OS (Oversold), MFI OB, MFI OS, along with the exact value.
Important: The labels remain on the chart as long as the condition holds (indicator is above/below the level), unlike alerts which mark a singular crossover event.
Plotting of Key Values:
The indicator plots six invisible series on the chart, primarily to allow the user to view the exact numerical values of:
- The upper and lower bounds of the External Range (External High, External Low).
- The upper and lower bounds of the Internal Range (Internal High, Internal Low).
- The calculated RSI and MFI values (RSI, MFI).
These values are accessible for viewing through TradingView's Data Window and also via the Status Line when hovering over the relevant candle. This enables more precise quantitative analysis of range levels and momentum.
6. Comprehensive Breakout Alerts
The "Range Breakout " indicator provides 12 distinct alert conditions for breakouts, allowing you to select the required level of confirmation for each alert. All alerts are triggered only upon a fully confirmed bar close (barstate.isconfirmed) to minimize false signals and ensure reliability.
All breakout alerts are configured to detect a Crossover/Crossunder of the levels, meaning a specific event where the price moves from one side of the range to the other.
External Range Breakout UP
- Close: Price closes above the External Range.
- Real Body: The entire "real body" of the candle (min of open/close prices) closes above the External Range.
- Full Candle: The entire candle (the lowest point of the candle) closes above the External Range.
External Range Breakout DOWN
- Close: Price closes below the External Range.
- Real Body: The entire "real body" of the candle (max of open/close prices) closes below the External Range.
- Full Candle: The entire candle (the highest point of the candle) closes below the External Range.
Internal Range Breakout UP
- Close: Price closes above the Internal Range.
- Real Body: The "real body" of the candle closes above the Internal Range.
- Full Candle: The entire candle closes above the Internal Range.
Internal Range Breakout DOWN
- Close: Price closes below the Internal Range.
- Real Body: The "real body" of the candle closes below the Internal Range.
- Full Candle: The entire candle closes below the Internal Range.
7. Ideal Use Cases
This indicator is ideal for traders who:
Want to clearly identify and monitor price consolidation zones.
Seek confirmation for breakout strategies across various timeframes.
Require reliable and automated alerts for potential entry or exit points based on range expansion.
8. Complementary Indicator
For even more comprehensive market analysis, we highly recommend using this indicator in conjunction with Market Structure Support & Resistance External/Internal & BoS .
This powerful complementary indicator automatically and accurately identifies significant support and resistance levels by locating high and low pivot points, as well as key Pre-Market High/Low levels. Its strength lies in its dynamic adaptability to any timeframe and asset, providing precise and relevant real-time levels while maintaining a clean chart. It also identifies Break of Structure (BoS) to signal potential trend changes or continuations.
Using both indicators together provides a robust framework for identifying defined ranges and potential trend shifts, enabling more informed trading decisions.
View Market Structure Support & Resistance External/Internal & BoS Indicator
9. Important Note: Trading Risk
This indicator is intended for educational and informational purposes only and does not constitute investment advice or a recommendation for trading in any form whatsoever.
Trading in financial markets involves significant risk of capital loss. It is important to remember that past performance is not indicative of future results. All trading decisions are your sole responsibility. Never trade with money you cannot afford to lose.

RSI Buy Sell Signals+ with MFI Cloud [RanaAlgo]Indicator Overview
This indicator combines RSI (Relative Strength Index) with MFI (Money Flow Index) to generate trading signals with additional confirmation filters. The key features include:
RSI Analysis (14-period) with overbought/oversold levels
MFI Cloud (20-period default) showing trend direction via EMAs
Enhanced Signal Generation with volume and trend confirmation options
Visual Elements including colored zones, signal labels, and an information panel
How to Use This Indicator
Basic Interpretation:
Buy Signals (green labels) appear when:
RSI crosses above oversold level (30) OR
RSI shows a rising pattern from oversold zone with volume/trend confirmation (if enabled)
Sell Signals (red labels) appear when:
RSI crosses below overbought level (70) OR
RSI shows a falling pattern from overbought zone with volume/trend confirmation (if enabled)
MFI Cloud provides trend confirmation:
Green cloud = bullish trend (fast EMA > slow EMA)
Red cloud = bearish trend (fast EMA < slow EMA)
Recommended Usage:
For Conservative Trading:
Enable both volume and trend confirmation
Require MFI cloud to align with signal direction
Wait for RSI to clearly exit overbought/oversold zones
For Active Trading:
Combine with price action at key support/resistance levels
Watch for divergence between price and RSI
The Information Panel (top-right) shows:
Current RSI value and status
MFI trend direction
Last generated signal
Current momentum
Customization Options:
Adjust RSI/MFI lengths for sensitivity
Modify overbought/oversold levels
Toggle volume/trend confirmation requirements
Adjust visual elements like cloud opacity and zone visibility

Money Flow Pulse💸 In markets where volatility is cheap and structure is noisy, what matters most isn’t just the move — it’s the effort behind it. Money Flow Pulse (MFP) offers a compact, color-coded readout of real-time conviction by scoring volume-weighted price action on a five-tier scale. It doesn’t try to predict reversals or validate trends. Instead, it reveals the quality of the move in progress: is it fading , driving , exhausting , or hollow ?
🎨 MFP draws from the traditional Money Flow Index (MFI), a volume-enhanced momentum oscillator, but transforms it into a modular “pressure readout” that fits seamlessly into any structural overlay. Rather than oscillating between extremes with little interpretive guidance, MFP discretizes the flow into clean, color-coded regimes ranging from strong inflow (+2) to strong outflow (–2). The result is a responsive diagnostic layer that complements, rather than competes with, tools like ATR and/or On-Balance Volume.
5️⃣ MFP uses a normalized MFI value smoothed over 13 periods and classified into a 5-tier readout of Volume-Driven Conviction :
🍆 Exhaustion Inflow — usually a top or blowoff; not strength, but overdrive (+2)
🥝 Active Inflow — supportive of trend continuation (+1)
🍋 Neutral — chop, coil, or fakeouts (0)
🍑 Selling Intent — weakening structure, possible fade setups (-1)
🍆 Exhaustion Outflow — often signals forced selling or accumulation traps (-2)
🎭 These tiers are not arbitrary. Each one is tuned to reflect real capital behavior across timeframes. For instance, while +1 may support continuation, +2 often precedes exhaustion — especially on the lower timeframes. Similarly, a –1 reading during a pullback suggests sell-side pressure is building, but a shift to –2 may mean capitulation is already underway. The difference between the two can define whether a move is tradable continuation or strategic exhaustion .
🌊 The MFI ROC (Rate of Change) feature can be toggled to become a volatility-aware pulse monitor beneath the derived MFI tier. Instead of scoring direction or structure, ROC reveals how fast conviction is changing — not just where it’s headed, but how hard it's accelerating or decaying. It measures the raw Δ between the current and previous MFI values, exposing bursts of energy, fading pressure, or transitional churn .
🎢 Visually, ROC appears as a low-opacity area fill, anchored to a shared lemon-yellow zero line. When the green swell rises, buying pressure is accelerating; when the red drops, flow is actively deteriorating. A subtle bump may signal early interest — while a steep wave hints at an emotional overreaction. The ROC value itself provides numeric insight alongside the raw MFI score. A reading of +3.50 implies strong upside momentum in the flow — often supporting trend ignition. A score of –6.00 suggests rapid deceleration or full exhaustion — often preceding reversals or failed breakouts.
・ MFI shows you where the flow is
・ ROC tells you how it’s behaving
😎 This blend reveals not just structure or intent — but also urgency . And in flow-based trading, urgency often precedes outcome.
🧩 Divergence isn’t delay — it’s disagreement . One of the most revealing features of MFP is how it exposes momentum dissonance — situations where price and flow part ways. These divergences often front-run pivots , traps , or velocity stalls . Unlike RSI-style divergence, which whispers of exhaustion, MFI divergence signals a breakdown in conviction. The structure may extend — but the effort isn’t there.
・ Price ▲ MFI ▼ → Effortless Markup : Often signals distribution or a grind into liquidity. Without rising MFI, the rally lacks true flow participation — a warning of fragility.
・ Price ▼ MFI ▲ → Absorption or Early Accumulation : Price breaks down, but money keeps flowing in — a hidden bid. Watch for MFI tier shifts or ROC bursts to confirm a reversal.
🏄♂️ These moments don’t require signal overlays or setup hunting. MFP narrates the imbalance. When price breaks structure but flow does not — or vice versa — you’re not seeing trend, you’re seeing disagreement, and that's where edge begins.
💤 MFP is especially effective on intraday charts where volume dislocations matter most. On the 1H or 15m chart, it helps distinguish between breakouts with conviction versus those lacking flow. On higher timeframes, its resolution softens — it becomes more of a drift indicator than a trigger device. That’s by design: MFP prioritizes pulse, not position. It’s not the fire, it’s the heat.
📎 Use MFP in confluence with structural overlays to validate price behavior. A ribbon expansion with rising MFP is real. A compression breakout without +1 flow is "fishy". Watch how MFP behaves near key zones like anchored VWAP, MAs or accumulation pivots. When MFP rises into a +2 and fails to sustain, the reversal isn’t just technical — it’s flow-based.
🪟 MFP doesn’t speak loudly, but it never whispers without reason. It’s the pulse check before action — the breath of the move before the breakout. While it stays visually minimal on the chart, the true power is in the often overlooked Data Window, where traders can read and interpret the score in real time. Once internalized, these values give structure-aware traders a framework for conviction, continuation, or caution.
🛜 MFP doesn’t chase momentum — it confirms conviction. And in markets defined by noise, that signal isn’t just helpful — it’s foundational.

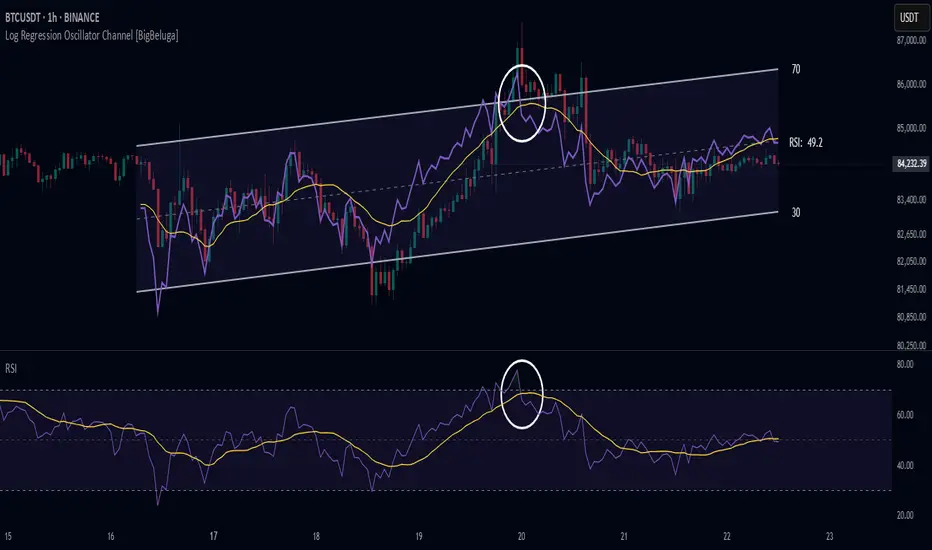
Log Regression Oscillator Channel [BigBeluga]
This unique overlay tool blends logarithmic trend analysis with dynamic oscillator behavior. It projects RSI, MFI, or Stochastic lines directly into a log regression channel on the price chart — offering an intuitive way to detect overbought/oversold momentum within the broader price structure.
🔵Key Features:
Logarithmic Regression Channel:
➣ Draws a trend-based channel using logarithmic regression, adapting to price growth curvature over time.
➣ Features upper, lower, and optional midline boundaries to visualize trend flow and range extremes.
Oscillator Overlay (RSI / MFI / Stochastic):
➣ Projects your chosen oscillator inside the channel using dynamic polylines.
➣ Allows switching between RSI, Money Flow Index, or Stochastic for versatile momentum insight.
Threshold-Based Scaling:
➣ The top and bottom of the channel represent traditional oscillator thresholds (e.g., RSI 70/30).
➣ Users can modify the scale in settings to customize what "overbought" or "oversold" means visually.
Signal Line Integration:
➣ Adds a yellow moving average (signal line) for smoother confirmation of oscillator turns.
➣ Helps identify divergence, momentum shifts, and fakeouts with better clarity.
Live Oscillator Readout:
➣ Displays the real-time oscillator value at the right edge of the chart.
➣ Ensures traders stay aware of current momentum levels without switching panels.
🔵Usage:
Momentum Context:
➣ When the oscillator touches the upper regression band, it may signal local overbought pressure.
➣ Touching the lower band may indicate oversold conditions within the current log trend.
Divergence Detection:
➣ Use the oscillator’s behavior relative to the channel slope to spot divergence from price.
➣ For example, RSI rising inside a falling channel can flag early trend shifts.
Trend-Sensitive Entries:
➣ Combine oscillator signals with log channel direction to filter trades in trend alignment.
➣ Signal line crossovers inside the channel act as early warning for momentum turns.
The Log Regression Oscillator Channel transforms how traders view classic momentum tools. By embedding oscillators into a logarithmic trend structure, it offers unmatched clarity on momentum positioning relative to price expansion. Ideal for swing traders, mean-reverters, or trend followers looking to sharpen entries and exits with style.
Triple SRSI-MFI Ⅲ - Multi TimeframeTriple SRSI-MFI Ⅲ - Multi Timeframe Indicator
Description
The Triple SRSI-MFI Ⅲ - Multi Timeframe indicator is a powerful tool designed to combine Stochastic RSI (SRSI) and Money Flow Index (MFI) across multiple timeframes (higher, current, and lower). It provides a comprehensive view of market momentum and potential overbought/oversold conditions by calculating a weighted hybrid of SRSI-MFI values from three different timeframes. The indicator also integrates Bollinger Bands to help identify trend direction and volatility.
This indicator is ideal for traders who want to analyze market conditions across multiple timeframes without switching charts. It automatically adjusts settings based on the current timeframe and includes a dynamic weighting system optimized for Bitcoin volatility. Additionally, a real-time information panel displays the market state (buy/sell) and signal strength.
Key Features
Multi-Timeframe Analysis: Combines SRSI-MFI from higher, current, and lower timeframes for a holistic view.
Dynamic Weighting: Automatically adjusts weights for each timeframe based on Bitcoin volatility, with an option for manual customization.
Bollinger Bands Integration: Visualizes trend direction and volatility using Bollinger Bands, with customizable source selection.
Real-Time Info Panel: Displays market state (buy/sell) and signal strength (%) in the top-right corner of the chart.
Customizable Settings: Allows users to tweak MFI source, Bollinger Bands parameters, and visibility of individual components.
How to Use
Add to Chart: Add the "Triple SRSI-MFI Ⅲ - Multi Timeframe" indicator to your chart.
Interpret Signals:
Market State (Buy/Sell): Shown in the info panel. "Buy" when the average SRSI-MFI is above the Bollinger Bands basis, "Sell" when below.
Strength (%): The relative position of the average SRSI-MFI within the Bollinger Bands, scaled from 0% to 100%.
Overbought/Oversold Levels: The indicator plots horizontal lines at 80 (overbought) and 20 (oversold). Use these as potential reversal zones.
Combine with Price Action: Use the indicator in conjunction with price action or other tools for better decision-making.
Adjust Settings: Customize the settings (e.g., Bollinger Bands length, weights, visibility) to match your trading style.
Settings
MFI Source: Select the source for MFI calculation (default: "hlc3"). Options include "close", "open", "high", "low", "hl2", "hlc3", "ohlc4".
Bollinger Bands:
Length: Period for Bollinger Bands calculation (default: 20).
Multiplier: Standard deviation multiplier for the bands (default: 2.0).
Source: Choose which SRSI-MFI value to use for Bollinger Bands ("averageHybrid", "hybrid_higher", "hybrid_current", "hybrid_lower"; default: "hybrid_higher").
Weights:
Auto Weight Enabled: Enable/disable automatic weights based on Bitcoin volatility (default: true).
Higher/Current/Lower Weights: Manually set weights for each timeframe if auto-weight is disabled (defaults: 1.5, 1.0, 0.5).
Indicator On/Off:
Toggle visibility for Higher SRSI-MFI, Current SRSI-MFI, Lower SRSI-MFI, Average SRSI-MFI, and Bollinger Bands.
How It Works
SRSI-MFI Calculation:
Stochastic RSI (SRSI) and Money Flow Index (MFI) are calculated for three timeframes: higher, current, and lower.
The hybrid value (SRSI * (MFI / 100)) is computed for each timeframe.
Weighted Average:
The hybrid values are combined into a weighted average (averageHybrid) using dynamic or manual weights.
Bollinger Bands:
Bollinger Bands are applied to the selected source (e.g., hybrid_higher) to identify trend direction and volatility.
Relative Position:
The position of averageHybrid within the Bollinger Bands is scaled to a percentage (0% to 100%) for strength assessment.
Visualization:
Plots individual SRSI-MFI lines, Bollinger Bands, and overbought/oversold levels.
A real-time info panel provides market state and signal strength.
Notes
This indicator is best used as part of a broader trading strategy. It is not a standalone signal generator and should be combined with other forms of analysis.
The automatic weights are optimized for Bitcoin (BTC) volatility. For other assets, you may need to adjust the weights manually.
The indicator may require sufficient historical data to calculate higher and lower timeframe values accurately.

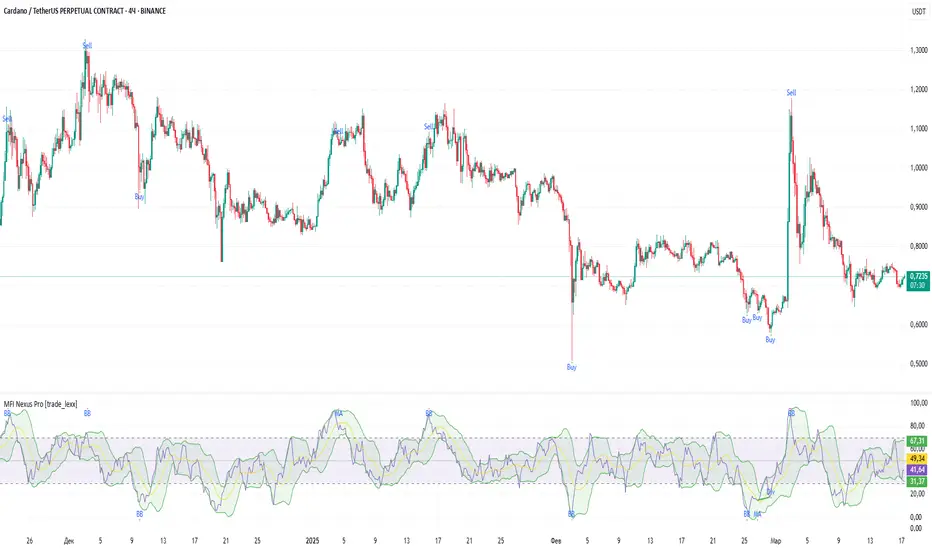
MFI Nexus Pro [trade_lexx]📈 MFI Nexus Pro is your reliable trading assistant!
📊 What is MFI Nexus Pro ?
MFI Nexus Pro is a trading indicator that analyzes cash flows in the market. It shows where money is moving — into or out of an asset, and based on this, generates buy or sell signals.
💡 The main components of the indicator
📊 The MFI Cash Flow Index (MFI)
shows the strength of cash flow into an asset. Values above 70 indicate overbought (an early sale is possible), and values below 30 indicate oversold (an early purchase is possible).
📈 Moving Averages (MA)
The indicator uses 10 different types of moving averages to smooth the MFI line.:
- SMA: Simple moving average
- EMA: Exponential moving average
- WMA: Weighted moving average
And other more complex types (HMA, KAMA, VWMA, ALMA, TEMA, ZLEMA, DEMA)
The choice of the type of moving average affects the speed of the indicator's response to market changes.
🎯 Bollinger Bands (BB)
Bands around the moving average that widen and narrow depending on volatility. They help determine when the MFI is out of the normal range.
🔄 Divergences
Divergences show discrepancies between price and MFI:
- Bullish divergence: the price is falling and the MFI is rising — an upward reversal is possible
- Bearish divergence: the price is rising and the MFI is falling — a downward reversal is possible
🔍 Indicator signals
1️⃣ Moving average signals (MA)
Buy signal
- What happens: MFI crosses its moving average from bottom to top
- What does it look like: the green triangle labeled "MA" under the chart
- What does it mean: money begins to actively flow into the asset, price growth is possible
Sell signal
- What happens: the MFI crosses the moving average from top to bottom
- What does it look like: a red triangle with the label "MA" above the chart
- What does it mean: money starts to leave the asset, the price may fall
2️⃣ Bollinger Band Signals (BB)
Buy signal
- What's happening: The MFI crosses the lower Bollinger band from bottom to top
- What it looks like: the green triangle marked "BB"
- What it means: The MFI was too low and is now starting to recover
Sell Signal
- What's going on: MFI crosses the upper Bollinger band from top to bottom
- What it looks like: a red triangle marked "BB"
- What it means: The MFI was too high and is now starting to decline
3️⃣ Divergence Signals (Div)
Buy Signal (Bullish Divergence)
- What's going on: the price is falling more than the MFI
- What it looks like: a green triangle marked "Div"
- What it means: despite the fall in price, money is already starting to return to the asset
Sell signal (bearish divergence)
- What is happening: the price is rising more strongly than the MFI
- What does it look like: the red triangle with the label "Div"
- What does it mean: despite the price increase, money is already starting to leave the asset
🛠️ Filters to filter out false signals
1️⃣ Minimum distance between the signals
- What it does: sets the minimum number of candles between signals
- Why it is needed: prevents signals from being too frequent during strong market fluctuations
- How to set it up: Set the number from 0 and above (default: 5)
2️⃣ "Waiting for the opposite signal" mode
- What it does: waits for a signal in the opposite direction before generating a new signal
- Why you need it: it helps you not to miss important trend reversals
- How to set up: just turn the function on or off
3️⃣ Filter by MFI levels
- What it does: generates signals only when the MFI is in the specified ranges
- Why it is needed: it helps to catch the moments when the market is oversold or overbought
- How to set up:
- For buy signals: set a range for oversold (e.g. 1-30)
- For sell signals: set a range for overbought (e.g. 70-100)
4️⃣ The RSI filter
- What it does: additionally checks the RSI values to confirm the signals
- Why it is needed: adds additional confirmation from another popular indicator
- How to set up: Similar to the MFI filter, set ranges for buying and selling
🔄 Signal combination modes
1️⃣ Normal mode ("None")
- How it works: all signals (MA, BB, Div) work independently of each other
- When to use it: for general market analysis or when learning how to work with the indicator
2️⃣ "And" mode ("MA and BB and Div")
- How it works: the alarm appears only when several conditions are triggered simultaneously
- Combination options:
- MA+BB: signals from the moving average and Bollinger bands
- MA+Div: signals from the moving average and divergence
- BB+Div: signals from the Bollinger bands and divergence
- MA+BB+Div: all three signals simultaneously
- When to use: for more reliable but rare signals
3️⃣ "OR" mode ("MA or BB or Div")
- How it works: the alarm appears when any of the conditions are triggered
- When to use: for frequent signals when you don't want to miss any opportunity.
🔌 Connecting to trading strategies
The indicator can be connected to your trading strategies using 5 different channels.:
1. Channel for MA signals: connects only signals from moving averages
2. BB signal channel: connects only the signals from the Bollinger bands
3. Channel for divergence signals: connects only divergence signals
4. Channel for "And" mode: connects only combined signals
5. Channel for "OR" mode: connects signals from any source
🔔 Setting up alerts
The indicator can send alerts when alarms appear.:
- Alerts for MA: when the MFI crosses the moving average
- Alerts for BB: when the MFI crosses the Bollinger bands
- Divergence alerts: when a divergence is detected
- Combined alerts: for "AND" and "OR" modes
🎭 What does the indicator look like on the chart ?
- MFI main line: purple line
- Overbought/oversold levels: horizontal lines at levels 30 and 70
- Middle line: dotted line at level 50
- MFI Moving Average: yellow line
- Bollinger bands: green lines around the moving average
- Signals: green and red triangles with corresponding labels
📚 How to start using MFI Nexus Pro
1️⃣ Initial setup
- Add an indicator to your chart
- Select the type of moving average and the period (you can leave it as the default)
- Activate the desired signal types (MA, BB, Div)
2️⃣ Filter settings
- Set the distance between the signals to get rid of unnecessary noise
- Adjust the MFI and RSI levels depending on how volatile your asset is
- If you need more reliable signals, turn on the "Waiting for the opposite signal" mode.
3️⃣ Operation mode selection
- First, use the standard mode to see all possible signals.
- When you get comfortable, try the "And" mode for more reliable signals.
- For active trading, you can use the "OR" mode
4️⃣ Setting up Alerts
- Select the types of signals you want to be notified about
- Set up alerts for "AND" or "OR" modes if you use them
5️⃣ Verification and adaptation
- Check the operation of the indicator on historical data
- Adjust the parameters for a specific asset
- Adapt the settings to your trading style
🌟 Usage examples
For trend trading
- Use MA signals in the direction of the main trend
- Turn on the "Waiting for the opposite signal" mode
- Set stricter levels for filters
For trading in a sideways range
- Use BB signals to detect bounces from the range boundaries
- Use the MFI level filter to confirm overbought/oversold conditions
- Adjust the Bollinger bands according to the width of the range
To determine the pivot points
- Pay attention to the divergence signals
- Use the "And" mode by combining divergences with other signals
- Check the RSI filter for additional confirmation
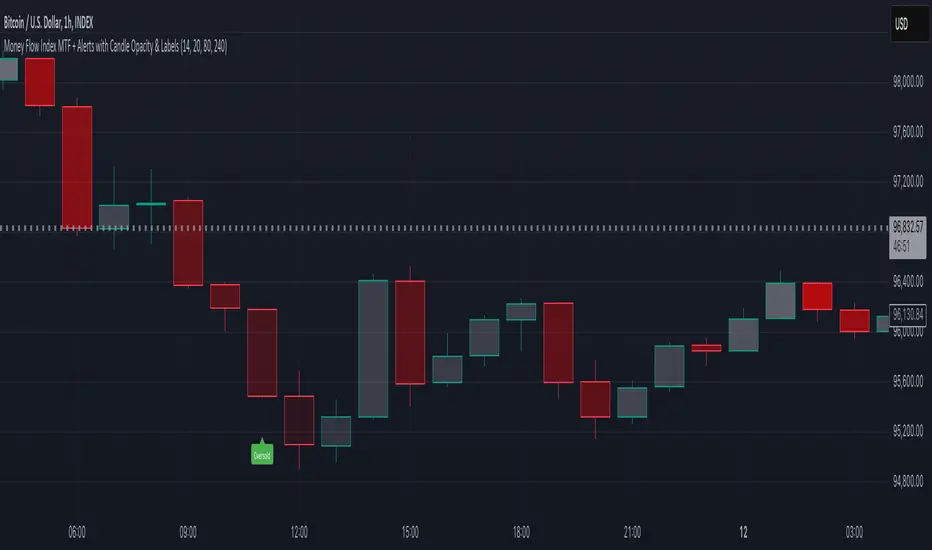
Money Flow Index MTF + Alerts with Candle Opacity & LabelsHow to Use the Money Flow Index MTF + Alerts with Candle Opacity & Labels Indicator
Overview:
This indicator is designed to help you gauge the buying and selling pressure in a market by using the Money Flow Index (MFI). Unlike many momentum oscillators, the MFI incorporates both price and volume, providing a unique perspective on market activity. It is particularly useful when you want to visually assess potential overbought or oversold conditions.
Indicator Components:
Money Flow Index (MFI) Calculation:
The indicator computes the MFI using a user-defined look-back period (default is 14 bars). The MFI is scaled between 0 and 100, where values above 80 typically indicate overbought conditions and values below 20 suggest oversold conditions.
Multi-Timeframe (MTF) Capability:
You can choose to calculate the MFI using either the current chart’s timeframe or a custom timeframe (for example, a 4-hour chart). This flexibility allows you to compare longer-term money flow trends against your primary trading timeframe.
Candle Opacity Based on MFI:
The opacity of the candles on your chart is dynamically adjusted based on the current MFI reading. When the MFI is high (near 100), candles become more opaque; when the MFI is low (near 0), candles appear more transparent. This visual cue can help you quickly spot changes in market momentum.
Visual Labels for Overbought/Oversold Conditions:
When the MFI crosses into the overbought territory, a red label reading “Overbought” is displayed above the high of the bar. Similarly, when it crosses into the oversold territory, a green label reading “Oversold” is placed below the low of the bar. These labels provide an immediate visual alert to potential reversal points or areas of caution.
Alert Conditions:
The script also includes alert conditions for both overbought and oversold signals. You can set up TradingView alerts so that you are notified in real time when the indicator detects these conditions.
Theory Behind the Money Flow Index (MFI):
The Money Flow Index is a momentum oscillator that uses both price and volume to signal the strength behind price moves.
Overbought Conditions: When the MFI is above 80, it suggests that buying pressure is very strong and the asset might be due for a pullback or consolidation.
Oversold Conditions: Conversely, when the MFI falls below 20, selling pressure is high and the asset might be oversold, potentially priming it for a bounce.
Keep in mind that in strong trending markets, overbought or oversold readings can persist for extended periods, so the MFI should be used in conjunction with other technical analysis tools.
Position Management Guidance:
While the indicator is useful for spotting potential overbought and oversold conditions, it is not designed to serve as an automatic signal to completely close a position. Instead, you might consider using it as a guide for pyramiding—gradually adding to your position over several days rather than exiting all at once. This approach allows you to better manage risk by:
Scaling In or Out Gradually: Instead of making one large position change, you can add or reduce your position in increments as market conditions evolve.
Diversifying Risk: Pyramiding helps you avoid the pitfalls of trying to time the market perfectly on a single trade exit or entry.
How to Get Started:
Apply the Indicator:
Add the indicator to your TradingView chart. Adjust the input settings (length, oversold/overbought levels, and resolution) as needed for your trading style and the market you’re analyzing.
Watch the Candles:
Observe the dynamic opacity of your candles. A sudden change in opacity can be a sign that the underlying money flow is shifting.
Monitor the Labels:
Pay attention to the “Overbought” or “Oversold” labels that appear. Use these cues in combination with your broader analysis to decide if it might be a good time to add to or gradually exit your position.
Set Up Alerts:
Configure TradingView alerts based on the indicator’s alert conditions so that you are notified when the MFI reaches extreme levels.
Use as Part of a Broader Strategy:
Remember, no single indicator should dictate your entire trading decision. Combine MFI signals with other technical analysis, risk management rules, and market insights to guide your trades.
RVMM IndicatorRVMM Indicator
RVMM Indicator combines four indicators: RSI, VWAP, MFI, and Momentum to provide comprehensive technical analysis. This indicator helps traders identify potential market conditions based on the interaction of these indicators.
Components of the RVMM Indicator
1. RSI (Relative Strength Index)
RSI is a momentum indicator that measures the speed and change of price movements. RSI oscillates between 0 and 100 and is used to identify overbought and oversold conditions in the market.
Buy Level: Set at 30. When RSI falls below 30, the market is considered oversold, which may suggest a potential upward trend reversal.
Sell Level: Set at 70. When RSI rises above 70, the market is considered overbought, which may suggest a potential downward trend reversal.
2. VWAP (Volume Weighted Average Price)
VWAP is an indicator that combines price and volume to calculate the average price weighted by volume. VWAP is used to identify support and resistance areas and assess the strength of price movements.
Interpretation: If the price is above the VWAP line, the market is likely in an uptrend. If the price is below the VWAP line, the market is in a downtrend.
3. MFI (Money Flow Index)
MFI is a momentum indicator that considers both price and volume. MFI oscillates between 0 and 100 and is used to identify overbought and oversold conditions in the market.
Oversold Level: Set at 20. When MFI falls below 20, the market is considered oversold.
Overbought Level: Set at 80. When MFI rises above 80, the market is considered overbought.
4. Momentum
Momentum is an indicator that measures the speed of price changes. This indicator is used to identify the strength of a trend.
Interpretation: High momentum values indicate a strong uptrend, while low momentum values indicate a strong downtrend.
How to Use the RVMM Indicator
Interpreting Market Conditions:
RSI : Check RSI values below 30 to identify oversold conditions, and above 70 to identify overbought conditions.
VWAP : Observe whether the price is above or below the VWAP line to determine if the market is in an uptrend or downtrend.
MFI : Check if MFI is below 20 to identify oversold conditions, and above 80 to identify overbought conditions.
Momentum : Analyze momentum values to gauge the strength of the current trend.
Confirming Market Conditions:
Use VWAP, MFI, and Momentum to confirm market conditions identified by RSI.
If the price is above the VWAP line, and MFI and Momentum indicate the strength of the uptrend, the market may be in a bullish phase.
If the price is below the VWAP line, and MFI and Momentum indicate the strength of the downtrend, the market may be in a bearish phase.
Risk Management:
Set stop-loss and take-profit levels based on technical analysis and your trading preferences.
Monitor the market and adjust stop-loss and take-profit levels as market conditions change.
Example of Application
Here is an example of how to use the RVMM Indicator in practice:
Bullish Phase: When the price is above the VWAP line, RSI is below 30, and MFI and Momentum indicate the strength of the uptrend, the market is likely in a bullish phase.
Bearish Phase: When the price is below the VWAP line, RSI is above 70, and MFI and Momentum indicate the strength of the downtrend, the market is likely in a bearish phase.

Triple CCI Strategy MFI Confirmed [Skyrexio]Overview
Triple CCI Strategy MFI Confirmed leverages 3 different periods Commodity Channel Index (CCI) indicator in conjunction Money Flow Index (MFI) and Exponential Moving Average (EMA) to obtain the high probability setups. Fast period CCI is used for having the high probability to enter in the direction of short term trend, middle and slow period CCI are used for confirmation, if market now likely in the mid and long-term uptrend. MFI is used to confirm trade with the money inflow/outflow with the high probability. EMA is used as an additional trend filter. Moreover, strategy uses exponential moving average (EMA) to trail the price when it reaches the specific level. More information in "Methodology" and "Justification of Methodology" paragraphs. The strategy opens only long trades.
Unique Features
Dynamic stop-loss system: Instead of fixed stop-loss level strategy utilizes average true range (ATR) multiplied by user given number subtracted from the position entry price as a dynamic stop loss level.
Configurable Trading Periods: Users can tailor the strategy to specific market windows, adapting to different market conditions.
Four layers trade filtering system: Strategy utilizes two different period CCI indicators, MFI and EMA indicators to confirm the signals produced by fast period CCI.
Trailing take profit level: After reaching the trailing profit activation level scrip activate the trailing of long trade using EMA. More information in methodology.
Methodology
The strategy opens long trade when the following price met the conditions:
Fast period CCI shall crossover the zero-line.
Slow and Middle period CCI shall be above zero-lines.
Price shall close above the EMA. Crossover is not obligatory
MFI shall be above 50
When long trade is executed, strategy set the stop-loss level at the price ATR multiplied by user-given value below the entry price. This level is recalculated on every next candle close, adjusting to the current market volatility.
At the same time strategy set up the trailing stop validation level. When the price crosses the level equals entry price plus ATR multiplied by user-given value script starts to trail the price with EMA. If price closes below EMA long trade is closed. When the trailing starts, script prints the label “Trailing Activated”.
Strategy settings
In the inputs window user can setup the following strategy settings:
ATR Stop Loss (by default = 1.75)
ATR Trailing Profit Activation Level (by default = 2.25)
CCI Fast Length (by default = 14, used for calculation short term period CCI)
CCI Middle Length (by default = 25, used for calculation short term period CCI)
CCI Slow Length (by default = 50, used for calculation long term period CCI)
MFI Length (by default = 14, used for calculation MFI
EMA Length (by default = 50, period of EMA, used for trend filtering EMA calculation)
Trailing EMA Length (by default = 20)
User can choose the optimal parameters during backtesting on certain price chart.
Justification of Methodology
Before understanding why this particular combination of indicator has been chosen let's briefly explain what is CCI, MFI and EMA.
The Commodity Channel Index (CCI) is a momentum-based technical indicator that measures the deviation of a security's price from its average price over a specific period. It helps traders identify overbought or oversold conditions and potential trend reversals.
The CCI formula is:
CCI = (Typical Price − SMA) / (0.015 × Mean Deviation)
Typical Price (TP): This is calculated as the average of the high, low, and closing prices for the period.
Simple Moving Average (SMA): This is the average of the Typical Prices over a specific number of periods.
Mean Deviation: This is the average of the absolute differences between the Typical Price and the SMA.
The result is a value that typically fluctuates between +100 and -100, though it is not bounded and can go higher or lower depending on the price movement.
The Money Flow Index (MFI) is a technical indicator that measures the strength of money flowing into and out of a security. It combines price and volume data to assess buying and selling pressure and is often used to identify overbought or oversold conditions. The formula for MFI involves several steps:
1. Calculate the Typical Price (TP):
TP = (high + low + close) / 3
2. Calculate the Raw Money Flow (RMF):
Raw Money Flow = TP × Volume
3. Determine Positive and Negative Money Flow:
If the current TP is greater than the previous TP, it's Positive Money Flow.
If the current TP is less than the previous TP, it's Negative Money Flow.
4. Calculate the Money Flow Ratio (MFR):
Money Flow Ratio = Sum of Positive Money Flow (over n periods) / Sum of Negative Money Flow (over n periods)
5. Calculate the Money Flow Index (MFI):
MFI = 100 − (100 / (1 + Money Flow Ratio))
MFI above 80 can be considered as overbought, below 20 - oversold.
The Exponential Moving Average (EMA) is a type of moving average that places greater weight and significance on the most recent data points. It is widely used in technical analysis to smooth price data and identify trends more quickly than the Simple Moving Average (SMA).
Formula:
1. Calculate the multiplier
Multiplier = 2 / (n + 1) , Where n is the number of periods.
2. EMA Calculation
EMA = (Current Price) × Multiplier + (Previous EMA) × (1 − Multiplier)
This strategy leverages Fast period CCI, which shall break the zero line to the upside to say that probability of short term trend change to the upside increased. This zero line crossover shall be confirmed by the Middle and Slow periods CCI Indicators. At the moment of breakout these two CCIs shall be above 0, indicating that there is a high probability that price is in middle and long term uptrend. This approach increases chances to have a long trade setup in the direction of mid-term and long-term trends when the short-term trend starts to reverse to the upside.
Additionally strategy uses MFI to have a greater probability that fast CCI breakout is confirmed by this indicator. We consider the values of MFI above 50 as a higher probability that trend change from downtrend to the uptrend is real. Script opens long trades only if MFI is above 50. As you already know from the MFI description, it incorporates volume in its calculation, therefore we have another one confirmation factor.
Finally, strategy uses EMA an additional trend filter. It allows to open long trades only if price close above EMA (by default 50 period). It increases the probability of taking long trades only in the direction of the trend.
ATR is used to adjust the strategy risk management to the current market volatility. If volatility is low, we don’t need the large stop loss to understand the there is a high probability that we made a mistake opening the trade. User can setup the settings ATR Stop Loss and ATR Trailing Profit Activation Level to realize his own risk to reward preferences, but the unique feature of a strategy is that after reaching trailing profit activation level strategy is trying to follow the trend until it is likely to be finished instead of using fixed risk management settings. It allows sometimes to be involved in the large movements. It’s also important to make a note, that script uses another one EMA (by default = 20 period) as a trailing profit level.
Backtest Results
Operating window: Date range of backtests is 2022.04.01 - 2024.11.25. It is chosen to let the strategy to close all opened positions.
Commission and Slippage: Includes a standard Binance commission of 0.1% and accounts for possible slippage over 5 ticks.
Initial capital: 10000 USDT
Percent of capital used in every trade: 50%
Maximum Single Position Loss: -4.13%
Maximum Single Profit: +19.66%
Net Profit: +5421.21 USDT (+54.21%)
Total Trades: 108 (44.44% win rate)
Profit Factor: 2.006
Maximum Accumulated Loss: 777.40 USDT (-7.77%)
Average Profit per Trade: 50.20 USDT (+0.85%)
Average Trade Duration: 44 hours
These results are obtained with realistic parameters representing trading conditions observed at major exchanges such as Binance and with realistic trading portfolio usage parameters.
How to Use
Add the script to favorites for easy access.
Apply to the desired timeframe and chart (optimal performance observed on 2h BTC/USDT).
Configure settings using the dropdown choice list in the built-in menu.
Set up alerts to automate strategy positions through web hook with the text: {{strategy.order.alert_message}}
Disclaimer:
Educational and informational tool reflecting Skyrex commitment to informed trading. Past performance does not guarantee future results. Test strategies in a simulated environment before live implementation

Bullish/Bearish Reversal Bars Indicator [Skyrexio]Introduction
Bullish/Bearish Reversal Bars Indicator leverages the combination of candlestick reversal bar pattern and the Williams Alligator indicator to help traders in understanding where there is a high probability of market reversal or correction. Indicator works for both bearish and bullish cases. It visualizes the bearish and bullish reversal bars with red and green dots and also plots the Alligator's lips to make it more convenient for traders to understand if price is above or below lips line (more information in "Methodology and it's justification" paragraph).
Features
Market Facilitation Index(MFI) filter: with the specified parameter in settings user can choose to filter bullish and bearish reversal bars which passed the MFI condition.
Awesome Oscillator(AO) filter: with the specified parameter in settings user can choose to filter bullish and bearish reversal bars which passed the AO condition.
Alerts: user can set up the alert and have notifications when bullish/bearish reversal bar has been printed.
Methodology and it's justification
In the script’s methodology, we apply the concepts of bullish and bearish reversal bars introduced by Bill Williams in his book Trading Chaos. So, what exactly is a bullish or bearish reversal bar? At its core, it’s a candlestick pattern. A bullish reversal bar is a bar that closes in its upper half, while a bearish reversal bar closes in its lower half.
Why is this type of bar significant? Let’s look at the bullish reversal bar as an example. When the price is trending upward, forming higher highs with each candle, and we suddenly see a bullish bar that makes a new high but ultimately closes in its lower half, it signals a shift in control. Bears have taken control toward the end of that candle's period, pushing the price back down. This can be interpreted as a sign of trend weakness and a potential reversal (or at least a correction).
An additional key point is that a reversal bar often indicates a possible end to the trend. Therefore, for a reversal bar to be valid, several preceding candles should show lower highs (for bullish bars) or higher lows (for bearish bars), reinforcing the likelihood of a trend change.
The second step on methodology is the location of the bar related to Williams Alligator. The Williams Alligator Indicator, developed by Bill Williams, is a technical analysis tool that helps traders identify trends and potential turning points in the market. It consists of three lines, often called the jaw, teeth, and lips of the alligator, each representing different moving averages:
Jaw (Blue Line): A slower moving average, typically a 13-period smoothed moving average shifted 8 bars into the future.
Teeth (Red Line): A medium moving average, typically an 8-period smoothed moving average shifted 5 bars into the future.
Lips (Green Line): A faster moving average, usually a 5-period smoothed moving average shifted 3 bars into the future.
When the three lines are spread out and moving in the same direction, it suggests a strong trend (the "alligator" is "awake and feeding"). When they intertwine, the indicator suggests that the market is moving sideways, or in a range, signaling a lack of clear trend (the "alligator" is "sleeping"). Traders use the Alligator Indicator to enter trades in trending markets and avoid trades in choppy, non-trending markets.
If bullish reversal bar's high is not below and bearish reversal bar's low is not above all three Alligator's lines (jaw, lips, teeth) they cannot be interpreted as these types of bars. It can be explained as following: if we are waiting for the bullish reversal bar it shall be reversal from downtrend. If price is not below all three lines it can't be interpret as the downtrend according to this method. The opposite is true for the bearish reversal bar.
All described above are obligatory conditions for reversal bar, now let's discuss two not obligatory conditions. The first one is Market Facilitation Index (MFI) restriction. Let's briefly look what is MFI. The Market Facilitation Index (MFI) is a technical indicator that measures the price movement per unit of volume, helping traders gauge the efficiency of price movement in relation to trading volume. Here's how you can calculate it:
MFI = (High−Low)/Volume
MFI can be used in combination with volume, so we can divide 4 states. Bill Williams introduced these to help traders interpret the interaction between volume and price movement. Here’s a quick summary:
Green Window (Increased MFI & Increased Volume): Indicates strong momentum with both price and volume increasing. Often a sign of trend continuation, as both buying and selling interest are rising.
Fake Window (Increased MFI & Decreased Volume): Shows that price is moving but with lower volume, suggesting weak support for the trend. This can signal a potential end of the current trend.
Squat Window (Decreased MFI & Increased Volume): Shows high volume but little price movement, indicating a tug-of-war between buyers and sellers. This often precedes a breakout as the pressure builds.
Fade Window (Decreased MFI & Decreased Volume): Indicates a lack of interest from both buyers and sellers, leading to lower momentum. This typically happens in range-bound markets and may signal consolidation before a new move.
For our purposes we are interested in squat bars. This is the sign that volume cannot move the price easily. This type of bar increases the probability of trend reversal. In this indicator we added to enable the MFI filter of reversal bars. If potential reversal bar or two preceding bars have squat state this bar can be interpret as a reversal one.
The second additional filter is Awesome Oscillator. The Awesome Oscillator (AO), developed by Bill Williams, is a momentum indicator that measures market momentum by comparing recent price action to a longer historical context. It helps traders identify potential trend reversals and the strength of trends. Formula:
AO = SMA5(Median Price) − SMA34(Median Price)
where:
Median Price = (High + Low) / 2
SMA5 = 5-period Simple Moving Average of the Median Price
SMA 34 = 34-period Simple Moving Average of the Median Price
If AO is decreasing momentum is bearish, if increasing - bullish. According to Bill Williams approach reversal bars are the potential trades against the trend. As a result we added second filter for bullish reversal bars AO shall be decreasing, for bearish increasing.
How to use indicator
Apply it to desired chart and time frame. It works on every time frame.
Setup the filters with the "Enable MFI" and "Enable AO" checkboxes in the settings. By default they are turned on.
Analyze the price action. Indicator plotted the white line, this is the lips of an Alligator. It will help you to understand how price is moving in comparison to lips line. Indicator will print the green dot and text "BULL" below it current bar is bullish reversal. It will print the red dot and text "BEAR" above it if current bar is interpreted by algorithm as a bearish reversal.
Set up the alerts if it's needed. Indicator has two custom alerts called "Bullish reversal bar has been printed" and "Bearish reversal bar has been printed"
Disclaimer:
Educational and informational tool reflecting Skyrex commitment to informed trading. Past performance does not guarantee future results. Test indicators before live implementation.

MFI Strategy with Oversold Zone Exit and AveragingThis strategy is based on the Money Flow Index (MFI) and aims to enter a long position when the MFI exits an oversold zone, with specific rules for limit orders, stop-loss, and take-profit settings. Here's a detailed breakdown:
Key Components
1. **Money Flow Index (MFI)**: The strategy uses the MFI, a volume-weighted indicator, to gauge whether the market is in an oversold condition (default threshold of MFI < 20). Once the MFI rises above the oversold threshold, it signals a potential buying opportunity.
2. **Limit Order for Long Entry**: Instead of entering immediately after the oversold condition is cleared, the strategy places a limit order at a price slightly below the current price (by a user-defined percentage). This helps achieve a better entry price.
3. **Stop-Loss and Take-Profit**:
- **Stop-Loss**: A stop-loss is set to protect against significant losses, calculated as a percentage below the entry price.
- **Take-Profit**: A take-profit target is set as a percentage above the entry price to lock in gains.
4. **Order Cancellation**: If the limit order isn’t filled within a specific number of bars (default is 5 bars), it’s automatically canceled to avoid being filled at a potentially suboptimal price as market conditions change.
Strategy Workflow
1. **Identify Oversold Zone**: The strategy checks if the MFI falls below a defined oversold level (default is 20). Once this condition is met, the flag `inOversoldZone` is set to `true`.
2. **Wait for Exit from Oversold Zone**: When the MFI rises back above the oversold level, it’s considered a signal that the market is potentially recovering, and the strategy prepares to enter a position.
3. **Place Limit Order**: Upon exiting the oversold zone, the strategy places a limit order for a long position at a price below the current price, defined by the `Long Entry Percentage` parameter.
4. **Monitor Limit Order**: A counter (`barsSinceEntryOrder`) starts counting the bars since the limit order was placed. If the order isn’t filled within the specified number of bars, it’s canceled automatically.
5. **Set Stop-Loss and Take-Profit**: Once the order is filled, a stop-loss and take-profit are set based on user-defined percentages relative to the entry price.
6. **Exit Strategy**: The trade will close automatically when either the stop-loss or take-profit level is hit.
Advantages
- **Risk Management**: With configurable stop-loss and take-profit, the strategy ensures losses are limited while capturing profits at pre-defined levels.
- **Controlled Entry**: The use of a limit order below the current price helps secure a better entry point, enhancing risk-reward.
- **Oversold Exit Trigger**: Using the exit from an oversold zone as an entry condition can help catch reversals.
Disadvantages
- **Missed Entries**: If the limit order isn’t filled due to insufficient downward movement after the oversold signal, potential opportunities may be missed.
- **Dependency on MFI Sensitivity**: As the MFI is sensitive to both price and volume, its fluctuations might not always accurately represent oversold conditions.
Overall Purpose
The strategy is suited for traders who want to capture potential reversals after oversold conditions in the market, with a focus on precise entries, risk management, and an automated exit plan.

Momentum Nexus Oscillator [UAlgo]The "Momentum Nexus Oscillator " indicator is a comprehensive momentum-based tool designed to provide traders with visual cues on market conditions using multiple oscillators. By combining four popular technical indicators—RSI (Relative Strength Index), VZO (Volume Zone Oscillator), MFI (Money Flow Index), and CCI (Commodity Channel Index)—this heatmap offers a holistic view of the market's momentum.
The indicator plots two lines: one representing the current chart’s combined momentum score and the other representing a higher timeframe’s (HTF) score, if enabled. Through smooth gradient color transitions and easy-to-read signals, the Momentum Nexus Heatmap allows traders to easily identify potential trend reversals or continuation patterns.
Traders can use this tool to detect overbought or oversold conditions, helping them anticipate possible long or short trade opportunities. The option to use a higher timeframe enhances the flexibility of the indicator for longer-term trend analysis.
🔶 Key Features
Multi-Oscillator Approach: Combines four popular momentum oscillators (RSI, VZO, MFI, and CCI) to generate a weighted score, providing a comprehensive picture of market momentum.
Dynamic Color Heatmap: Utilizes a smooth gradient transition between bullish and bearish colors, reflecting market momentum across different thresholds.
Higher Timeframe (HTF) Compatibility: Includes an optional higher timeframe input that displays a separate score line based on the same momentum metrics, allowing for multi-timeframe analysis.
Customizable Parameters: Adjustable RSI, VZO, MFI, and CCI lengths, as well as overbought and oversold levels, to match the trader’s strategy or preference.
Signal Alerts: Built-in alert conditions for both the current chart and higher timeframe scores, notifying traders when long or short entry signals are triggered.
Buy/Sell Signals: Displays visual signals (▲ and ▼) on the chart when combined scores reach overbought or oversold levels, providing clear entry cues.
User-Friendly Visualization: The heatmap is separated into four sections representing each indicator, providing a transparent view of how each contributes to the overall momentum score.
🔶 Interpreting Indicator:
Combined Score
The indicator generates a combined score by weighing the individual contributions of RSI, VZO, MFI, and CCI. This score ranges from 0 to 100 and is plotted as a line on the chart. Lower values suggest potential oversold conditions, while higher values indicate overbought conditions.
Color Heatmap
The indicator divides the combined score into four distinct sections, each representing one of the underlying momentum oscillators (RSI, VZO, MFI, and CCI). Bullish (greenish) colors indicate upward momentum, while bearish (grayish) colors suggest downward momentum.
Long/Short Signals
When the combined score drops below the oversold threshold (default is 26), a long signal (▲) is displayed on the chart, indicating a potential buying opportunity.
When the combined score exceeds the overbought threshold (default is 74), a short signal (▼) is shown, signaling a potential sell or short opportunity.
Higher Timeframe Analysis
If enabled, the indicator also plots a line representing the combined score for a higher timeframe. This can be used to align lower timeframe trades with the broader trend of a higher timeframe, providing added confirmation.
Signals for long and short entries are also plotted for the higher timeframe when its combined score reaches overbought or oversold levels.
🔶Purpose of Using Multiple Technical Indicators
The combination of RSI, VZO, MFI, and CCI in the Momentum Nexus Heatmap provides a comprehensive approach to analyzing market momentum by leveraging the unique strengths of each indicator. This multi-indicator method minimizes the limitations of using just one tool, resulting in more reliable signals and a clearer understanding of market conditions.
RSI (Relative Strength Index)
RSI contributes by measuring the strength and speed of recent price movements. It helps identify overbought or oversold levels, signaling potential trend reversals or corrections. Its simplicity and effectiveness make it one of the most widely used indicators in technical analysis, contributing to momentum assessment in a straightforward manner.
VZO (Volume Zone Oscillator)
VZO adds the critical element of volume to the analysis. By assessing whether price movements are supported by significant volume, VZO distinguishes between price changes that are driven by real market conviction and those that might be short-lived. It helps validate the strength of a trend or alert the trader to potential weakness when price moves are unsupported by volume.
MFI (Money Flow Index)
MFI enhances the analysis by combining price and volume to gauge money flow into and out of an asset. This indicator provides insight into the participation of large players in the market, showing if money is pouring into or exiting the asset. MFI acts as a volume-weighted version of RSI, giving more weight to volume shifts and helping traders understand the sustainability of price trends.
CCI (Commodity Channel Index)
CCI contributes by measuring how far the price deviates from its statistical average. This helps in identifying extreme conditions where the market might be overextended in either direction. CCI is especially useful for spotting trend reversals or continuations, particularly during market extremes, and for identifying divergence signals.
🔶 Disclaimer
Use with Caution: This indicator is provided for educational and informational purposes only and should not be considered as financial advice. Users should exercise caution and perform their own analysis before making trading decisions based on the indicator's signals.
Not Financial Advice: The information provided by this indicator does not constitute financial advice, and the creator (UAlgo) shall not be held responsible for any trading losses incurred as a result of using this indicator.
Backtesting Recommended: Traders are encouraged to backtest the indicator thoroughly on historical data before using it in live trading to assess its performance and suitability for their trading strategies.
Risk Management: Trading involves inherent risks, and users should implement proper risk management strategies, including but not limited to stop-loss orders and position sizing, to mitigate potential losses.
No Guarantees: The accuracy and reliability of the indicator's signals cannot be guaranteed, as they are based on historical price data and past performance may not be indicative of future results.

SMI Ergodic Indicator/Oscillator of Money Flow Index▮ Introduction
The Stochastic Momentum Index Ergodic (SMII) indicator is a technical analysis tool designed to predict trend reversals in the price of an asset.
It functions as a momentum oscillator, measuring the ratio of the smoothed price change to the smoothed absolute price change over a given number of previous periods.
The Ergodic SMI is based on the True Strength Index (TSI) and integrates a signal line, which is an exponential moving average (EMA) of the SMI indicator itself.
The Ergodic SMI oscillator provides a clearer picture of market trends than the traditional stochastic oscillator by incorporating the concept of 'ergodicity', which helps remove market noise.
On ther other hand, MFI (Money Flow Index) is a technical analysis indicator used to measure the inflow of money into an asset and thus help identify buying and selling pressure in a given financial instrument.
When these two indicators are combined, they can provide a more comprehensive view of price direction and market strength.
▮ Motivation: why another indicator?
By combining SMII with MFI, we can gain even more insights into the market.
One way to do this is to use the MFI as an input to the SMII, rather than just using price.
This means we are measuring momentum based on buying and selling pressure rather than just price.
Furthermore, there is the possibility of making several fine adjustments to both the calculation and visualization parameters that are not present in other indicators.
▮ What to look for
When using the SMII MFI indicator, there are a few things to look out for.
First, look at the SMII signal line.
When the line crosses above -40, it is considered a buy signal, while the crossing below +40 is considered a sell signal.
Also, pay attention to divergences between the SMII and the price.
If price is rising but the SMII is showing negative divergence, it could indicate that momentum is waning and a reversal could be in the offing.
Likewise, if price is falling but the SMII is showing positive divergence, this could indicate that momentum is building and a reversal could also be in the offing.
Divergences can be considered in both indicator and/or histogram.
Examples:
▮ Notes
The indicator presented here offers both the 'SMII' and the 'SMIO', that is, the 'Stochastic Momentum Index Ergodic Indicator' together with the 'Stochastic Momentum Index Ergodic Oscillator' (histogram), as per the documentation described in reference links.
So it is important to highlight the differences in relation to my other indicator, the 'Stochastic Momentum Index (SMI) of Money Flow Index (MFI)':
This last one is purely based on the SMI , which is implemented using SMA smoothing for the relative range and the high/low range.
Although they may seem the same in some situations, the calculation is actually different. The TSI tends to be more responsive at the expense of being noisier, while the SMI tends to be smoother. Which of these two indicators is best depends on the situation, the context, and the analyst's personal preference.
Please refer to reference links to more info.
▮ References
SMI documentation
SMII documentation
SMIO documentation
MFI documentation
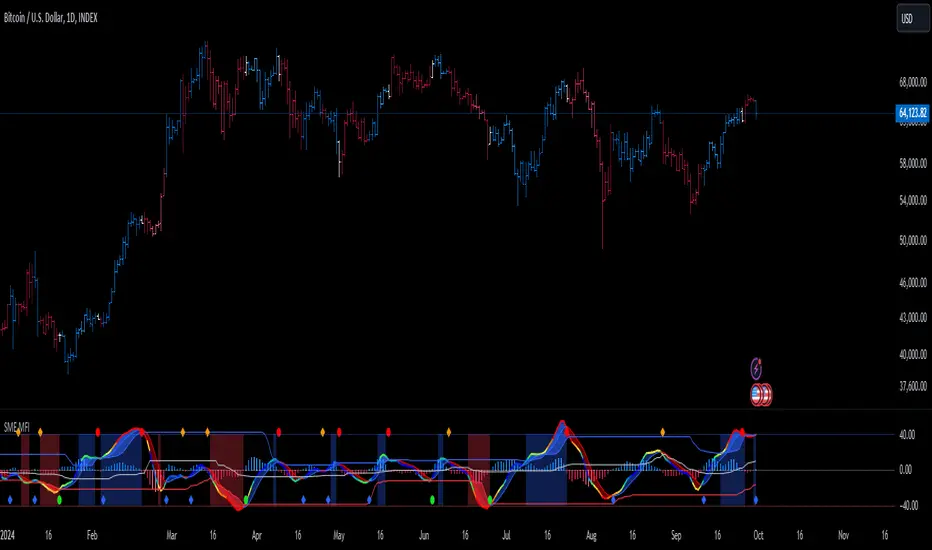
Money Flow Index Trend Zone Strength [UAlgo]The "Money Flow Index Trend Zone Strength " indicator is designed to analyze and visualize the strength of market trends and OB/OS zones using the Money Flow Index (MFI). The MFI is a momentum indicator that incorporates both price and volume data, providing insights into the buying and selling pressure in the market. This script enhances the traditional MFI by introducing trend and zone strength analysis, helping traders identify potential trend reversals and continuation points.
🔶 Customizable Settings
Amplitude: Defines the range for the MFI Zone Strength calculation.
Wavelength: Period used for the MFI calculation and Stochastic calculations.
Smoothing Factor: Smoothing period for the Stochastic calculations.
Show Zone Strength: Enables/disables visualization of the MFI Zone Strength line.
Show Trend Strength: Enables/disables visualization of the MFI Trend Strength area.
Trend Strength Signal Length: Period used for the final smoothing of the Trend Strength indicator.
Trend Anchor: Selects the anchor point (0 or 50) for the Trend Strength Stochastic calculation.
Trend Transform MA Length: Moving Average length for the Trend Transform calculation.
🔶 Calculations
Zone Strength (Stochastic MFI):
The highest and lowest MFI values over a specified amplitude are used to normalize the MFI value:
MFI Highest: Highest MFI value over the amplitude period.
MFI Lowest: Lowest MFI value over the amplitude period.
MFI Zone Strength: (MFI Value - MFI Lowest) / (MFI Highest - MFI Lowest)
By normalizing and smoothing the MFI values, we aim to highlight the relative strength of different market zones.
Trend Strength:
The smoothed MFI zone strength values are further processed to calculate the trend strength:
EMA of MFI Zone Strength: Exponential Moving Average of the MFI Zone Strength over the wavelength period.
Stochastic of EMA: Stochastic calculation of the EMA values, smoothed with the same smoothing factor.
Purpose: The trend strength calculation provides insights into the underlying market trends. By using EMA and stochastic functions, we can filter out noise and better understand the overall market direction. This helps traders stay aligned with the prevailing trend and make more informed trading decisions.
🔶 Usage
Interpreting Zone Strength: The zone strength plot helps identify overbought and oversold conditions. A higher zone strength indicates potential overbought conditions, while a lower zone strength suggests oversold conditions, can suggest areas for entry/exit decisions.
Interpreting Trend Strength: The trend strength plot visualizes the underlying market trend, can help signal potential trend continuation or reversal based on the chosen anchor point.
Using the Trend Transform: The trend transform plot provides an additional layer of trend analysis, helping traders identify potential trend reversals and continuation points.
Combine the insights from the zone strength and trend strength plots with other technical analysis tools to make informed trading decisions. Look for confluence between different indicators to increase the reliability of your trades.
🔶 Disclaimer:
Use with Caution: This indicator is provided for educational and informational purposes only and should not be considered as financial advice. Users should exercise caution and perform their own analysis before making trading decisions based on the indicator's signals.
Not Financial Advice: The information provided by this indicator does not constitute financial advice, and the creator (UAlgo) shall not be held responsible for any trading losses incurred as a result of using this indicator.
Backtesting Recommended: Traders are encouraged to backtest the indicator thoroughly on historical data before using it in live trading to assess its performance and suitability for their trading strategies.
Risk Management: Trading involves inherent risks, and users should implement proper risk management strategies, including but not limited to stop-loss orders and position sizing, to mitigate potential losses.
No Guarantees: The accuracy and reliability of the indicator's signals cannot be guaranteed, as they are based on historical price data and past performance may not be indicative of future results.

Fusion MFI RSIHello fellas,
This superb indicator summons two monsters called Relative Strength Index (RSI) and Money Flow Index (MFI) and plays the Yu-Gi-Oh! card "Polymerization" to combine them.
Overview
The Fusion MFI RSI Indicator is an advanced analytical tool designed to provide a nuanced understanding of market dynamics by combining the Relative Strength Index (RSI) and the Money Flow Index (MFI). Enhanced with sophisticated smoothing techniques and the Inverse Fisher Transform (IFT), this indicator excels in identifying key market conditions such as overbought and oversold states, trends, and potential reversal points.
Key Features (Brief Overview)
Fusion of RSI and MFI: Integrates momentum and volume for a comprehensive market analysis.
Advanced Smoothing Techniques: Employs Hann Window, Jurik Moving Average (JMA), T3 Smoothing, and Super Smoother to refine signals.
Inverse Fisher Transform (IFT) Enhances the clarity and distinctiveness of indicator outputs.
Detailed Feature Analysis
Fusion of RSI and MFI
RSI (Relative Strength Index): Developed by J. Welles Wilder Jr., the RSI measures the speed and magnitude of directional price movements. Wilder recommended using a 14-day period and identified overbought conditions above 70 and oversold conditions below 30.
MFI (Money Flow Index): Created by Gene Quong and Avrum Soudack, the MFI combines price and volume to measure trading pressure. It is typically calculated using a 14-day period, with over 80 considered overbought and under 20 as oversold.
Application in Fusion: By combining RSI and MFI, the indicator leverages RSI's sensitivity to price changes with MFI's volume-weighted confirmation, providing a robust analysis tool. This combination is particularly effective in confirming the strength behind price movements, making the signals more reliable.
Advanced Smoothing Techniques
Hann Window: Traditionally used to reduce the abrupt data discontinuities at the edges of a sample, it is applied here to smooth the price data.
Jurik Moving Average (JMA): Known for preserving the timing and smoothness of the data, JMA reduces market noise effectively without significant lag.
T3 Smoothing: Developed to respond quickly to market changes, T3 provides a smoother response to price fluctuations.
Super Smoother: Filters out high-frequency noise while retaining important trends.
Application in Fusion: These techniques are chosen to refine the output of the combined RSI and MFI values, ensuring the indicator remains responsive yet stable, providing clearer and more actionable signals.
Inverse Fisher Transform (IFT):
Developed by John Ehlers, the IFT transforms oscillator outputs to enhance the clarity of extreme values. This is particularly useful in this fusion indicator to make critical turning points more distinct and actionable.
Mathematical Calculations for the Fusion MFI RSI Indicator
RSI (Relative Strength Index)
The RSI is calculated using the following steps:
Average Gain and Average Loss: First, determine the average gain and average loss over the specified period (typically 14 days). This is done by summing all the gains and losses over the period and then dividing each by the period.
Average Gain = (Sum of Gains over the past 14 periods) / 14
Average Loss = (Sum of Losses over the past 14 periods) / 14
Relative Strength (RS): This is the ratio of average gain to average loss.
RS = Average Gain / Average Loss
RSI: Finally, the RSI is calculated using the RS value:
RSI = 100 - (100 / (1 + RS))
MFI (Money Flow Index)
The MFI is calculated using several steps that incorporate both price and volume:
Typical Price: Calculate the typical price for each period.
Typical Price = (High + Low + Close) / 3
Raw Money Flow: Multiply the typical price by the volume for the period.
Raw Money Flow = Typical Price * Volume
Positive and Negative Money Flow: Compare the typical price of the current period to the previous period to determine if the money flow is positive or negative.
If today's Typical Price > Yesterday's Typical Price, then Positive Money Flow = Raw Money Flow; Negative Money Flow = 0
If today's Typical Price < Yesterday's Typical Price, then Negative Money Flow = Raw Money Flow; Positive Money Flow = 0
Money Flow Ratio: Calculate the ratio of the sum of Positive Money Flows to the sum of Negative Money Flows over the past 14 periods.
Money Flow Ratio = (Sum of Positive Money Flows over 14 periods) / (Sum of Negative Money Flows over 14 periods)
MFI: Finally, calculate the MFI using the Money Flow Ratio.
MFI = 100 - (100 / (1 + Money Flow Ratio))
Fusion of RSI and MFI
The final Fusion MFI RSI value could be calculated by averaging the IFT-transformed values of RSI and MFI, providing a single oscillator value that reflects both momentum and volume-weighted price action:
Fusion MFI RSI = (MFI weight * MFI) + (RSI weight * RSI)
Suggested Settings and Trading Rules
Original Usage
RSI: Wilder suggested buying when the RSI moves above 30 from below (enter long) and selling when the RSI moves below 70 from above (enter short). He recommended exiting long positions when the RSI reaches 70 or higher and exiting short positions when the RSI falls below 30.
MFI: Quong and Soudack recommended buying when the MFI is below 20 and starts rising (enter long), and selling when it is above 80 and starts declining (enter short). They suggested exiting long positions when the MFI reaches 80 or higher and exiting short positions when the MFI falls below 20.
Fusion Application
Settings: Use a 14-day period for this indicator's calculations to maintain consistency with the original settings suggested by the inventors.
Trading Rules:
Enter Long Signal: Consider entering a long position when both RSI and MFI are below their respective oversold levels and begin to rise. This indicates strong buying pressure supported by both price momentum and volume.
Exit Long Signal: Exit the long position when either RSI or MFI reaches its respective overbought threshold, suggesting a potential reversal or decrease in buying pressure.
Enter Short Signal: Consider entering a short position when both indicators are above their respective overbought levels and begin to decline, suggesting that selling pressure is mounting.
Exit Short Signal: Exit the short position when either RSI or MFI falls below its respective oversold threshold, indicating diminishing selling pressure and a potential upward reversal.
How to Use the Indicator
Select Source and Timeframe: Choose the data source and the timeframe for analysis.
Configure Fusion Settings: Adjust the weights for RSI and MFI.
Choose Smoothing Technique: Select and configure the desired smoothing method to suit the market conditions and personal preference.
Enable Fisherization: Optionally apply the Inverse Fisher Transform to enhance signal clarity.
Customize Visualization: Set up gradient coloring, background plots, and bands according to your preferences.
Interpret the Indicator: Use the Fusion value and visual cues to identify market conditions and potential trading opportunities.
Conclusion
The Fusion MFI RSI Indicator integrates classical and modern technical analysis concepts to provide a comprehensive tool for market analysis. By combining RSI and MFI with advanced smoothing techniques and the Inverse Fisher Transform, this indicator offers enhanced insights, aiding traders in making more informed and timely trading decisions. Customize the settings to align with your trading strategy and leverage this powerful tool to navigate financial markets effectively.
Best regards,
simwai
---
Credits to:
@loxx – T3
@everget – JMA
@cheatcountry – Hann Window
