INVITE-ONLY SCRIPT
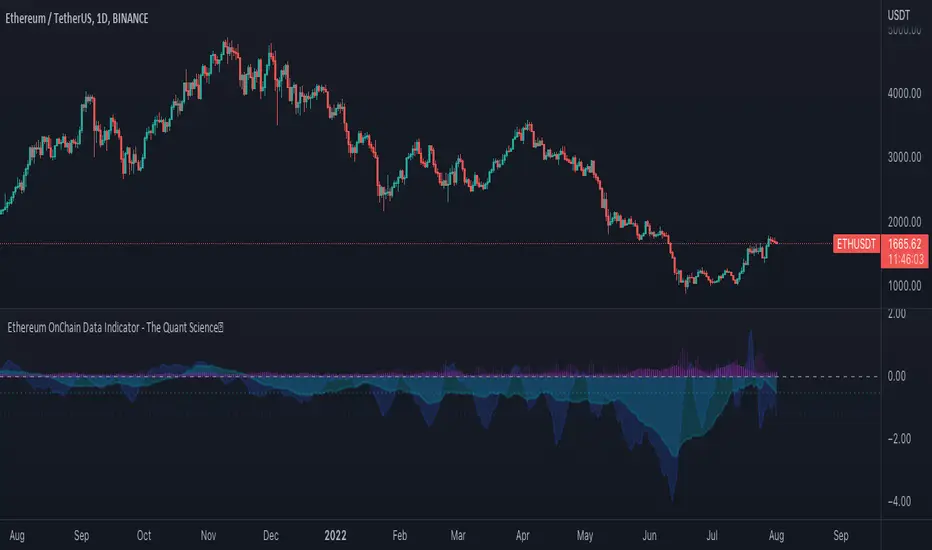
Ethereum OnChain Data Indicator - The Quant Science
Ethereum On Chain Data Indicator - The Quant Science™ is a quantitative indicator created for mid-long term analysis.
The indicator uses quantitative statistics to recreate a model that represents the most important data from the on-chain analysis for the Ethereum blockchain.
The on-chain data used to create this model are:
1. Total weekly transactions
2. Total monthly transactions
3. Frequency of transactions per second on a daily scale
4. Frequency of transactions per second on a weekly scale
5. Amount of Ethereum burned on a daily scale
6. Amount of Ethereum burned on a weekly scale
7. Volume of short positions on a daily scale
8. Volume of short positions on a weekly scale
9. Volume of short positions more/less than average on a daily scale
10. Volume of short positions more/less than average on a weekly scale
All these data were extrapolated and manipulated using the mean and standard deviation.
The end result is a powerful tool that enables mid-long term investors and traders to analyze on-chain data through quantitative analysis.
FEATURES
The blue color area refers to the average change in data on a weekly scale. The light blue colored area indicates the monthly changes in the data. It is interesting to observe the correlation relationship between price and times when short-run data increases compared to long-run data and vice versa.
The more intense purple histograms refer to the standard deviation of the mean change in data on an annual scale. Histograms of less intense purple color refer to the standard deviation of the mean variation of data on a monthly scale. It is interesting to observe the ratio of the standard deviation between two different time periods.
This indicator can be used to perform statistical comparative analysis for manual and mid-long term investments. It can also be used to create auto trading strategies when used and integrated within an algorithm.
On-chain data are updated every 24 hours, so the timeframes to be used for analysis with this indicator are: D, 4H, 1H.
Скрипт с ограниченным доступом
Доступ к этому скрипту разрешён только для пользователей, авторизованных автором, и для этого обычно требуется оплата. Вы можете добавить скрипт в список избранных, но использовать его можно будет только после запроса на доступ и получения разрешения от автора. Свяжитесь с thequantscience, чтобы узнать больше, или следуйте инструкциям автора ниже.
TradingView не советует платить за скрипт и использовать его, если вы на 100% не доверяете его автору и не понимаете, как он работает. Часто вы можете найти хорошую альтернативу с открытым исходным кодом бесплатно в нашем разделе Скрипты сообщества.
Инструкции от автора
″You can unlock this indicator from our website. For any information or questions about this script contact us on Trading View private chat.
Хотите использовать этот скрипт на графике?
Внимание: прочтите это перед тем, как запросить доступ.
🔥Development Service: it.fiverr.com/thequantscience
Отказ от ответственности
Все виды контента, которые вы можете увидеть на TradingView, не являются финансовыми, инвестиционными, торговыми или любыми другими рекомендациями. Мы не предоставляем советы по покупке и продаже активов. Подробнее — в Условиях использования TradingView.