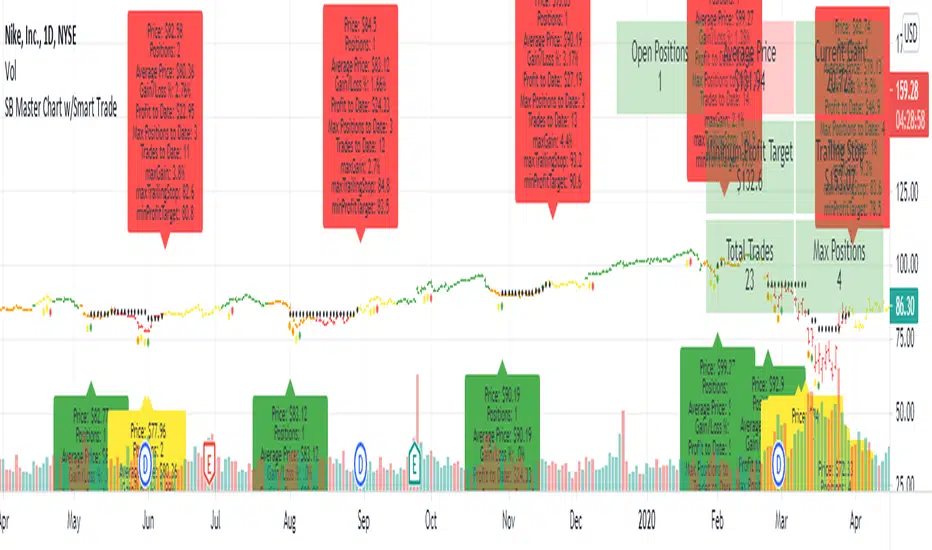
SB Master Chart w/Smart Trade
SB Master Chart was created to be a simple chart that can be easily interpreted.
The prior version of SB Master Chart added additional multi time frame alerts, alerting to oversold/overbought and high volume on 5 time periods (30m,1h, 2h, 4h, and 1d).
V4 of SB Master Chart is NOT going away. It is not being REPLACED!... This is a separate script based on the same algorithm, but is significantly different enough to warrant its own script. Please review SB Master Chart v4 for more details about the algo.
This version of SB Master Chart w/Smart Trade has additional money management parameters to help you dollar cost average in and out of a trade.
It follows the following rules
Oversold with no positions - Buy and establish a cost basis.
Oversold with positions - Only buy if below cost basis and dca percentage set in options.
Sell - Only sell if above minimum take profit and crossbelow trailing stop loss.
The script assumes you are buying and selling in lots of 1 so cost basis and positions are based on that calculation. There is a position/profit/loss table at the top of the chart.
If you don't like making trading decisions based on SB Master Chart v4, this is the chart for you, it will tell you exactly when to buy and when to sell based on the options you set. When you created the alert.
Options available
- Take Profit % - This lets you specify the minimum take profit you want to sell for.
- Trailing Stop % - This is not your typical trailing stop. This trailing stop is a percentage of the maximum gain. If your stock went up 100% and you set it to 75%, it will stop loss you out at 75% gain based on your cost basis/open trades
- DCA % - This will only open a trade if you are below your cost basis by DCA% and there is a buy signal.
- Start Year/End Year - This will allow the graph to start displaying information from the date forward. This is useful for determining Max Positions so you can calculate how much exposure each positions should have.
- Disable Trade History - This will disable the labels.
Скрипт с ограниченным доступом
Только пользователи, одобренные автором, могут получить доступ к этому скрипту. Вам нужно отправить запрос и получить разрешение на его использование. Обычно доступ предоставляется после оплаты. Для получения подробной информации следуйте инструкциям автора ниже или свяжитесь с StuBuzzzini напрямую.
TradingView НЕ рекомендует платить за скрипт или использовать его, если вы не доверяете его автору и не понимаете, как скрипт работает. Вы всегда можете найти бесплатные скрипты с открытым исходным кодом в Скриптах сообщества.
Инструкции от автора
Отказ от ответственности
Скрипт с ограниченным доступом
Только пользователи, одобренные автором, могут получить доступ к этому скрипту. Вам нужно отправить запрос и получить разрешение на его использование. Обычно доступ предоставляется после оплаты. Для получения подробной информации следуйте инструкциям автора ниже или свяжитесь с StuBuzzzini напрямую.
TradingView НЕ рекомендует платить за скрипт или использовать его, если вы не доверяете его автору и не понимаете, как скрипт работает. Вы всегда можете найти бесплатные скрипты с открытым исходным кодом в Скриптах сообщества.