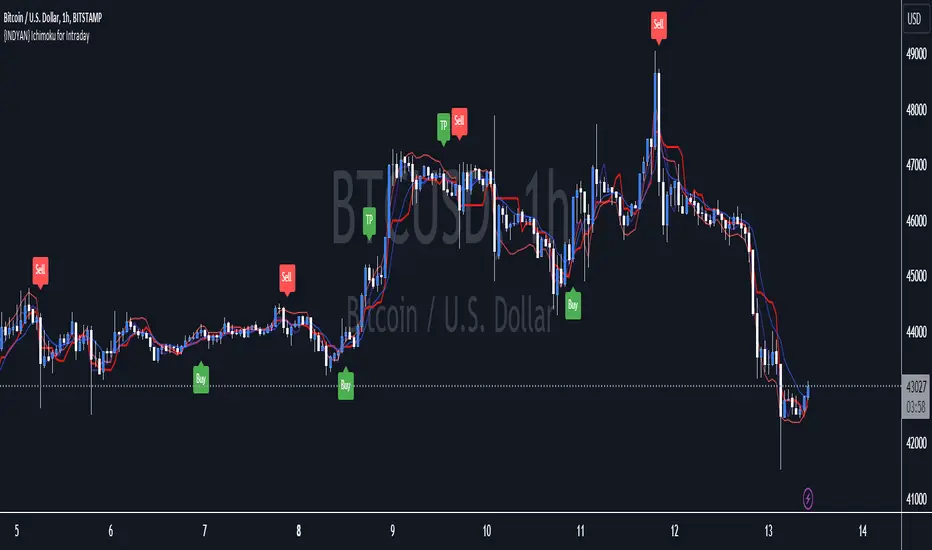
{INDYAN} Ichimoku for IntradayIts based on ichimoku, i removed cloud and mod some changes for better use in intraday trading. It can be used in stocks and index as well.Not tested on MCX and Forex.
Just watch at crossover of tenkan and kijun that RSI macd is above 60 and zero or not? If all three parameters meet go for long... exit when again another cross happen or rsi go below 40.for sell side watch for rsi below 40 and macd below zero line while crossover of kijun tenkan.
Better to use it with RSI+Macd Fast to get more accurate results.
#for better confirmation look value of VWAP and decide accordingly
Do back test before using it.
Happy Trading
Love INDyAN
#change line color as per ur wish but value should be same as it was default entered.
Alert
Alert Intervals and Delays Framework [BigBitsIO]Simply explained, this script, when modified to each specific use case, can allow you to specify that alert conditions are only checked every X seconds (AKA Intervals - as fast as every single second) and that alerts can not occur quicker than the user-specified delay (in seconds)
Explained:
- This will work on any resolution, but for the best results/fastest alerts a premium plan with 1s resolution will work best.
- Be mindful of which alert option you choose when setting up corresponding alerts. On 1s resolution with alerts once per bar you can get alerts up to every second.
- The scan for alerts every X seconds will be when the script can scan, by default every 5th second. If you want it to scan on any and all updates, set it to 1 for 1 second
- The delay between alerts will just require than that many seconds have passed since the last alert was fired (whether it was an actual alert in TradingView or just as recognized by this script)
- To have a custom alert condition met, do your normal indicator logic and check your conditions during the scanning period after the delay has been met, as marked by comments in the code
FAQ
- Why is this script useful?
- Many people do not want to constantly monitor for alerts, and may only want alerts to trigger at certain times, or after certain periods of time
- What is an example?
- You want a 1min resolution RSI alert, but you don't want to see it every minute, or only once.
- By setting your alert to once per bar, or once per minute on a 1min or less resolution chart you can get alerts only every 2min 30sec for example when setting your delay to 150 (seconds)
Warning: Since the scan time and alert times on larger resolutions can not be accessed from previous candles when first added to the chart it should be pretty important that you operate on a chart with a smaller resolution than your delay.

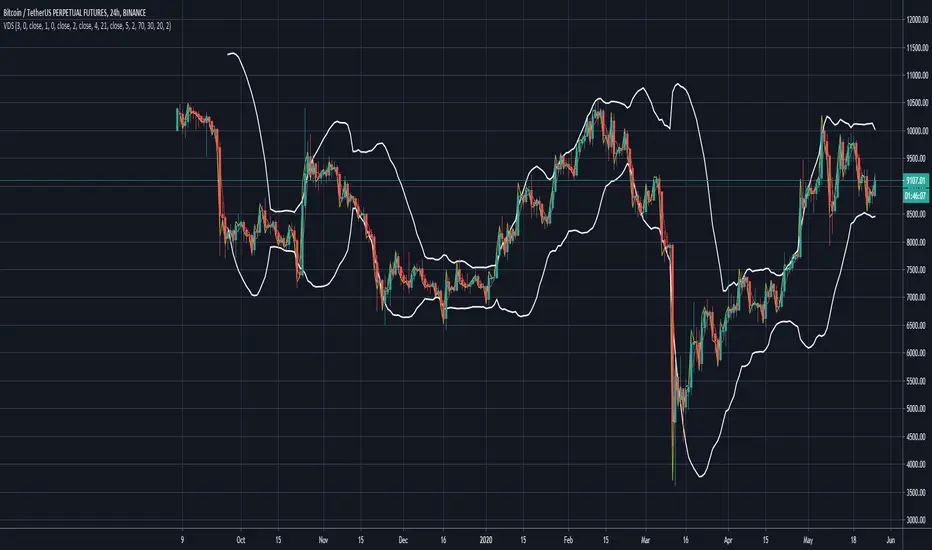
Vendredi's Daily SmashSpecial Thanks to Vendredi for helping me tweak and improve this indicator. It is now fully functional in TV to open both Long or Short Positions.
THIS INDICATOR WILL NOT WORK WITH DEFAULT C1, BASELINE, AND EXIT CONFIG. Think of it as a learning lesson. Put in a little effort to find proper config to use them :-D.
Long Entry Criteria
- Price must close above C1 indicator
- Price must remain above the C1 indicator in the current candle and be heading above the previous candle close
- Price must do the same as the two points above for the BASELINE indicator
- C2OPEN indicator criteria must be met for both the current candle and the previous closed candle (just like C1 indicator)
- Price must not be actively exceeding the upper bollinger band
- RSI must be above 70
- Closed candles are not limited to, but should absolutely apply to, C1, C2OPEN, and BASELINE
Short Entry Criteria
- Price must close below C1 indicator
- Price must remain below the C1 indicator in the current candle and be heading below the previous candle close
- Price must do the same as the two points above for the BASELINE indicator
- C2OPEN indicator criteria must be met for both the current candle and the previous closed candle (just like C1 indicator)
- Price must not be actively exceeding the upper bollinger band
- RSI must be below 30
- Closed candles are not limited to, but should absolutely apply to, C1, C2OPEN, V1 and BASELINE
Alert Config
- Select the Indicator and Select the VDS Buy or VDS Sell for Long or Short
The rest is up to you.
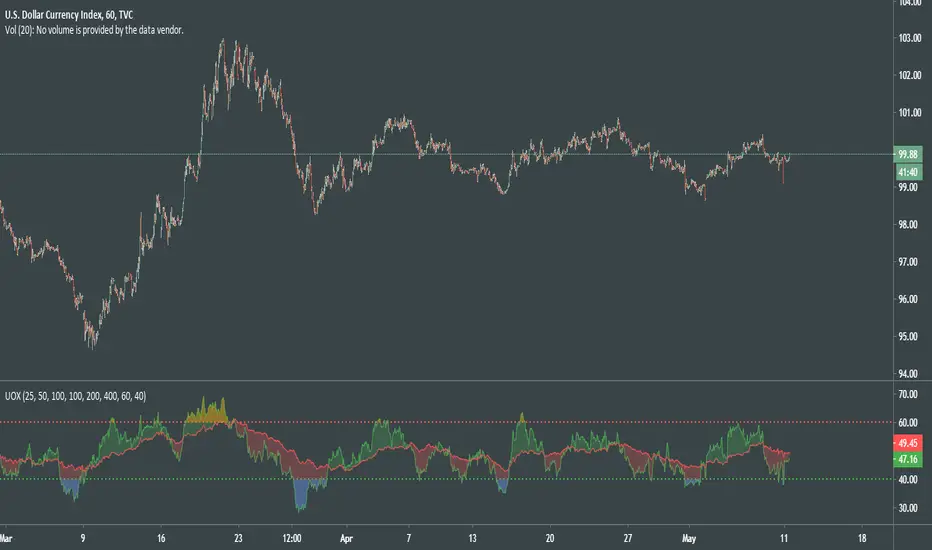
UO CrossThis particular UO Cross is evolved into far more flexible and visually intuitive oscillator than previous versions.
After thorough experiments with the code of indicator, I came to new deductions on how to use it properly for random TF and made it simpler.
How to read a chart using UOX:
Before uptrend takes place, we see the both indicator levels moving towards green dotted line (40).
When green UO index passes below 40, it's an alert that the market is about to interact to new demand levels, coloring it blue for a potential reversal.
Once green UO index is moving up and crossing above green dotted line - the second signal of uptrend established.
Another strong sign of uptrend is when green UO index passes above red UO index, coloring the space in between 2 indicators greenish.
At this point of time, we can be more confident that the general movement of the price is headed upwards, although we might see some small corrections there.
During uptrend Green UO index will fluctuate above red UO index.
Both indices will rise, getting closer and closer to red dotted line, which psychologically would be the first signs of the reversal of the uptrend.
When you see green UO index passing above red dotted line 60, coloring orangish, that's a serious alert for upcoming reversal.
I'll once more remind you that at this point of time both UO indices are at overbought levels, def above 50.
You know the situation is serious when you witness red UO index being very close to red dotted line!
To confirm the signals for downtrend, you must see green UO index go down and passing below red dotted line.
Second confirmation of downtrend is when green UO index crosses below red UO index, and colors the space in between indices red.
With this indicator we can understand:
Condition of the market
Early signs and alerts for reversal
Signals of entry
Confirmations of those signals
Visualized mass psychology behind domination of bulls / bears
It would be much better if you combine it with volume-based indicators.
Good luck!
Ema Cross, 10 /21 / 55Ema Cross tool using Ema 10 / Ema 21 / Ema 55
I have found these settings very useful for catching breakouts on Alt coins.
Alerts Added,
Breakout = Ema 10 crossing above Ema 21
Breakdown = Ema 10 crossing under Ema 21
Ema 55 added as a useful area to catch dips when price is trending

WaveTrend Oscillator w/ Short/Long/Close Alerts - WIPHigh TFs work best, but it works on any TF. I plan to continue releasing updates to it to improve overall form and function. Green Circles are Long Alerts, Red Circles are Short Alerts. Blue and Yellow Circles are Close Position Alerts. First Blue Circle After Red Circle would be Short Exit. First Yellow Circle After Green Circle would be Long Exit.
Original script was based on Lazybear Indicator-WaveTrend-Oscillator-WT Script. I have added and modified some code to my personal liking.

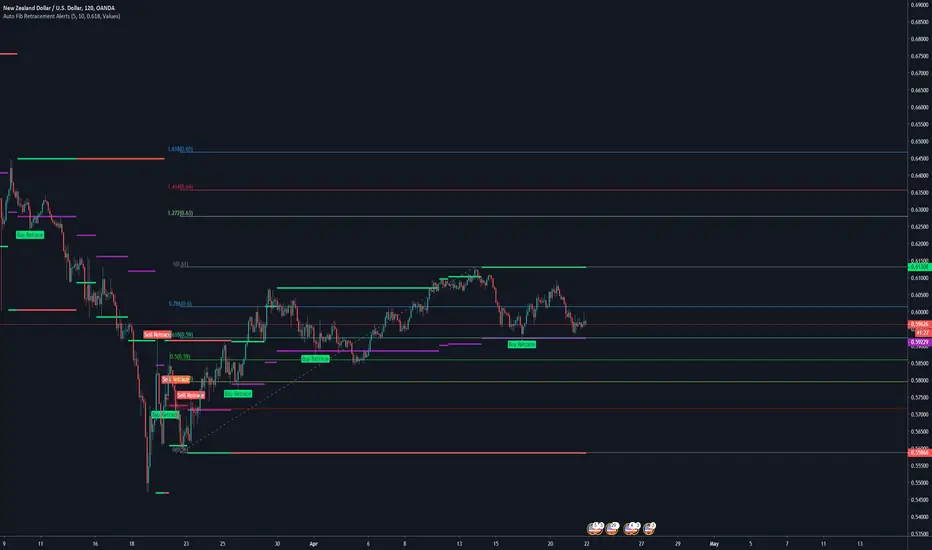
Auto Fib Retracement AlertsFor the fibonacci traders.
The Auto Fib Retracement Is a good indicator for tradingview to show you the current alerts and points to watch in the market
IMPORTANT SETTING => Retracement
This controls your alert levels
I have modified it to deliver the following
+Custom Fib retracement level alerts
+Drawing of old levels and retracement levels
+Backtesting Old Alerts
There are two shapes drawn on the chart;
Shown When the fib end is attained and market retraces back to your level
1. Buy retracement -
2. Sell retracement
How are they detected?
When we have new levels in the market; this is when the red or gree line changes, we calculate the new fib level that we will be watching for retracement
This is the purple level drawn on the chart
When the market first crosses below or above this level, The alert will be fired.
Consequent crosses are not updated
Enjoy! 😍
Originally requested by trade atechproduction
Support Resistance - DynamicThis is Dynamic Support / Resistance script.
How it Works?
It finds Pivot Points and creates channels for each Pivot Point. Channel size is calculated by (Highest - Lowest) * %Channel_size in Loopback Period. After creating channels it calculates that how many Pivot Points in the channels. more Pivot Points in channel means stronger Support/Resistance. in the option menu there is S/R Strength, this is the minimum number of Pivot Points that each channel must contain to be S/R. calculation starts from last pivot point and go back for "loopback period" which is 300 by default. so last Pivot Points have more priority. Finally after calculating Support/Resistance it draws lines.
Number of Support/Resistance line is Dynamic and up to 20 lines, that means number of lines changes dynamically. you can see how the script puts Suppport/Resistance lines dynamically by "Replay" button. (if I have time I will try to put a video)
Currently the scripts checks up to 40 pivot points in loopback period. it shows up to 20 S/Rs only for visible area in the chart.
There is option to Show S/R lines as Solid, Dotted or Dashed.
Enjoy!

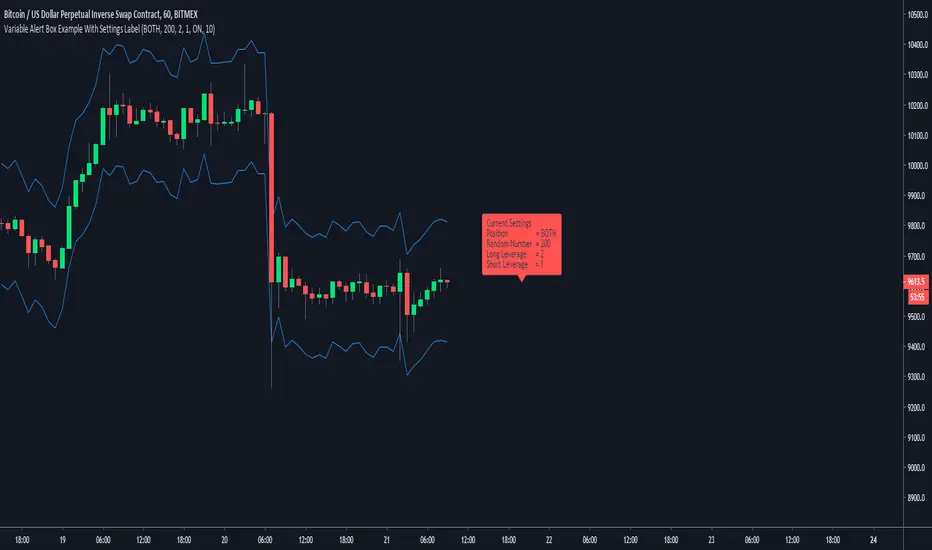
Variable Alert Box Examplejust publishing to share to novice pine coders like myself
any feedback on layout/structure/shortcuts will always be appreciated, not that this is a long script with much that can go wrong
short little what ever to show variable alert message
needs to draw the number from a plotted number like line 18 and 19, and cant be gettin the numbers from line 14 and 16
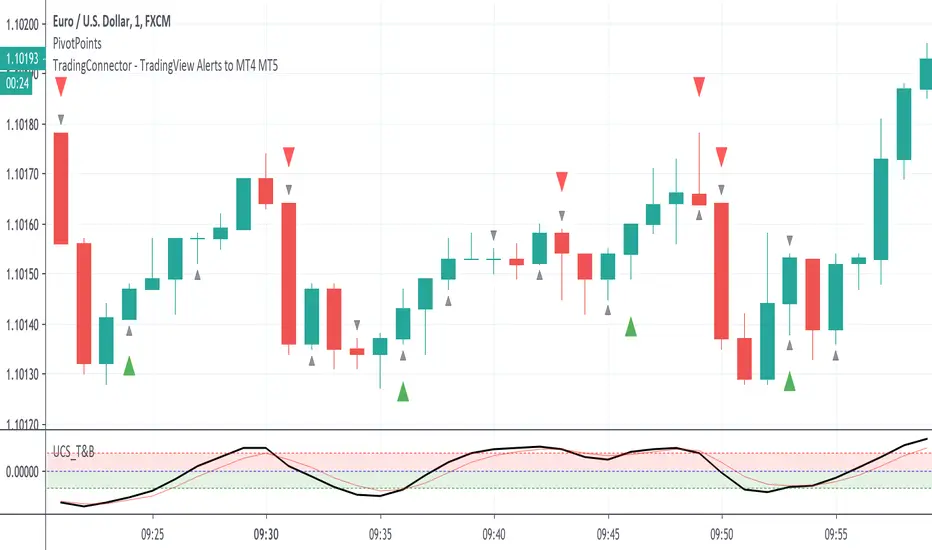
PivotPoints with Momentum confirmation by PeterOWho wouldn't like to be able to tell when the market actually reverses instead of just faking it? Every trader who has tried pivothigh/pivotlow functions for that, surely bumped into so many meaningless reversal signals, that probably got discouraged with this concept entirely.
Yet, pivot points are very important. Only they need to be confirmed at least a little bit (you'll never know for sure, you understand that right?)
This script enhances pivot-points mechanism with by confirming potential pivot point with actual reversal in momentum. If momentum reversal is also noticed in synch with the pivothigh/pivotlow, then you've got yourself a reversal - marked on the chart with red or green triangle. You can visually compare where those triangles are marked as compared to those small black ones, meaning the standard pivothigh(high,1,1)/pivotlow(low,1,1). Check yourself how many times this method would save us from pre-mature entry. On average 2/3 pivot points are filtered out.
This is a non-delayed confirmation - there is no waiting for another candle to close, just looking to another indicator for a match.Trader needs to take a decision immediately because if he hesitates, he will be late for sure. Also sometimes this script produces signal even before a full pivot-point is formed, as pin-bar analysis is also included here.
What this script IS NOT:
- a complete trading map. Don't take trade on each green or red triangle. You still need to do your homework on market direction, trend, phase, wave, etc. But at least you have the "trigger" part done.
- these pivot points are still not "guaranteed". You never know the future even as close as the very next candle, so the market can continue its trend right after it produces reversal signal. The aim of this indicator was only to filter out those potential pivot points, which didn't really look like reversals.
If you think this method could be improved somehow or would like to share your thoughts or approach, don't hesitate to reach out to me or write down in comments.
P.S. Credit goes to UCSGEARS for his Top&Bottom candle script. Amazing work. I used the momentum calculation from there.
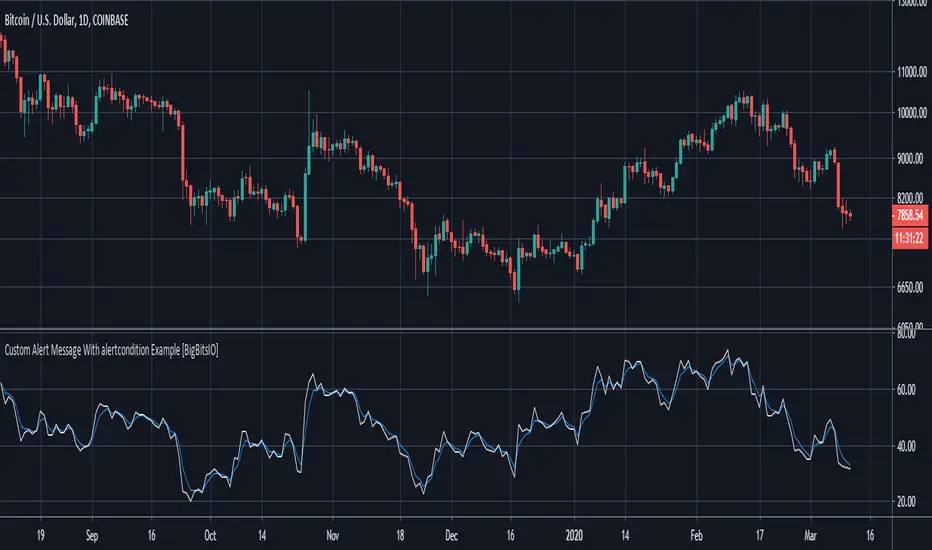
Custom Alert Message With alertcondition Example [BigBitsIO]This was a follower suggested script. This script shows an example of how to create a custom alert message using the alertcondition() function in pine.
Features:
- Well documented code with links to documentation for specific functions.
- Two alertconditions in a different order than the plots they reference to show the importance of plot IDs.
In order to actually get an alert with this script, you must create an alert through TradingView and reference this indicator and then reference the specific alert condition you want that alert to use.
For more information, contact me on social media or check YouTube for the associated video.
*** DISCLAIMER: For educational and entertainment purposes only. Nothing in this content should be interpreted as financial advice or a recommendation to buy or sell any sort of security or investment including all types of crypto. DYOR, TYOB. ***
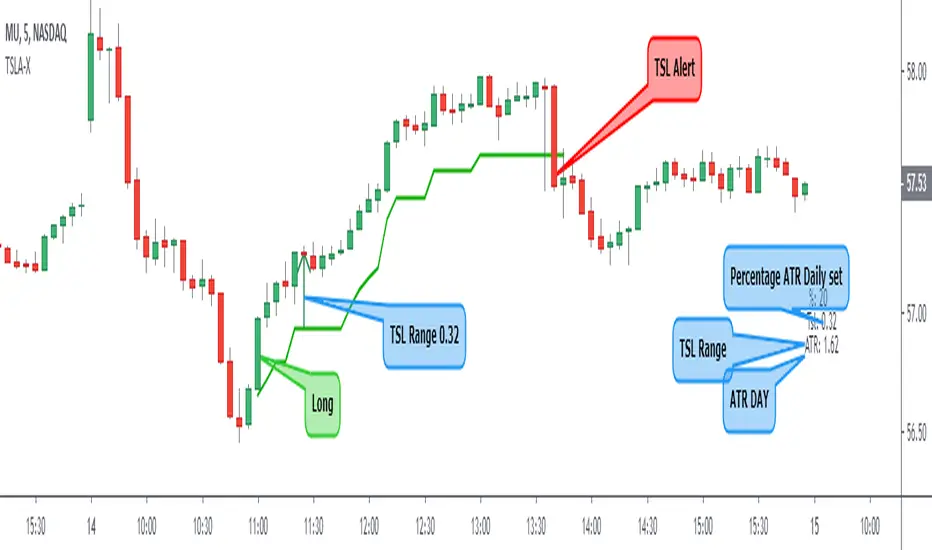
Trailing Stop Loss ATR + AlertI share this TSL indicator with alert (I use it only for Stocks), the configuration is very simple, you must select if it is a Short or Long operation, time at which the operation was opened,% of the daily ATR for TSL. It also contains:
- Alert
- Panel Info
Pivots With CPR,Moving Average and VWAP - by AnanthThis indicator is a combination of Pivot points with CPR, Moving Average and VWAP.

Early/Delayed Signal FunctionEarly/Delayed Signal Function (before the bar close or after)
Usually, signals are considered to be valid at the bar close .
Some traders may prefer to have a chance to enter earlier .
It is of great risk , and the Strategy Tester is unable to provide consistent backtest data with regards to this.
But for those who want to integrate such a choice in their strategies, here is the Early Signal Function .
The function takes 2 parameters
- the signal that is considered valid at the bar close , of type bool
- the early time value in seconds, the time before the signal is valid, of type int
it returns a value of type bool - a New Entry Signal
The resulting conditions used for alerts would be:
- newLongCondition = earlySignal_f(myLongSignal, earlyTime)
- newShrtCondition = earlySignal_f(myShrtSignal, earlyTime)
Note: the signals can also be delayed - use a negative value for early time

MACDTraderPro for BTC with LONG & SHORT AlertsMostly based on MACD analysis this trend indicator accurately shows you when main trend changes.
It has LONG and SHORT labels and you can use it with tradingview alerts to be in touch and for automated trading bots.
You can use it both with margin(bitmex, bitfinex, etc) and main exchanges (binance and more) with bitcoin for now and soon for alts also.

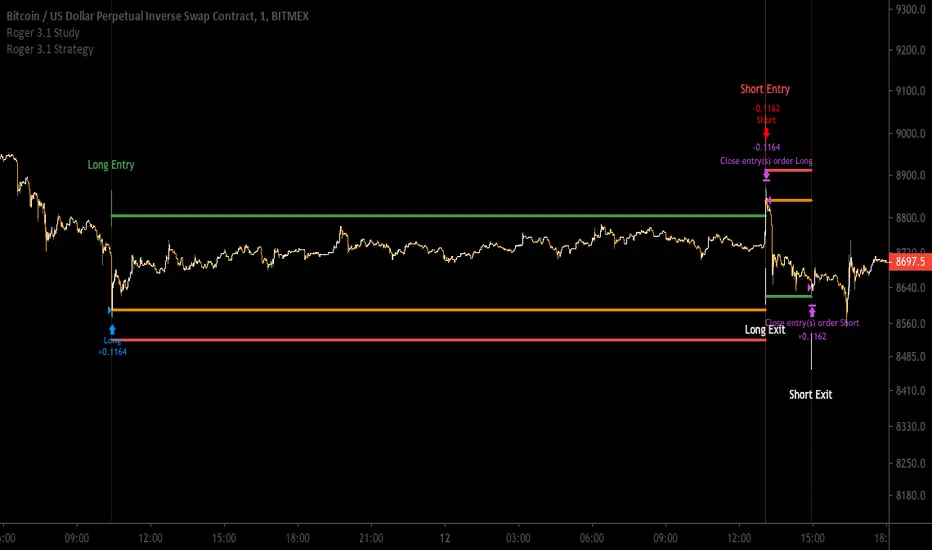
[Aill3urs V.1.1.P] Study RogerThis INVIT-ONLY study is based on Noise / Fixe TP & SL / EMA and you can optimize it with trends and work on low timeframe < 5min
Please use comment section for any feedback.
For any question DM me for any request.
## DISCLAIMER
1. I am not licensed financial advisors or broker dealers. I do not tell you when or what to buy or sell. I developed this software which enables you execute manual or automated trades multiple trades using TradingView. The software allows you to set the criteria you want for entering and exiting trades.
2. Do not trade with money you cannot afford to lose.
3. I do not guarantee consistent profits or that anyone can make money with no effort. And I am not selling the holy grail.
4. Every system can have winning and losing streaks.
5. Money management plays a large role in the results of your trading. For example: lot size, account size, broker leverage, and broker margin call rules all have an effect on results. Also, your Take Profit and Stop Loss settings for individual pair trades and for overall account equity have a major impact on results. If you are new to trading and do not understand these items, then I recommend you seek education materials to further your knowledge.
**YOU NEED TO FIND AND USE THE TRADING SYSTEM THAT WORKS BEST FOR YOU AND YOUR TRADING TOLERANCE.**
**I HAVE PROVIDED NOTHING MORE THAN A TOOL WITH OPTIONS FOR YOU TO TRADE WITH THIS PROGRAM ON TRADINGVIEW.**
Scalping BerkinAlex 1
--------Inglés---------
Updated to Pine Script v4. 👌
Added labels (indicators) of Purchase and Sale according to moving averages for scalping and intraday. 🤑
Fusion of the "Scalping BerkinAlex 3" indicator with the "Scalping BerkinAlex 1", so as not to occupy a slot of indicators unnecessarily if you have a free account. 😜
Alert system designed, now you can create an alert in free mode according to the possibility of buying or selling an asset.🔔
Errors found fixed.💪
---------Español---------
Actualizado a Pine Script v4. 👌
Añadidas etiquetas (indicadores) de Compra y Venta según medias móviles para scalping e intradía. 🤑
Fusión del indicador "Scalping BerkinAlex 3" con el "Scalping BerkinAlex 1", para así no ocupar un slot de indicadores innecesariamente en caso de disponer cuenta gratuita. 😜
Sistema de alertas diseñado, ahora podrás crear una alerta en modo gratuito según exista la posibilidad de comprar o vender un activo.🔔
Errores encontrados solucionados.💪


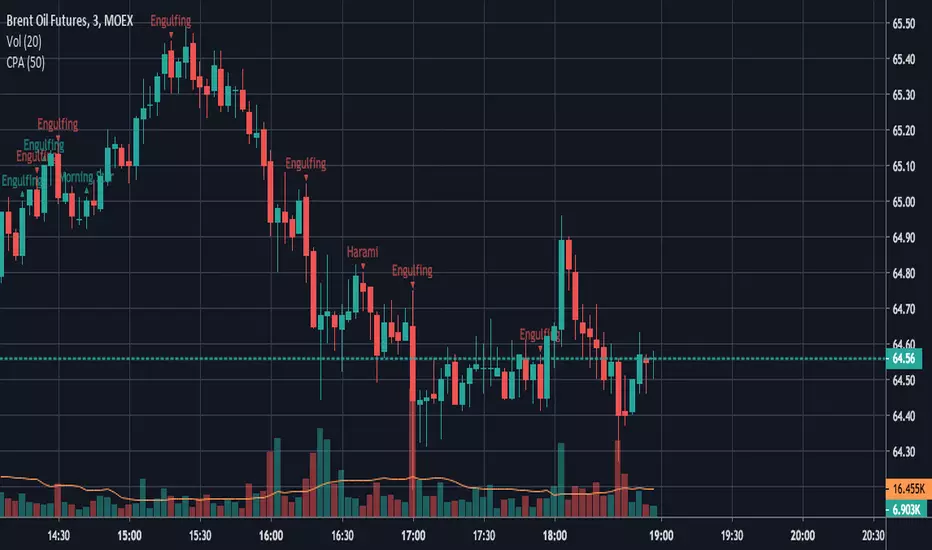
Candle Patterns AlertCandlestick pattern alerts for strategies "Candle Patterns Strategy" and "Candle Patterns Strategy - 2".
In order not to receive unnecessary signals, in the "Manage alerts" option should be selected "Once per bar close".
Elgrand - MACD crossover overlay with alertVisualize MACD bullish and bearish crossovers on your chart as an overlay. This way you won't necessarily have to add the MACD script and check manually at which point on your chart the MACD crossed. Optionally you can set alerts on the MACD crossovers in case you would like to trade from this after the signal occured.

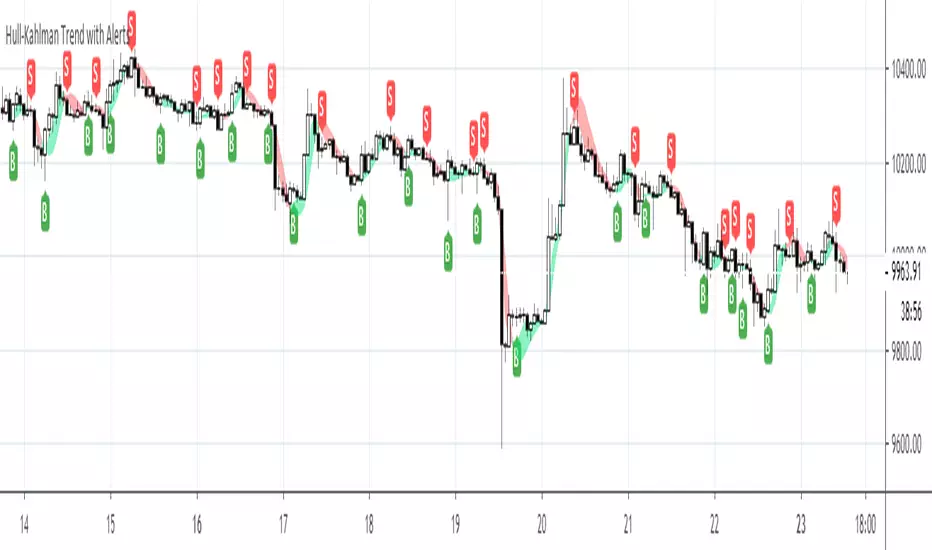
Hull-Kahlman Trend with AlertsThis update is meant for those who do not want to dig into the code.
Also:
- modified hma3 function
- modified kahlman function
- edited for readability
- added alerting
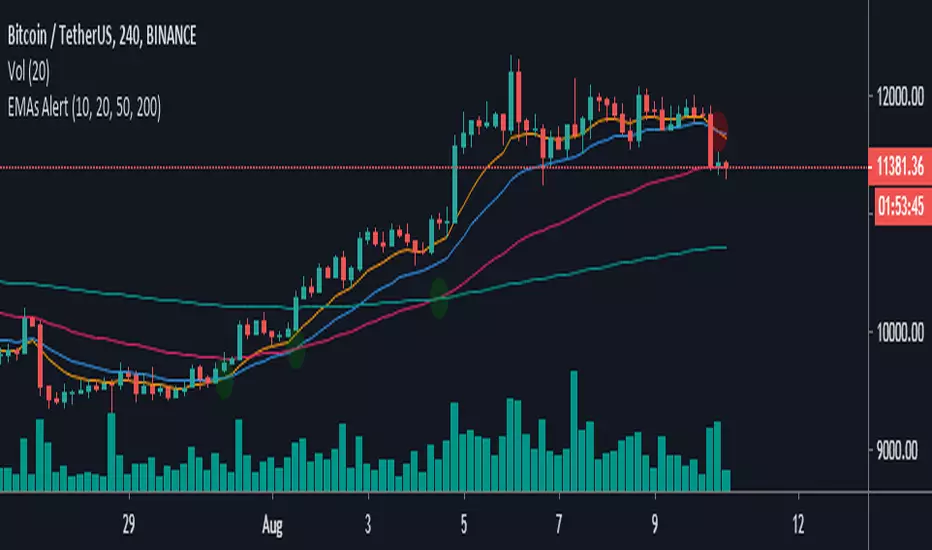
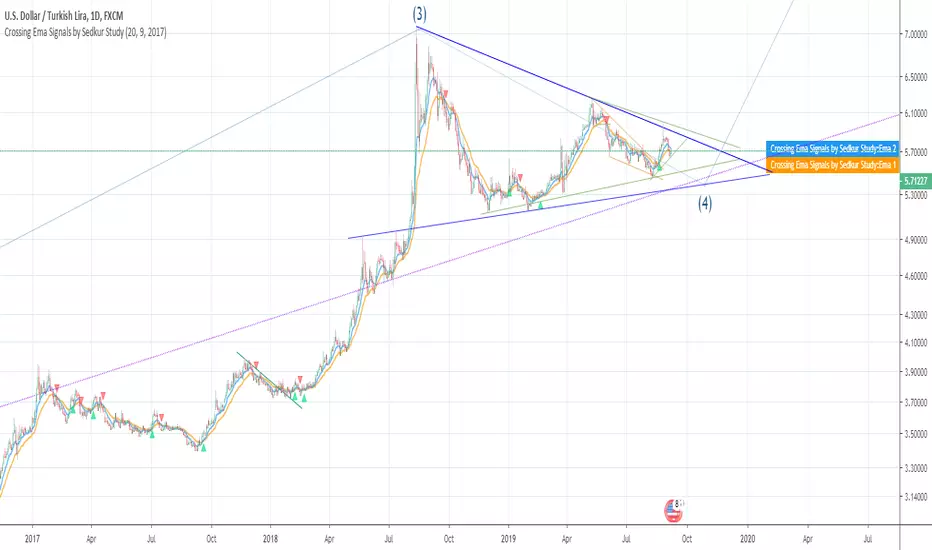
EMAs Alert-This script allows you to show the crossings of the most important emas such as 10, 20, 50 and 200
-You can modify the values of each ema you like
-Bring alerts of the crosses of each ema, which will allow you to activate this function to only the assets you want to track