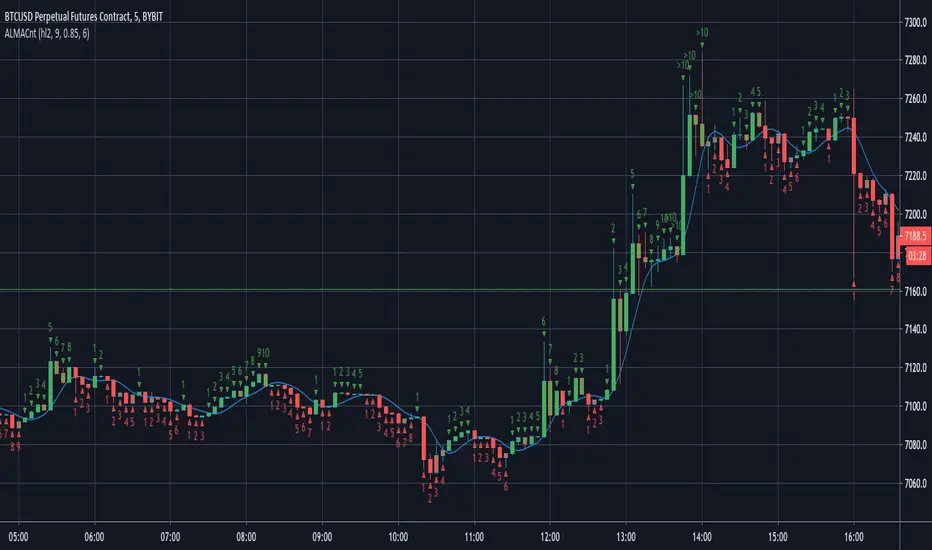
ALMA CounterIt counts how many candles are below or above the Arnaud Legoux Moving Average (ALMA).
It may be useful to found good entry points.
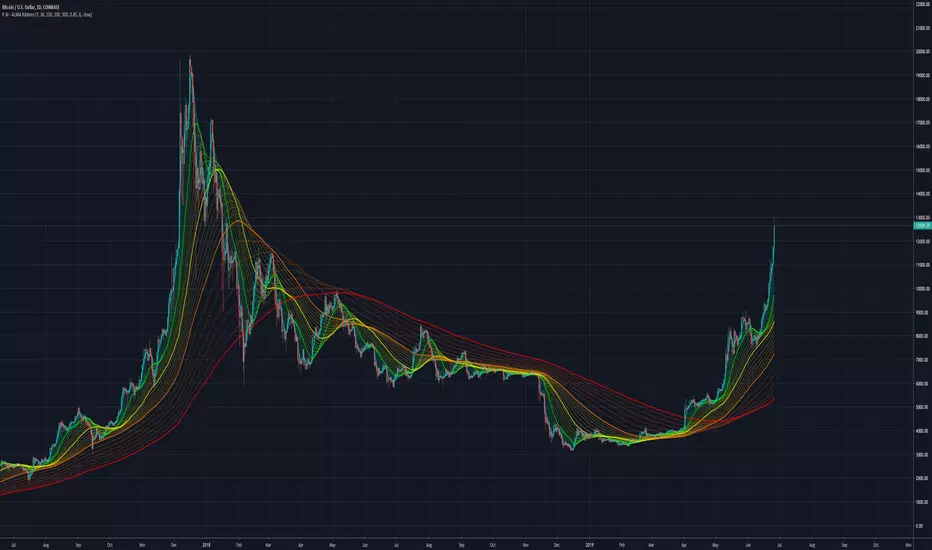
Alma
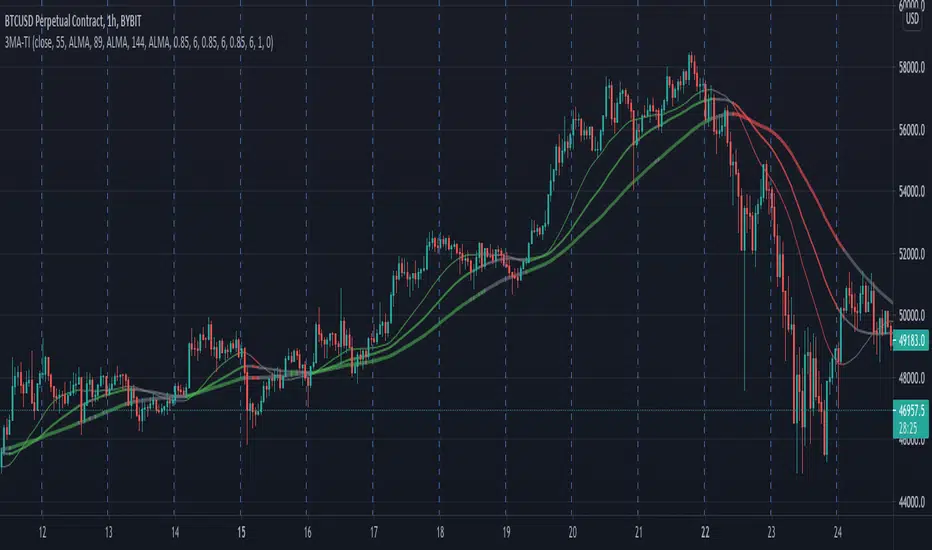
3 MA Trend IndicatorIt is a trend detector indicator, using 3 moving averages.
You can select different MA's and set the periods of them. If all 3 is increasing, the color will be green, if decreasing, the color will be red, gray otherwise.
It can be used for e.g. scalping.
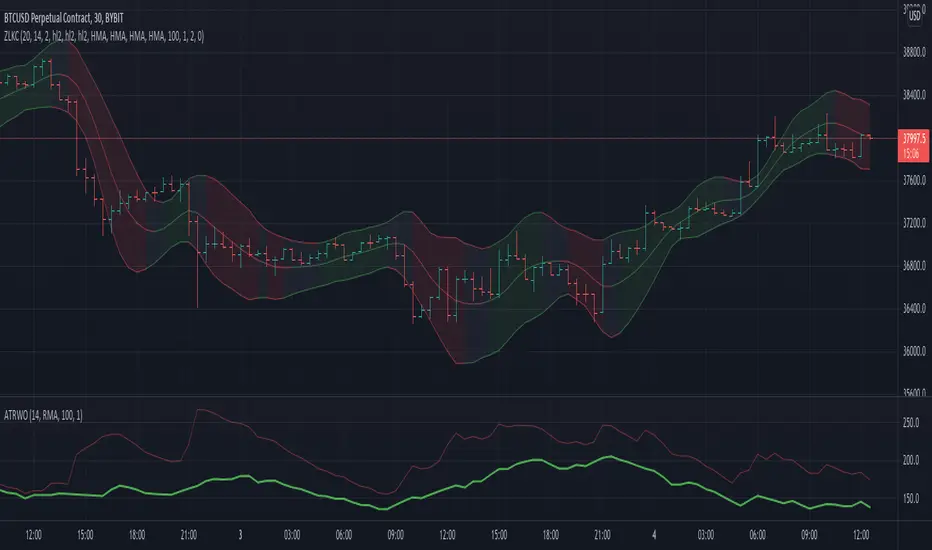
Zero Lag Keltner ChannelsThis is Keltner Channelz (KC) with Zero Lag Moving Average (ZLMA as base). It is smoother and has less lag than the original (EMA/SMA) variant.
It also can be used as a trend indicator and trend confirmation indicator. The upper and lower bands are green if it is an up trend, and red if a down trend. If both have the same color it is a stronger trend.
Alma Trend DirectionIt helps you identify trends in a more convenient way and provides support and resistance levels using Arnaud Legoux Moving Average and Fibonacci values

multi pack fisher's and EMACross and Probabilty densityFisher dönüşümün farklı türlerini en çok kullanılan indikartörlerle yeniden sentezlenmesi sonucu ve farklı ema kesimlerine olasılık dağılım yoğunluğu eklenerek içinde bulunan piyasanın trend gücünü görseleştirme amaçlanmıştır.Çalışma tamamen eğitim amaçlı olup, farklı indikatörlerin bir arada kullanımını göstermek için hazırlanmıştır.Kesinlikle yatırım tavsiyesi değildir.
Saygılarımla...
LazEngineer ,Elecrical Engineer
// English explanation
It is aimed to visualize the trend of the market containing the result of re-synthesis with the most used indicator in different types of fisher trasform and by adding the density of the distribution Z transform, required for cutting different ema.
Yours truly ...
LazEngineer, Electrical Engineer

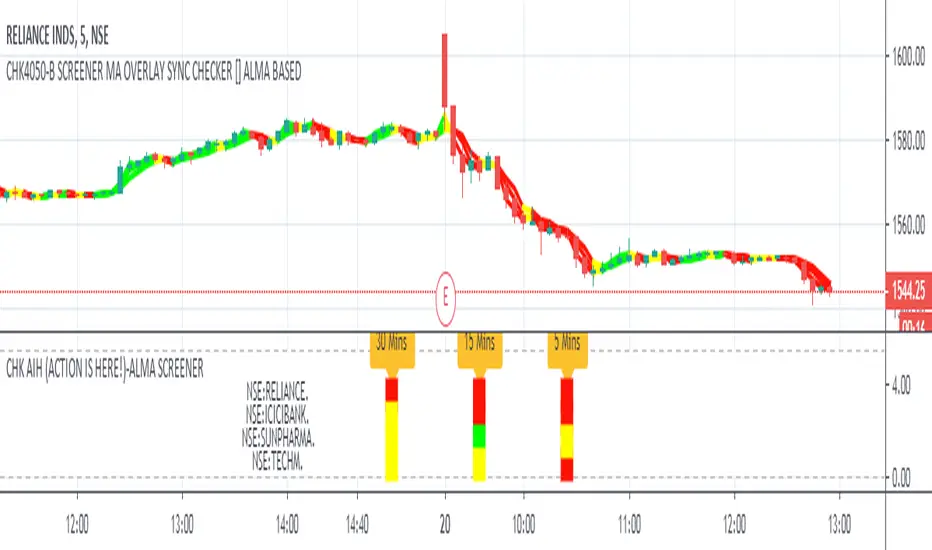
CHK AIH (ACTION IS HERE!)-ALMA SCREENERWe do not like to stare at the screen whole day, instead we like to jump where the
action is.... The Screener was written with this in mind
CHK AIH (ACTION IS HERE!)-ALMA BASED SCREENER
FEATURES
User can enter 3 Resolutions of his/her choice
User can select 3 Mov Avg Length of his her choice, which would be identical for all the three timeframes
User can enter stock basis his/her region's stock exchange
User can shift the screener left or right if not visible in a Multiscreen mode
Uses ALMA (Arnaud Legoux Mov Avg) as it smooth and reactive
Code is also provided below of MTF ALMA Moving Average OVERLAY on which this screener is based
LOGIC
For a particular timeframe If all the Moving Average are calibrated in one direction, it will show the requisite color.
For Example in an ideal scenario for a bull trend ALMA(5)> ALMA(13) > ALMA(21), once such a situation is identified, the screener will show green.
Yellow means lack of Calibration.
When 3 timeframes are calibrated, it becomes a high Probability Trade
BUGS
It is not allowing to enter the D/W/M timeframes, timeframe in numbers ...5/15/60 is working fine. If somebody can fix it
it would be great
LIMITATIONS
Because of TV's limitations only 4 scrips can be entered, however one add the indicator again with new scrips
//////////// CREDITS ////////////////////////////////////////////////////////////////////////////////////
//// hxxps://www.tradingview.com/script/rwdgyEZe/
/// Thank You Inno14 for graciously sharing your work. Your work has helped immensely !!!
////////////////////////////////////////////////////////////////////////////////////////////////////////
ICICIBANK
TECHMAHINDRA
YESBANK
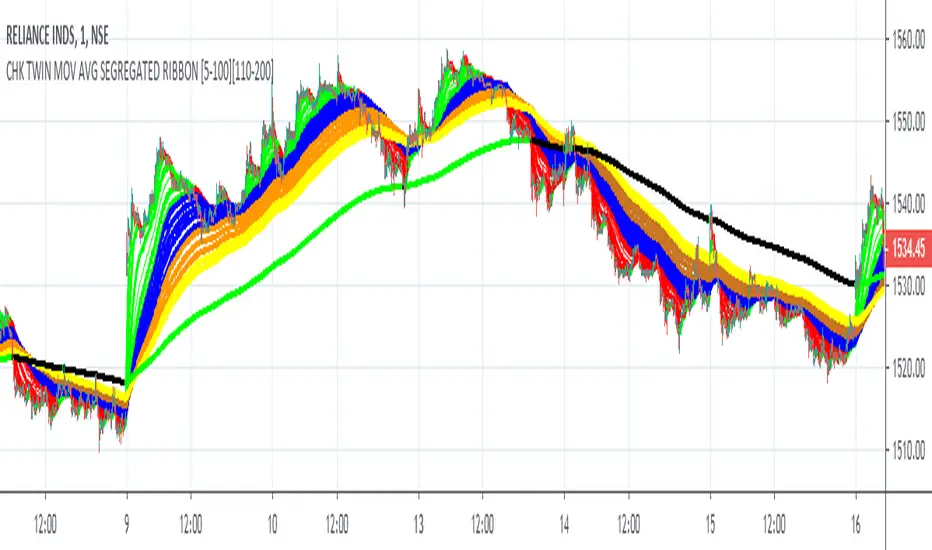
FALSE BREAKOUT NO PROBLEM !! CHK TWIN MOV AVG SEGREGATED RIBBON PROBLEM DEFINITION 1 : To Avoid False Breakouts
PROBLEM DEFINITION 2 : To Ascertain if the trend has changed when a Stock opens with a Gap up or Gap Down
## PROBABLE SOLUTION : Use a Moving Average with lot of latency
## PROBLEM WITH ABOVE SOLUTION : Misses on lot of trades, Late exits leads to drain on winning trades
S O L U T I O N
An Indicator which plots two different types of Moving Averages at the same time
For the MA length 5-100 a fast plot of choice
For the MA Length 110-200 a plot with a lag to ascertain the trend
And then ONE LAST MAN STANDING with even bigger MA length for a lagging indicator to save the day
This indicator gives one 9X9 = 81 Permutation Combinations to look at the markets
One can devise strategies basis if one particular MA Type has crossed another MA Type
Feel free to post the strategies you have come out with!
//// CREDITS AND ACKNOWLEDGEMENTS //////////////////////////////////////////////////////////////////
Following contributors helped the author ::
Credits to Neobutane for his Multiple Type Mov. Avg. Guppy at ......
hxxps://www.tradingview.c0m/script/UQAv1U0c-MA-Study-Different-Types-and-More-NeoButane/
Credits to Jose5770 for sharing Jurik MA code at .....
hxxps://www.tradingview.c0m/script/uqYvkHna-Trend-Direction-Force-Index/
Appreciate and Thank You for sharing your work.
//////////////////////////////////////////////////////////////////////////////////////////////////////
P.S You might notice in the code that the few plots are skipped. It is done to fasten the indicator without compromising
on the functionality
CHK TimeSeriesLagReductionFilter[MULTI MA]This script is an improvement on the idea published on " Time Series Lag Reduction Filter "
This script allows users to select the Moving Average of his choice. Helps precise entries and precise exits.
Since every Moving Average is different, play with the settings to get the best fit. If the "Lag Reduce" overshoots bring down the number.
CREDITS ::
TO theheirophant for this idea
TO NEOBUTANE for his MULTI TYPE MOV AVG GUPPY
Thank You NEOBUTANE and Theheirophant.
This is my first publication :)
Sharing few examples what this script can do

(1) Genie Cycles VS-200The Genie Cycles indicator contains two primary components. The first generates the primary turning-point Entry/Exit signals based on a hybrid algorithms that utilize multiple moving filters and oscillators, all working in concert. The second is our version of Hurst Cycles allowing the trader to view the harmonic convergence of short and long cycles.
The turning-point signals are generated by two Center of Gravity Oscillators (COG) originally developed by John Ehlers and published in Technical Analysis of Stocks and Commodities in its May 2002 issue.
COG produces a moving filter that heavily weights the most extreme and most current values in the stream of data within the window of the indicator. COG excels at determining and indicating where, within a parabolic path, tipping or turning points have occurred. Two COG indicators, each one set to a different length and different inputs are incorporated. The output of these two COG filters are them put through another Ehler’s filter, the Pass Band; July 2016 issue of TAOSAC. A pass band filter has the unique ability of removing the higher and lower frequencies from the signal, leaving behind only the core signal. Here we are taking a longer COG period of (10) days, utilizing the candles body size as it’s input and then subtracting a short period of (7) days utilizing only the close of the day. The result is an emphasis on the extreme values, i.e., the maximum apex and the minimum vertex of each parabolic swing. Finally, the Arnaud Legoux Moving Average (ALMA) is utilized as smoothing a filter to slightly shift the weighting from the COG Pass band filter, in a selective and adjustable manor to more current bars, not the most current bar. This is desirable because COG dramatically emphasizes the most current candle or bar as well as large candles and strong deviations from within the moving average.
This provides the trader with excellent responsiveness within a very smooth output signal with very few artifacts or whipsaws, producing highly reliable trading signals that indicate optimal entry and exit points with a high level of accuracy and very little lag.
The primary principals of Hurst cycles are price moves in waves that exhibit cyclic attributes based on their time scales. Genie Cycles incorporates Hurst cycles theories, but utilizes only two nested Laguerre moving filters. Laguerre moving filters have significantly less lag than traditional moving averages. These moving filters take as there inputs the highest high and the lowest lows for the two adjustable periods. The point of the indicator is to determine when a short-term swing cycle harmonizes or aligns with a long-term cycle, i.e., determining when the tops and bottoms of these cycles align.
The resulting nested channels produce natural bounding boxes. This dramatically highlights likely support and resistance levels as they often occur at prior highs or lows that this indicator is drawing. Convergence of the different cycle lengths can indicate strong trends that make excellent trading opportunities. Decoupling of the cycles indicates the end of the trend.


Ultimate MA Cross IndicatorContinue to experiment with new labels functionality in TradingView. Created ma cross script with 9 different types of MA wit additional information box. In that box, I included the bars passed from the previous bull/bear cross.
Also you cand find there live distance between moving averages in price and ATRs , so you track how close are you from the next close.
Do you think this concept is useful? What information do you want to see in this kind of boxes?
These ma types are included in this indicator:
Simple Moving Average ( SMA )
Exponential Moving Average ( EMA )
Weighted Moving Average ( WMA )
Arnaud Legoux Moving Average ( ALMA )
Hull Moving Average ( HMA )
Volume-weighted Moving Average ( VWMA )
Least Square Moving Average ( LSMA )
Smoothed Moving Average ( SMMA )
Double Exponential Moving Average ( DEMA )
[LunaOwl] 反轉模式 (Bollinger %B Reversals)This is a tool using the Bollinger %B and Arnaud Legoux Moving Average (ALMA), it is a reliable tool for trading price action reversals.
腳本使用布林%B和ALMA,是一個可靠的逐棒分析反轉工具。
1. 英鎊兌美元 GBP / USD, 5 min
2. 美元兌日圓 USD / JPY, 5 min
3. 美元兌離岸人民幣 USD / CNH, 5 min
4. 日本 Sosei 生物製藥株式會社 Sosei Group Corporation, 5 min
5. 比特幣永續 Bitcoin for BitMEX, 5 min
6. 瑞波幣兌比特幣 XRP / BTC, Poloniex, 1 hour
7. 比特幣主導比率 Bitcoin Dominance Index, 4 hour
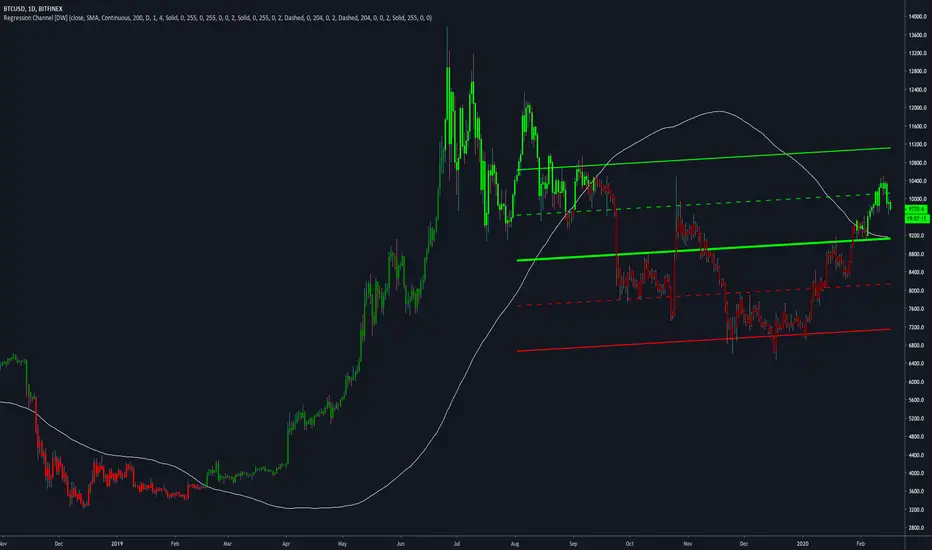
Regression Channel [DW]This is an experimental study which calculates a linear regression channel over a specified period or interval using custom moving average types for its calculations.
Linear regression is a linear approach to modeling the relationship between a dependent variable and one or more independent variables.
In linear regression, the relationships are modeled using linear predictor functions whose unknown model parameters are estimated from the data.
The regression channel in this study is modeled using the least squares approach with four base average types to choose from:
-> Arnaud Legoux Moving Average (ALMA)
-> Exponential Moving Average (EMA)
-> Simple Moving Average (SMA)
-> Volume Weighted Moving Average (VWMA)
When using VWMA, if no volume is present, the calculation will automatically switch to tick volume, making it compatible with any cryptocurrency, stock, currency pair, or index you want to analyze.
There are two window types for calculation in this script as well:
-> Continuous, which generates a regression model over a fixed number of bars continuously.
-> Interval, which generates a regression model that only moves its starting point when a new interval starts. The number of bars for calculation cumulatively increases until the end of the interval.
The channel is generated by calculating standard deviation multiplied by the channel width coefficient, adding it to and subtracting it from the regression line, then dividing it into quartiles.
To observe the path of the regression, I've included a tracer line, which follows the current point of the regression line. This is also referred to as a Least Squares Moving Average (LSMA).
For added predictive capability, there is an option to extend the channel lines into the future.
A custom bar color scheme based on channel direction and price proximity to the current regression value is included.
I don't necessarily recommend using this tool as a standalone, but rather as a supplement to your analysis systems.
Regression analysis is far from an exact science. However, with the right combination of tools and strategies in place, it can greatly enhance your analysis and trading.
Redwire's ALMA BandsThese ribbons are based on Arnaud Legoux's moving average and combined with Fibonacci levels to create near perfect points of interest. when price action enters one of these bands watch for it's reaction, if price gets rejected expect it to return to the previous band, like wise if the price breaks above one band you can expect it to continue to the next.
simple yet elegant
Suggested use of this script is to place take profit orders within the plotted bands or trade breakouts and rejections.
Please do not base your trades entirely on this indicator it is meant as an addition tool to use along with other methods.

Comparing different types of moving averagesA Study of Moving Average Types
// SMA Simple
// WMA Weighted
// VWMA Volume Weighted
// EMA Exponential
// DEMA Double EMA
// ALMA Arnaud Legoux
// HMA Hull MA
// SMMA Smoothed
// LSMA Least Squares
// KAMA Kaufman Adaptive
// TEMA Triple EMA
// ZLEMA Zero Lag
// FRAMA Fractal Adaptive
// VIDYA Variable Index Dynamic Average
// JMA Jurik Moving Average
// T3 Tillson
// TRIMA Triangular
MACD Builder ProOur newest indicator, the MACD Builder Pro, gives traders the ability to build a MACD based on 7 different kinds of moving averages. The options include:
1.Standard MACD (EMA)
2.Hull Moving Average MACD
3.Volume Weighted MACD (VWMA)
4.Arnaud Legoux MACD (ALMA)
5.Double EMA MACD
6.MACD based on median
7. Simple Moving Average (SMA) MACD
Additionally, we've included countless plotting options for users to choose from. Users can choose to plot either the MACD or MACD Histogram in addition to the signal line. There is also an option to have the entry and exit signals displayed as green(entry) and red(exit) triangles for the entry and exit signals or red and green vertical highlight lines.
We've also provided the ability to fully customize the entry and exit conditions for the indicators trading logic. As mentioned, we've included over 7 different types of MACD indicators. But, we also included the ability to customize the lengths of the fast and slow Moving Averages used in the MACD calculation, as well as the length of the signal line. For entry conditions, the different options are:
1. MACD Histogram Above/Below Zero- Entry signals are generated when MACD Histogram crosses above the zero line into positive territory and exit signals come when the MACD Histogram crosses under the zero line into negative territory.
2. MACD Histogram Rising/Falling - Entry signals are generated when MACD Histogram first begins rising and exits when MACD Histogram first starts decreasing.
3. MACD Above/Below Zero - Entry signals are generated when MACD crosses above the zero line into positive territory and exit signals come when the MACD crosses under the zero line into negative territory.
4. MACD Rising/Falling - Entry signals are generated when MACD first begins rising and exits when MACD first starts decreasing.
As always, this script comes with pre-set alerts and we will be offering 3 day trials to anyone interested!
To check out more of our indicators head on over to our website : profitprogrammers.com

Double RSI StudyHere is the study version of our recent Double RSI strategy based on a Hull RSI and ALMA RSI.
The study version includes alerts for signals generated by both RSI's. It also includes an option to allow repeat signals, as well as tons of plotting options, etc.
If interested in a 3 day trial, feel free to send a message and check out our website ProfitProgrammers.com !

Double RSI Strategy(ALMA RSI + Hull RSI)We're back at it with a brand new strategy centered around an Arnaud Legoux RSI and Hull RSI. This one took a lot longer to make than usual, which is the reason there hasn't been any new posts the last week.
The first component of the strategy is the Hull RSI. The Hull RSI is shown in light blue and its upper and lower bounds are plotted as the dark pink and teal horizontal lines. Applying a Hull Moving Average to the RSI results in higher smoothness and less false signals. The lengths of the RSI and the HMA of the RSI can both be adjusted by the user.
We then used a similar process to calculate an Arnaud Legoux Moving Average(ALMA) of the RSI. The ALMA RSI is shown as the solid white line, while its upper and lower thresholds are the green and red horizontal lines. The ALMA RSI is a great tool since it is adaptable for multiple different uses - users can adjust the offset, sigma, and length values to modify the RSI's responsiveness and smoothness.
Input Options for ALMA RSI:
-Offset : Value in range {0,1} that adjusts the curve of the Gaussian Distribution. A higher value will result in higher responsiveness but lower smoothness. A lower value will mean higher smoothness but less responsiveness.
-Length : The lookback for each ALMA calculation.
-Sigma : Defines the sharpe of the curve coefficients.
The entry and exit signals generated by the Hull RSI are represented by the small green(buy) and red(sell) circles, while the green and red vertical highlights are the ALMA RSI's buy and sell signals. By default, we set the pyramiding to 3, with 50% equity used in each trade to allow the ALMA to make the longer-term swing trades and higher frequency trades made with the Hull RSI.
The strategy will be posted on our website, ProfitProgrammers.com, soon. As always, we will be offering 3 day trials for this strategy so feel free to send a quick message to start the trial period!

ALMA MACDThis indicator creates a MACD based on Arnaud Legoux Moving Averages (ALMA). I prefer this implementation over the standard MACD based on exponential moving averages as it filters out most of the minor price fluctuations that lead to false signals.
To learn more check out our other posts about the Arnaud Legoux Moving Average:
Many Moving AveragesThis script allows you to add two moving averages to a chart, where the type of moving average can be chosen from a collection of 15 different moving average algorithms. Each moving average can also have different lengths and crossovers/unders can be displayed and alerted on.
The supported moving average types are:
Simple Moving Average ( SMA )
Exponential Moving Average ( EMA )
Double Exponential Moving Average ( DEMA )
Triple Exponential Moving Average ( TEMA )
Weighted Moving Average ( WMA )
Volume Weighted Moving Average ( VWMA )
Smoothed Moving Average ( SMMA )
Hull Moving Average ( HMA )
Least Square Moving Average/Linear Regression ( LSMA )
Arnaud Legoux Moving Average ( ALMA )
Jurik Moving Average ( JMA )
Volatility Adjusted Moving Average ( VAMA )
Fractal Adaptive Moving Average ( FRAMA )
Zero-Lag Exponential Moving Average ( ZLEMA )
Kauman Adaptive Moving Average ( KAMA )
Many of the moving average algorithms were taken from other peoples' scripts. I'd like to thank the authors for making their code available.
JayRogers
Alex Orekhov (everget)
Alex Orekhov (everget)
Joris Duyck (JD)
nemozny
Shizaru
KobySK
Jurik Research and Consulting for inventing the JMA.
ALMA Trend DirectionHere is a very simple tool that uses the Arnaud Legoux Moving Average(ALMA). The ALMA is based on a normal distribution and is a reliable moving average due to its ability to reduce lag while still keeping a high degree of smoothness.
Input Options:
-Offset : Value in range {0,1} that adjusts the curve of the Gaussian Distribution. A higher value will result in higher responsiveness but lower smoothness. A lower value will mean higher smoothness but less responsiveness.
-Length : The lookback window for the ALMA calculation.
-Sigma : Defines the sharpe of the curve coefficients.
I find that this indicator is best used with a longer length and a 4 Hour timeframe. Overall, its purpose is to help identify the direction of a trend and determine whether a security is in an uptrend or a downtrend. For this purpose, it is best to use a lower offset value since we are looking to identify long-term, significant price movement rather than small fluctuations.
The Chart:
The ALMA is plotted as the aqua and pink alternating line. It is aqua when bullish and pink when bearish.
The low price for each candle is then compared to the ALMA. If the low is greater than the ALMA, then there is a bullish trend and the area between the candles and ALMA is filled green. The area between the ALMA and candles is filled red when the low price is less than the ALMA.
The difference between the slow ALMA and candles can reveal a lot about the current market state. If there is a significant green gap between the two, then we know that there is a significant uptrend taking place. On the other hand, a large red gap would indicate a significant downtrend. Similarly, if the gap between the two is narrowing and the ALMA line switches from aqua to pink, then we know that a reversal could be coming shortly.
~Happy Trading~
MoT - ALMA RibbonsMoving Averages in the style of ALMA.
Ribbons are Multi-Coloured.
Ribbon averages (ALMA Lengths), Offset and Sigma are all fully adjustable and colours/levels can also be selected/deselected or changed as required!
Double ALMAIncludes fast and slow Arnaud Legoux Moving Averages (ALMA). ALMA is a moving average based on a Gaussian(normal) distribution that reduces lag while still retaining smoothness.
Input Options:
-Offset : Value in range {0,1} that adjusts the curve of the Gaussian Distribution. A higher value will result in higher responsiveness but lower smoothness. A lower value will mean higher smoothness but less responsiveness.
-Lengths : The lookback for each ALMA calculation.
-Sigma : Defines the sharpe of the curve coefficients.
The slow ALMA is the thickest red and green alternating line that indicates bullish or bearish movement. When slow ALMA is bullish, the graph's background changes to green. When the slow ALMA is bearish, the background is red.
The fast ALMA uses a smaller lookback and is more responsive than the slow ALMA as a result of the shorter length and higher default offset parameter.
The two dotted lines represent (slowALMA +/- 1.25 * stdev(slowALMA, slowALMA period *2)).
The indicator bases its buy and sell signals based on the trend identified by the slow ALMA and the fast ALMA's crossings of the standard deviation bands.
Comes with pre-set buy and sell alerts.
