Bollinger Band+ Multi EMA, SMAHello Everyone.
I make Bollinger band , 3 ema and 3 sma combined.
I think this indicator can use all timeframe.
--------------------------------------------------------------
Indicator will show you
1. Trend follow
2. Pullback catch
2. Market bounce.
1. Trend Follow
- Trend Follow for I used 3 terms. They are short, Mid and Long Trend.
2. Pullback Catch
- EMA for Save, take care, alert Zones.
- Mid Term Trend can be catch also.
3. Market Bounce
- Bollinger Band will show you market re-bounce point.
Final Notes
Indicator will show Trend, Pullback, Market bounce and some support and resistant level.
Band

Volatility Bands by DGTVolatility represents how large an asset's prices swing around the mean price, the degree of variation of a trading price over time, and is commonly measured with beta (β) coefficients, standard deviations (σ) of returns where tools such as Average True Range, Bollinger Bands, Keltner Channel, Squeeze Indicator, etc presents volatility concept
Volatility often refers to the amount of uncertainty or risk related to the size of changes in a security's value. The higher the volatility, the riskier the security - the price of the security can change dramatically over a short time period in either direction. A lower volatility - security's value does not fluctuate dramatically, and tends to be more steady
This study, Volatility Bands , attempts to present a way to measure and visualize volatility , using standard deviations (σ) and average true range indicator, and aims to point out areas that might indicate potential trading opportunities
I will try to explain the usage with examples,
same setup with different option selected
as you may observe from the examples different setting may have advantages and disadvantages over one another, it is recommended to verify a trading setup with different available options.
Additionally, It is recommended to use this indicator in conjunction with other technical indicators, or verify using chart/candle patterns. Below is an usage example using in conjunction with other indicator, in the given example “Neglected Volume by DGT” is selected
Similarities and Differences
Bollinger Bands depicts two standard deviations above and below a simple moving average, and Keltner Channel depicts two times average true range (ATR) above and below an exponential moving average
Volatility Bands study combines the approach of both Bollinger Bands and Keltner Channel, with different settings and different visualization
Default settings are one standard deviations and one time average true range (ATR) above and below 13 period exponential moving average. Setting can be adjusted by users but let me remind all testes are performed with the default settings.
Mathematically expressed as
Upper band area between “ema + stdev” and “ema + atr”
Lower band area between “ema – stdev” and “ema – atr”
A different display is added with the inspiration I get from one of the @quantgym ‘s study, many thanks @quantgym 😉
When difference band display is selected the study will reflect the area between “ema + stdev – atr” and “ema – stdev + atr”. As shown in the examples above
Note: standard deviation calculation can be adjusted based on price action or its moving average.
Other differentiation between BB and KC is with V-BANDS mostly we look for trade opportunities when price action move out of the bands and in most cases we assume market is consolidating when the price action is within the bands
The other indicator that presents similarities to Volatility Bands is Squeeze Indicator, which measures the relationship between Bollinger Bands and Keltner's Channels to help identify consolidations and signal when prices are likely to break out. Mainly Volatility Bands is different version of Squeeze indicator, in fact the purpose is almost same but visualization is completely different. Additionally Volatility Bands Offers trading opportunities whereas Squeeze indicator only presents market states unless a momentum indicator is adapted to Squeeze indicator.
Disclaimer:
Trading success is all about following your trading strategy and the indicators should fit within your trading strategy, and not to be traded upon solely
The script is for informational and educational purposes only. Use of the script does not constitute professional and/or financial advice. You alone have the sole responsibility of evaluating the script output and risks associated with the use of the script. In exchange for using the script, you agree not to hold dgtrd TradingView user liable for any possible claim for damages arising from any decision you make based on use of the script

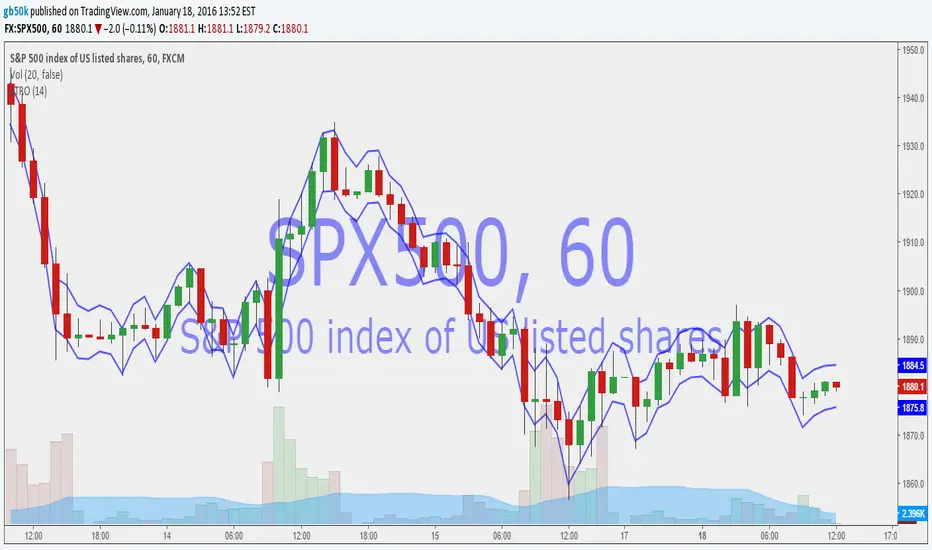
Geometric Brownian Motion BandIf you are an option trader, who are constantly searching opportunities to set up inverse iron condor position or other strategies, you must be familiar in estimating the range induced by Geometric Brownian Motion (GBM), or Lognormal distribution someone may call.
The theory behind is adopted in the Black Scholes Option Pricing model, this assumes the asset price follows the GBM, shown below, and estimates the range where the price will fall into on the specific date and probability.
dS = a dt + v dW
Assuming the drift term is zero, this GBM Band applies the same model and helps you to quickly assess the suitable range to set up your option strategies with simple setting:
Length – number of bars covered
Vol Multiple - the z-score of the probability
Default values of the Length and Vol Multiple are set to 20 bars and 2.0 z-score respectively.
You can find an example how the GMB Band work.
You can also applies this GMB Band like how Bollinger's Band does for swing trade or breakaway trade.
If you find this indicator is useful to you, Star it, Follow, Donate, Like and Share.
Your support is a highly motivation for me.

Magic BandThis indicator can help you to understand the current trend and help you to take an entry, If your analysis looks good to go for long entry, check that where is your candle based on this indicator,If the candle is above the indicator it is goo to go for long and if it is bellow the indicator it is good to go for short.
More than that the candle is closing strong above the indicator after crossing the indicator , then it is a good sign to take a long position. Similarly if the candle close strongly bellow the indicator after crossing the indicator then it is good to go for short position.
Use the indicator with other indicators or your analysis.
Please contact me for more details.

SFL ATR BandsMany traders use ATR as a way to determine stop loss placement. It usually works like this:
- Stop loss for a short trade = high of last candle + ATR value
- Stop loss for a long trade = low of last candle – ATR value
This is an indicator that allows you to do just that: it gives you an easy way to view current and historical volatility using ATR-based price bands .
Features
The indicator is configurable with the following settings:
ATR period
ATR multiplier
ATR applied to highs/lows OR the close price
Bands offset
Only show for the last X candles
How To Use This Indicator
Since this indicator shows average volatility bands, it is a good measure of how much the price moves. So we can use ATR bands in a number of ways:
it’s an easy way to see where you can place your stop loss
you can use a multiple of ATR as your trade target
you can trail your stops alongside the ATR bands


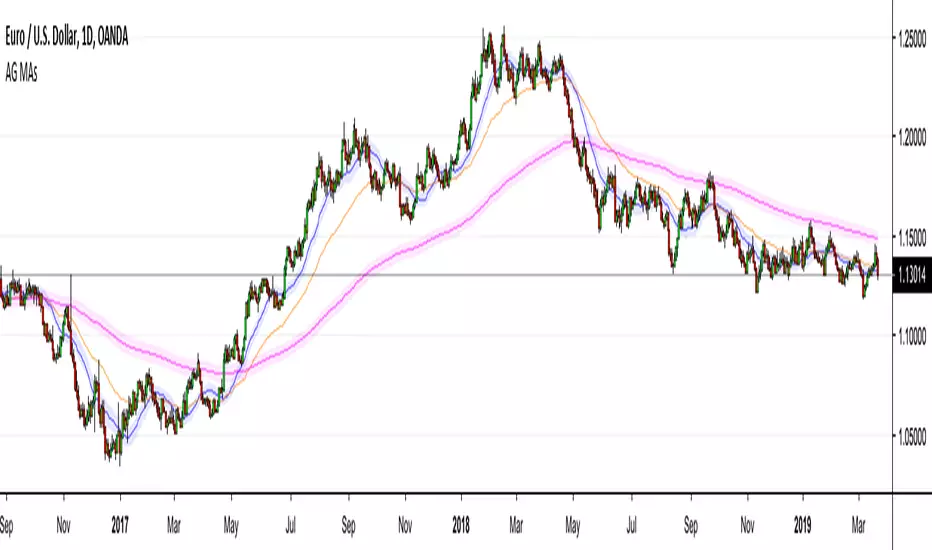
AG Moving Averages w/ BandsThis is an indicator that we built from a few simple ideas: display more than one Moving Average, display the Moving Average "Band" (more below) for each Moving Average, and allowing toggle between SMA/EMA - all in the one indicator.
The Moving Average "Band" is creating using Moving Averages (SMA/EMA) with High and Low as sources. The combination of the MA(Close), MA(High), MA(Low), creates a "Band" for each MA length - which we have found to be very helpful in our Moving Average studies.
The example in the chart above is EURUSD with 20SMA (with Bands), 55EMA (without Bands), 200EMA (with Bands). As you can see, the Bands do a better job than MAs alone for capturing price movement and acting as larger dynamic Support/Resistance zones.
Everything in this indicator is fully customizable, from which MAs to show, to those MA lengths, whether to use SMA/EMA for each individual MA, and whether to display the MA "Band" for each individual MA.
We hope you find it as useful as we have!
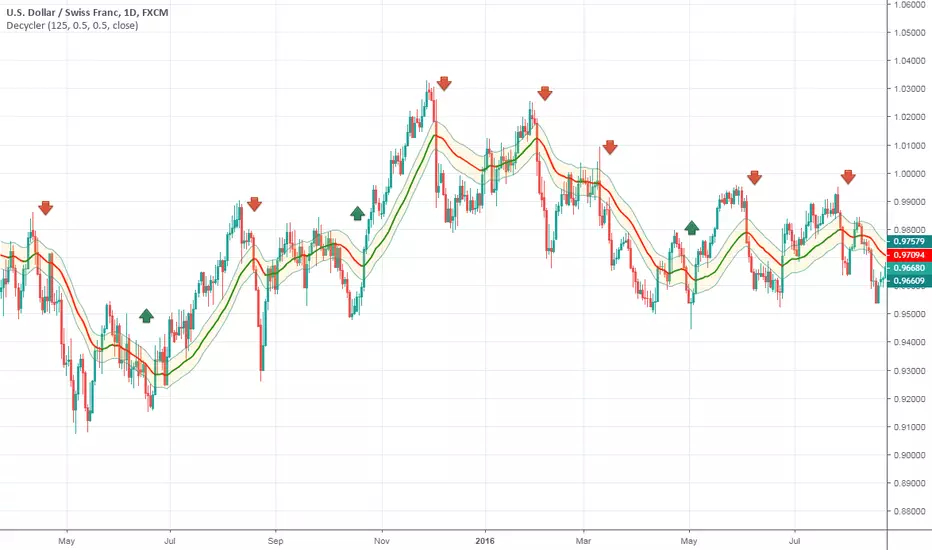
Ehlers Simple DecyclerThis indicator was originally developed by John F. Ehlers (Stocks & Commodities, V.33:10 (September, 2015): "Decyclers").
Mr. Ehlers suggested a way to improve trend identification using high-pass filters. The basic smoothers like SMA, low-pass filters, have considerable lag in their display. Mr. Ehlers applied the high-pass filter and subtracted the high-pass filter output from the time series input. Doing these steps he removed high-frequency short-wavelength components (the ones causing the wiggles) from the time series.
As a result he got a special series of the low-frequency components with virtually no lag - the Decycler.
The Decycler is plotted with two additional lines (the percent-shifts of Decycler) and together they form a hysteresis band.
If the prices are above the upper hysteresis line, then the market is in an uptrend . If the prices are below the low hysteresis line, then the market is in a downtrend . Prices within the hysteresis band are trend-neutral .
RSI ATR ChannelDraws a channel based on ATR (Average True Range) and RSI. Detects band touches and colors the background appropriately.


Arbitrage Novice BandNovice Level Bands Shows you a bigger picture of what is happening with the Arbitrage Band.
The Center Line of the Arbitrage Band Must STAY within the Novice Band

ATR BandThe indicator is intended to be used with daily or higher time frames.
Options:
Mark out of Band: show a symbol if price has moved beyond the band

ATR BandThe indicator is intended to be used with daily or higher time frames.
Options:
Mark out of Band: show a symbol is price has moved beyond the band

ATR BandThe indicator is intended to be used with daily or higher time frames.
Options:
Mark out of Band: show a symbol is price has moved beyond the band

Average True Range Overlay - BandPlots a band of width 1 ATR around the midpoint (HL2)
Settings:
- Length of ATR
UCS_TTM - Reversion BandsOk, Here we go - Version 1 of TTM Reversion Band goes live.
Link to TTM Reversion Band - www.tradethemarkets.com
Link to TTM Reversion Band Guide - kb.simplertrading.com
John Carters Mastering the trade - www.amazon.com
For the amount of information this has, the price tag is not hefty.
John's RTM Chapter Synopsis - www.tradethemarkets.com
What did I modify?
1. Automated the Daily + and Intraday settings. So Switching to intraday will change the setting automatically.
2. Added text callouts for RTM condition
a. John Carter's Indicator
b. Slope Based (my addition).
Future Improvement Planned.
1. Will Convert this into a system based on John's Indicator from TS.
2. Custom Options for Slope and MA setting for Trade filter.

[RS][JR]RSI Price BandsRSI Price Bands
By Ricardo Santos and JR
Have you ever wondered what RSI would look like as a Band? Well here it is. First premier Trading View special, RSI Price Band. Red shows overbought and Green shows oversold. You can also adjust what levels you prefer for overbought and oversold, and what additional RSI lengths you would like to see displayed on the chart..

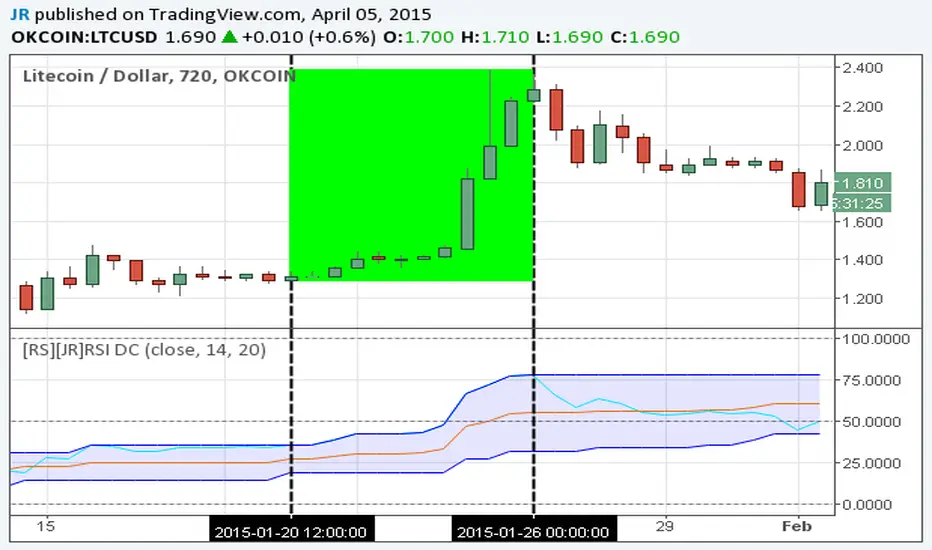
[RS][JR]RSI Donchian ChannelsRSI Donchian Channels
Built by Ricardo and JR
Here is a great indicator to use for strong trends. Donchian Channels react immediately to changes in the highest high and lowest low. For strong trends you want to trade when RSI is set along the upper or lower DC-RSI envelope. When the RSI releases from the DC-RSI envelope, you can take the trade off.
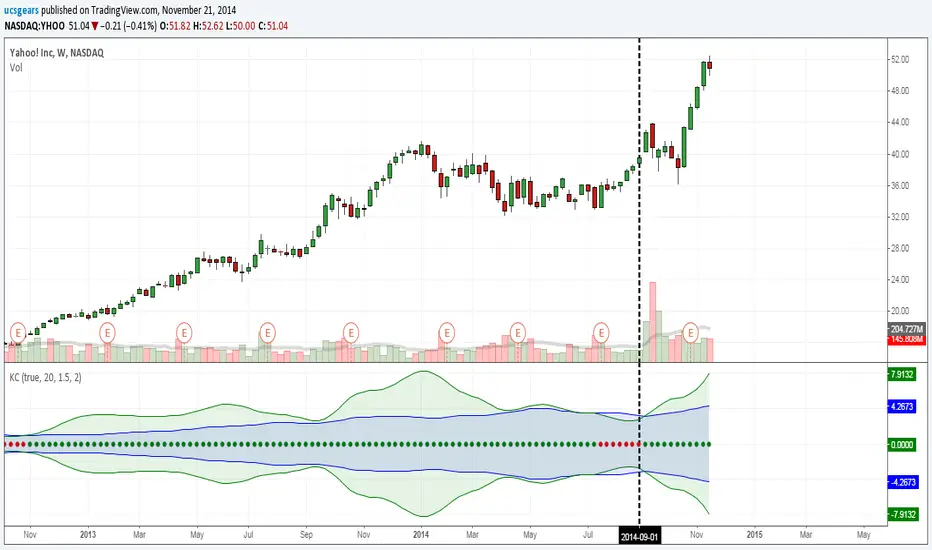
UCS_Squeeze_Timing-V1There is an important information the Squeeze indicator is missing, which is the Pre Squeeze entry. While the Bollinger band begins to curves out of the KC, The breakout usually happens. There are many instances that the Squeeze indicator will fire, after the Major move, I cant blame the indicator, thats the nature (lagging) of all indicators, and we have to live with it.
Therefore pre-squeeze-fire Entry can be critical in timing your entry. Timing it too early could result in stoploss if it turns against you, ( or serious burn on options premium), because we never know when the squeeze will fire with the TTM squeeze, But now We know. Its a little timing tool. Managing position is critical when playing options.
I will code the timing signal when I get some time.
Updated Versions -