BB+AO STRATto be used with AO indicator, based on forex strat --
www.forexstrategiesresources.com
works on 1/3/5/15/30 candles, buy signals are best when the black 3 fast ema crosses up through the red mid band
Индикаторы Билла Вильямса

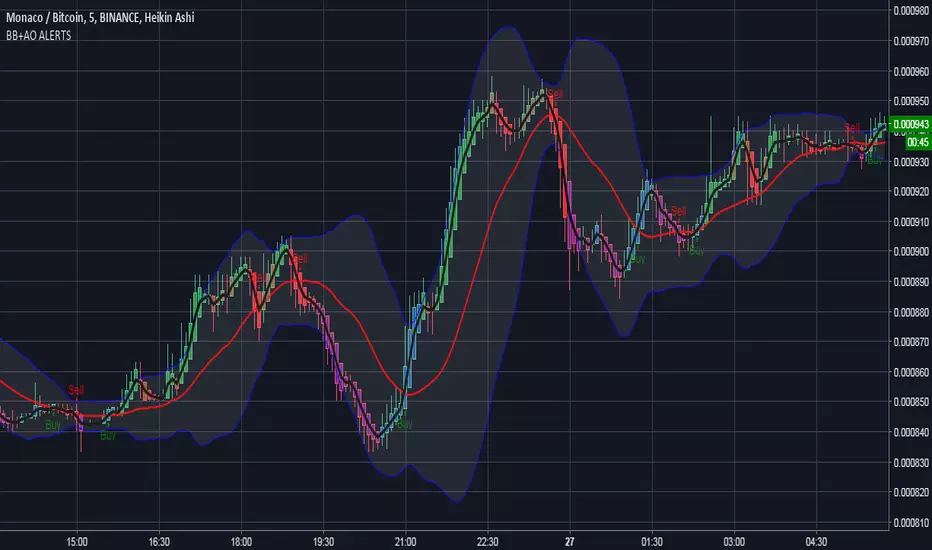
BB+AO ALERTSto be used with AO indicator, based on forex strat --
www.forexstrategiesresources.com
works on 1/3/5/15/30 candles, buy signals are best when the black 3 fast ema crosses up through the red mid band
BB+AO STRATto be used with AO, based on forex strat --
www.forexstrategiesresources.com
works on 1/3/5/15/30 candles


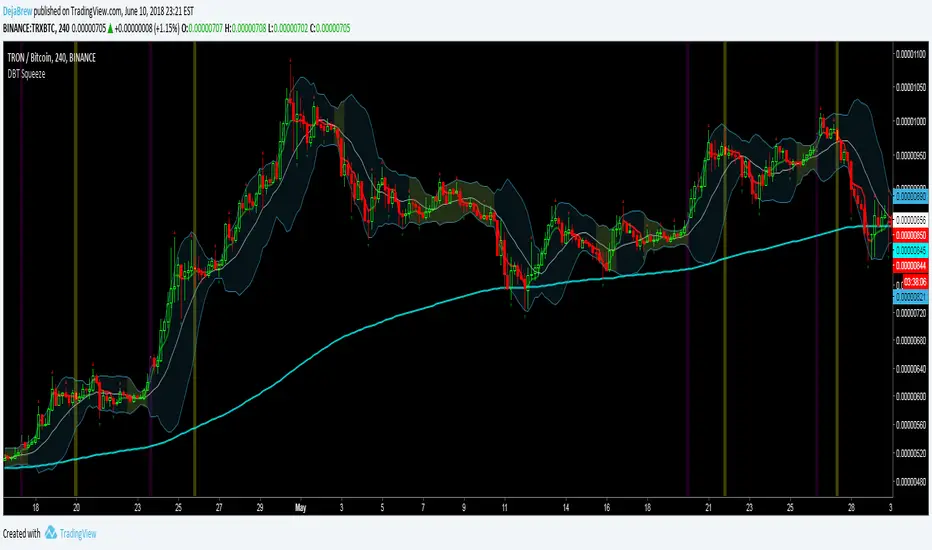
DBT SqueezeThe DejaBrew Trading Squeeze is an indicator designed over years of trading volatility. It uses Bollinger Bands to determine areas of low volatility, signified by the yellow shading of the squeeze. Then it takes into account CCI values to determine a breakout incoming. This indicator also has VWAP, 200 ema, and Williams Fractals built in.
To use this indicator first determine a time frame that does not give a large amount of signals (it was designed to work best on the 5min but has been tested and works great on all time frames above 5min). Once a time frame is determined then look for Bollinger Band squeezes signified by yellow shading. Once the squeeze is determined wait for a purple or blue buy candle to signal (purple are stronger signals). Once a buy candle has signaled evaluate price action, if bullish and supported by other indicators then either take an aggressive entry on the buy candle or wait for a pullback no greater than 50% of the buy candle. Once your position has been established place a stop loss at 1% or below the 200ema and VWAP if possible, no greater than 3% is recommended. Target a 3% gain or wait for the Yellow Sell Candle to close most or all of your position.
Do not take buy candles in extremely bearish markets. Purple Buy Candles are much stronger than blue because they are above the 200ema signifying a bullish trend. Do not take every buy candle if market is choppy and giving a lot of signals. Pair this indicator with a Commodity Channel Index (50) for the best signals. When the CCI is stable and not choppy the buy candles will be much more accurate. Do not take buy candles if the CCI is very choppy.
Use at your own risk. This is not financial advise and this indicator is not guaranteed to make you profits. Please message me if you have any questions or feedback. Enjoy.
DO NOT ASK FOR ACCESS. THIS INDICATOR WILL BE AVAILABLE ON MY WEBSITE ONCE IT RELEASES.
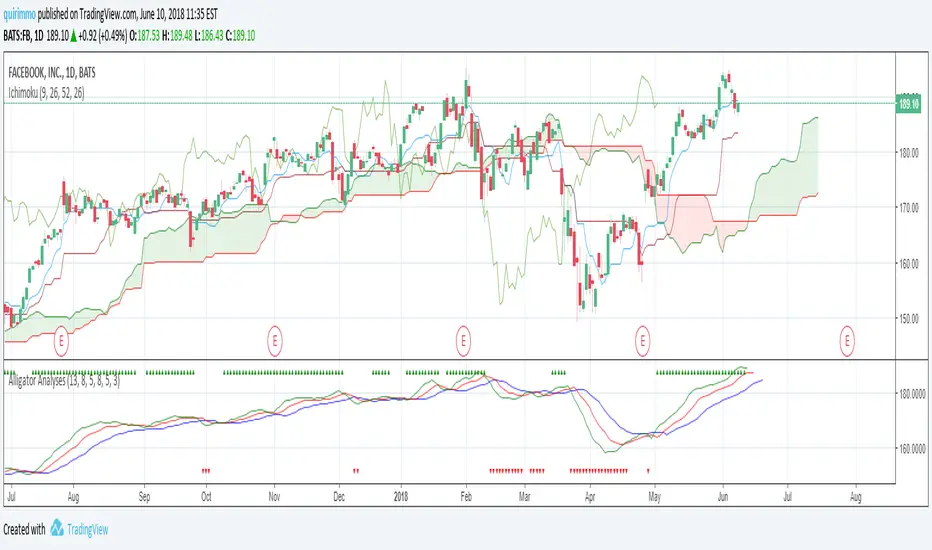
Alligator AnalysesA simple script in order to plot the Alligator Indicator with triangles plotted on the graph in order to see directly if the alligator is sleeping or eating.
You will see green up triangles when the alligator is bullish eating, while red down triangles when the alligator is bearish eating.
You will not see anything on the chart when the alligator is sleeping.


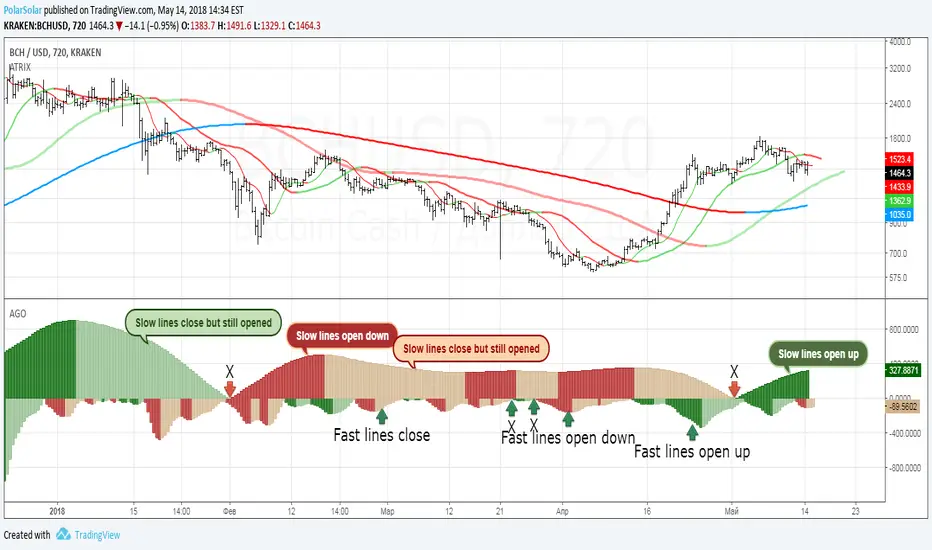
ATRIX Momentum OscillatorAMO is a part of Atrix trade system. TTC v2 replacement.
Highly recommend to use with Atrix (Alligator on TRIX).

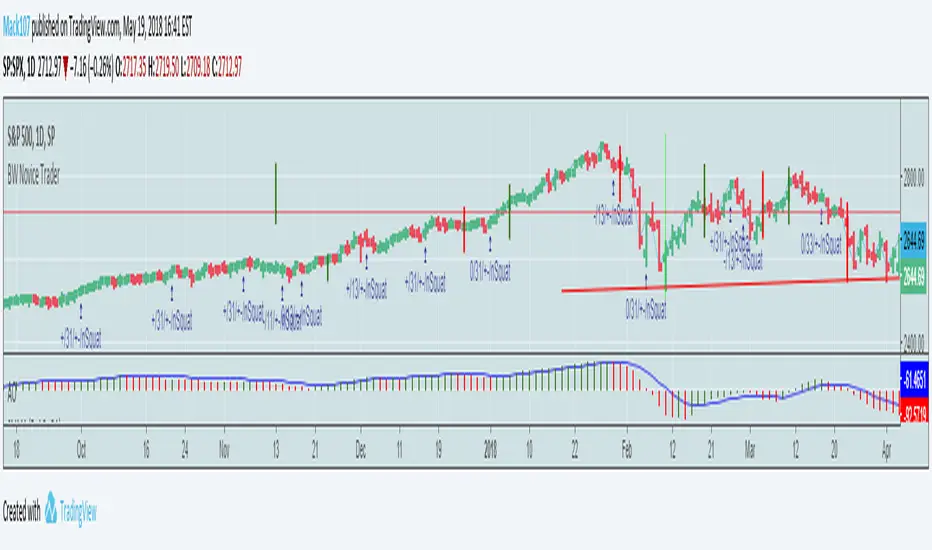
Bill Williams Trading Chaos Vol 1-NoviceThis is a revision of a script developed by tekolo. I hope tekolo takes a look. The concepts are here but I struggle with pine. I am very much a novice, but I tried to put information from the original book, Trading Chaos, Volume One by Bill Williams. There are too many plots to get this to wor. I made a lot of plot lines into comments to get it to run. I'm hoping someone with an interest in this material and some programming skills will be kind enough to take these thoughts and put them in a script that the Pine Editor would actually run. Thanks for taking a look. I do believe in these leading indicators. This is information included for Novice Level Trading in the Bill Williams book. There are more indicators developed in his material, but the jest is that Price is an end result of the marketplace. Market participation (Volume), Market Bias (Momentum), Increased Participation and Bias (Acceleration) all preceed the formation of the Trend. This along with Elliott Wave interpretation using his indicators as a basis for locating key points of the Elliott Wave, are most of what I understand about this interesting man's work. Again, I am a novice at all of this, but the leading indicators that result in price seem interesting. Thanks!

ATRIX Gator OscillatorAtrix implementation of Gator Oscillator . Part of Atrix trade system (ATRIX & TTC v2)
Paid only subscription - $20/mo (accept crypto currencies). You can get a free 24h trial. Just write me PM with request.
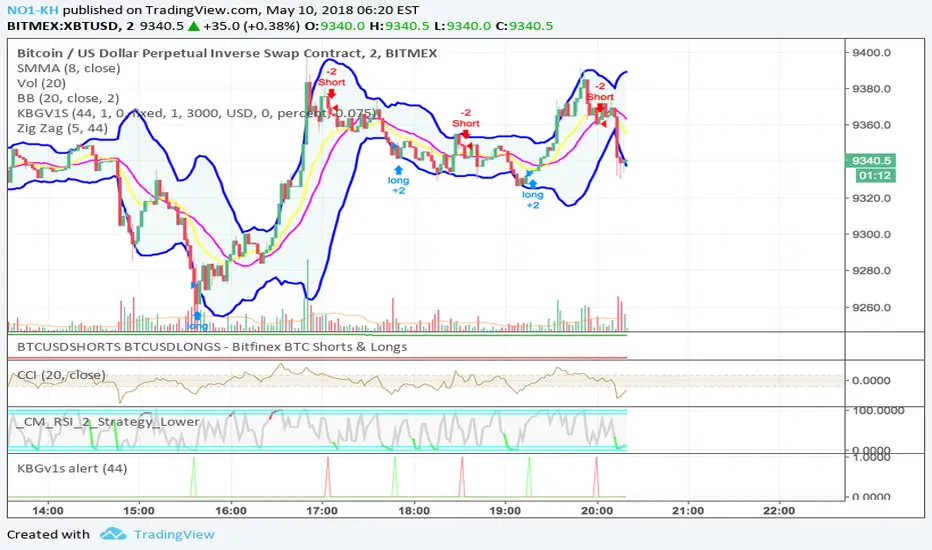
KBGV1S Very short!! This is God!!!It is optimized for 2 minute chart.
Transaction fee is 0.075% and back test result.
This is God.
The fee is 0.05 btc per month.
1PcHm9f8E1zwSUrDsLG1qrygZBwF3TV1N9
After payment, please send PM with transaction number.
BITMEX:XBT
Alert messages are also provided.

Market Facilitaion Index (coded by NGH)The indicator endeavors to establish the effectiveness of price movement by computing the price movement per volume unit. This is accomplished by subtracting the days low from the high and dividing the result by the total volume.
More info : en.wikipedia.org
