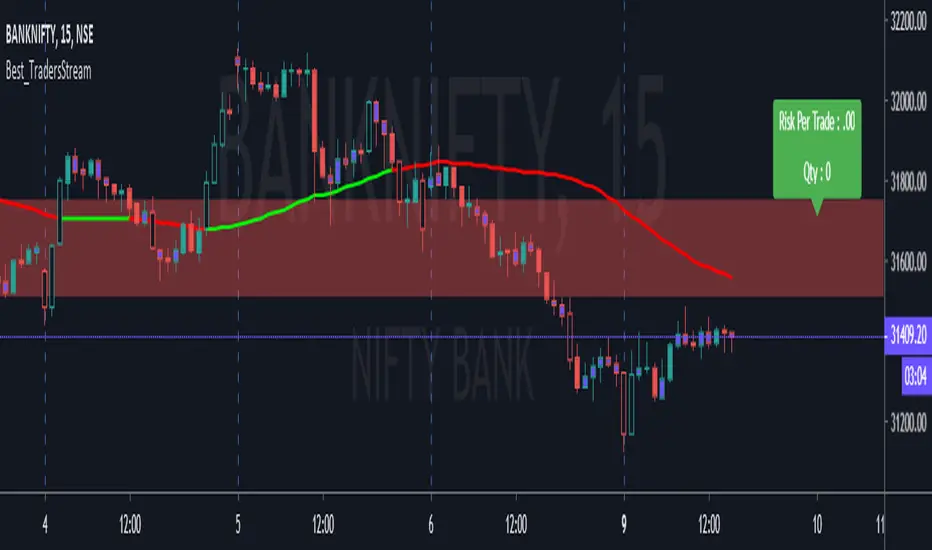
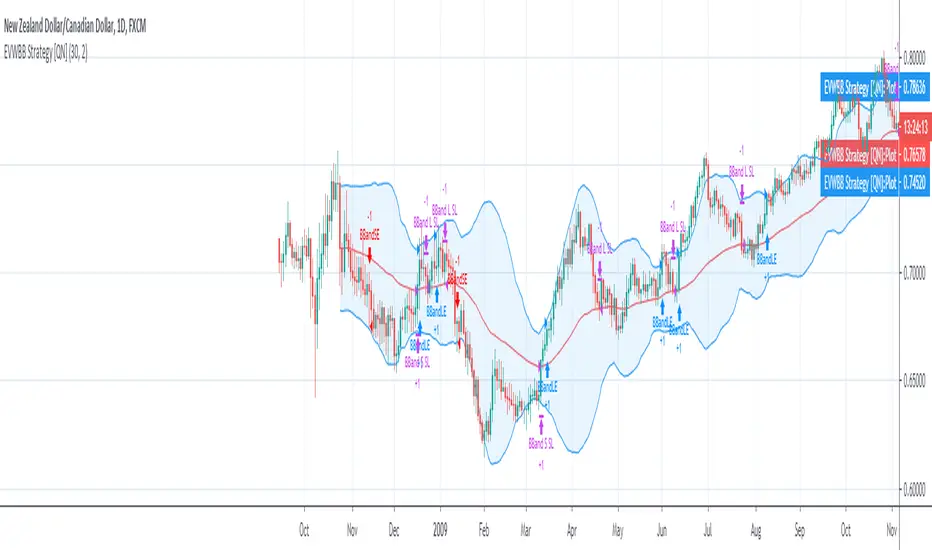
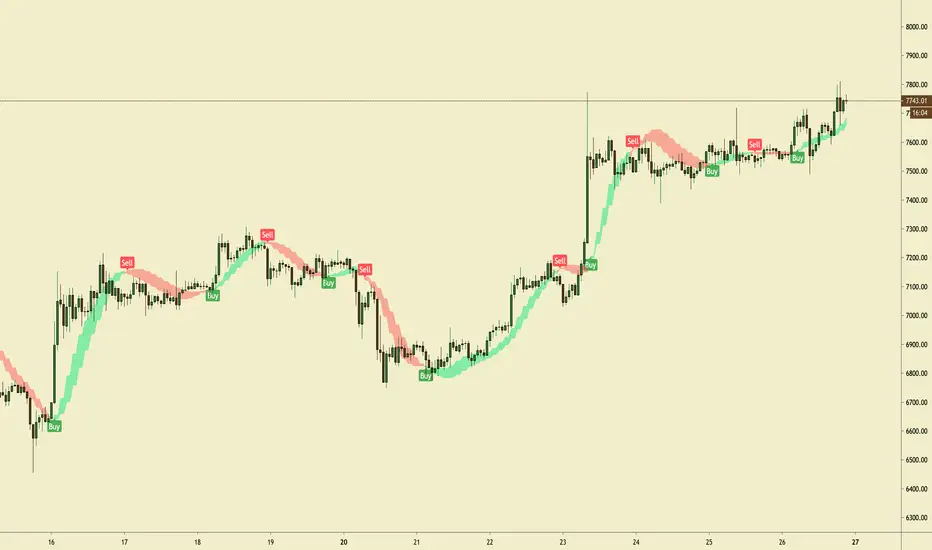
This adds volatility bands to the Variable Index Dynamic Average (VIDYA). The bands are calculated using the exponential moving average of the standard deviation of the VIDYA. Thanks to everget for programming the VIDYA for tradingview.
Orginal VWAP script is from neolao, so big thanks to him. Took the VWAP, added the Bollinger and Keltner channel squeeze. Also there is a criteria of Bands width. Great tool to predict fast large moves within short periods of time. Tried to keep the charts as clean as possible and easy to read. If there are any questions Ill be happy to help or answer them.
Volume weighted %BB Based on Closing price (green line) %BB of 50 period ema of the 20 period volume weighted moving average at each point (blue) difference of %BB green - %bb Blue shading around mid-band (ie width between two in band terms) added an additional line which is the sum of the absolute distance from mid-band of the ema + top half of bandwidth difference
Double Bollinger Bands with dynamic pressure indications
Bollinger bands with volume-weighted statistics (volume weighted moving averages & variance/standard deviation) to give better results during high-volume events, and also aims to provide additional information without adding clutter by coloring the bands. Intended as the first basic indicator to be thrown on a chart. Will never annoy you by rescaling log charts...
Before I go through this chart I want to acknowledge the great programmers who spent much of their time and effort to assist many TV users and traders. Thank you to LunaOwl for the RSI American lines her script made me realize the need to have trendlines, supports, and resistance on RSI charts. Also, a copy of Lij_MC code from was taken which had been credited...
Analogous to Bollinger bands but performs all computations on the logarithms of the values. Unlike the regular bollinger bands (or most other variations of them available on tradingview), these won't annoy you by rescaling the chart when you try to look at the Bitcoin weekly chart or any other chart with strongly exponential behaviour, and the moving average is...
Easy Loot Bollinger Bands: This indicator is a bollinger band that also auto-generates a trendline, giving you the best opportunities to buy & sell. That's it. You can use this on any time-frame, any stock, and any cryptocurrency.
Free users have many restrictions on their use in TradingView. I put together a lot of indicators I use often. 5 moving average 1 parabolic SAR 1 bollinger band 1 ichimoku cloud (but it's only cloud) as always It's open source. enjoy!
This Indicator is a combination of Super Smoother Filter and Bollinger Bands %B. This Indicator is used in Trend-Momentum gauging. Use this indicator with Turtle Oscillator.
This scripts compiles many indicators into one. It comes from many sources and i added all sources i used. If i forgot one, don't hesitate to message me. This is useful if you need to setup your chart layout fast. The menu makes it easy to configure it. You can configure and display: - Various types of moving averages: RMA, SMA , EMA , WMA , VWMA , SMMA , HullMA,...
This script allows you to catch trend moves between BB critical levels (red and green zones on the chart) and very good for daily scalping ether for bitcoin or any altcoins to USDT or BTC trading pairs. Probability is very HIGH.
Mostly based on MACD analysis this trend indicator accurately shows you when main trend changes. It has LONG and SHORT labels and you can use it with tradingview alerts to be in touch and for automated trading bots. You can use it both with margin(bitmex, bitfinex, etc) and main exchanges (binance and more) with bitcoin for now and soon for alts also.
It can helps you to see BB pivots . It's based on bollinger bands . Best Settings: (20,3) - (50,2) Cheers :)
It is a conservative strategy that works in bitmex in a 15-minute time frame, identifies an oversold market and sells on the rebound It has a modifiable takeprofit and stoploss but works fine as it is set by default Only Longs