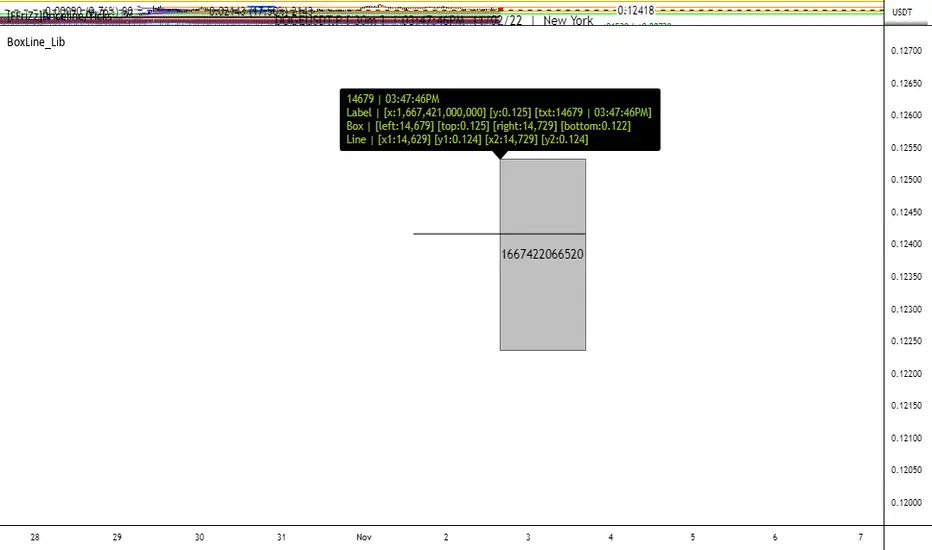
BoxLine_LibLibrary "BoxLine_Lib"
personal Library for line and box built in functions
lineXY(x)
get x1,y1,x2,y2 in a tuple
Parameters:
x : TODO: line
Returns: tuple of x1,y1,x2,y2
line(x)
Create line with only the y1 value(when line == na) or all
when line != na set x1,y1,x2,y2 individually just 1 or all
- use just the line value to set the x2 to current bar or time will set to time
- will auto pick xloc.bar_index or xloc.bar_time if not used
Parameters:
x : (line line,int x1,float y1,int x2,float y2,
string xloc,string extend,color color,string style,int width)
Returns: Line
boxXY(x)
get left,top,right,bottom in a tuple
Parameters:
x : box
Returns: tuple of left,top,right,bottom
box(x)
Create line with only the top,bottom value(when line == na) or all
when box != na set left,top,right,bottom individually just 1 or all
- use just the box value to set the right to current bar or time will set to time
- if right is above a number that a bar_index wouldnt be
Parameters:
x : box box,int left,float top,int right,
float bottom,color border_color, int border_width,
string border_style,string extend,string xloc,
color bgcolor,string text,string text_size, color text_color,
string text_halign,string text_valign,string text_wrap)
Returns: TODO: Box
BOX
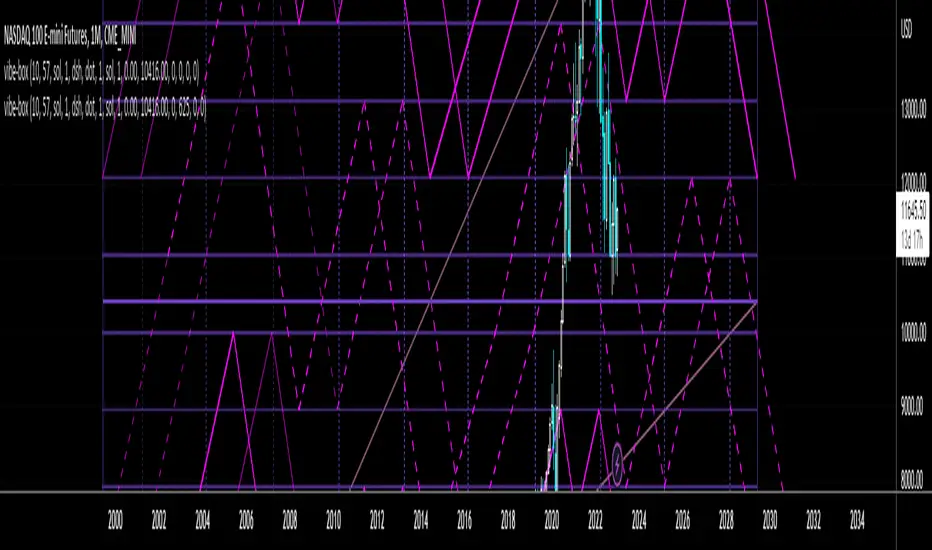
Vibration BoxFirst Public release of the Vibration Box
WARNING - THESE CYCLES CANNOT PREDICT PERFECT "UP & DOWN" MOTION
There is absolutely no guarantee that these cycles will predict perfect "up & down" motion for the markets
Please be aware that this tool is to be used with a robust risk management system
These cycles are representative of "circle geometry within a square of price & time"
Slowly, I will build up some ideas to go along with this script so that you can learn to apply it to many different markets in many different ways
Those familiar with the work of W.D. Gann should be able to utilize this tool in many different ways
Instructions:
Place the box down with 2 mouse clicks (first is for bottom left corner & second is for top right corner)
NOTE: DUE TO TRADINGVIEW LIMITATIONS
-There is a maximum of 12 divisions for your box/vibration (I will work on increasing this number)
-You MUST choose a coordinate that is within the price action that has already occurred
-You CANNOT initially place the box BEFORE THE FIRST BAR of data
-You CANNOT initially place the box BEYOND THE LAST BAR of data
THEN, ONCE YOU HAVE PLACED THE BOX FOR THE FIRST TIME
YOU CAN MANUALLY ADJUST THE DATES WITHIN THE SETTINGS TO PLACE THE BOX IN ANYWAY YOU WOULD LIKE!
DeleteArrayObject█ OVERVIEW
Delete array object according to array size such as label, line, linefill, box and table.
█ CREDITS
HeWhoMustNotBeNamed

[VC] Box Chart Index V1.0The ''V.C Box Chart Index'' shows the shortest possible wave. It graphically shows the continuous up movement or continuous down movement in the form of a box. As soon as the direction changes, the box changes as well.
It is an effortless way to show the price change that occurred in the box visually. It also correlates to what Wyckoff said about as the buying waves increase in volume, time, and length & the selling waves shorten, lookout for a change in the prevailing trend.
The example below shows more big green boxes than red, and the price change caused by the green box has made the uptrend.
Important Note:
V.C Box Chart Index also correlates to another indicator named V.C Box Chart Histogram
V.C Box Chart Histogram draws the cumulative delta based on each box as a histogram. Combining these two indicators empowers you to see the cumulative demand & supply and buying & selling quantity of each box.
See the Example Blow:
The above example shows that supply is decreasing on down boxes, indicating that fewer sellers are left to pull the market down.
On the other hand, demand increases on the up boxes, indicating that more buyers are coming into the market. As a result, every green box is breaking the previous high & price is moving upside.
For a more comprehensive understanding of the co-relation of these two indicators, read the description from the link below.
V.C Box Chart Index Settings & Properties Explained
Border of Box:
Allow you to show/hide the border of the box
Positive Box & Negative Box Borders:
Allow you to change the border color & opacity
Positive Box & Negative Box:
Allow you to change the color & opacity of the box
Disclaimer Note:
V.C Box Chart Index is not a BUY/SELL signal based indicator or a holy grail trading system.
It is purely Volume, Delta, Orderflow, Demand & Supply imbalance and comparative analysis based indicator tool kit. Before applying this indicator to your analysis, you should know about Volume, Delta & Spread, and Demand & Supply.
Some basic understanding of Sir Richerd Wyckoff's Theory can also be helpful.

Morningstar Equity Style Box HeatmapStyle boxes are a classification scheme created by Morningstar. They visually provide a graphical representation of investing categories for equity investments. A style box is a valuable tool for investors to use when determining asset allocation.
There are 9 categories:
Large Value, Large Blend, Large Growth
Medium Value, Medium Blend, Medium Growth
Small Value, Small Blend, Small Growth
The strength of the 9 categories are found by using 9 Vanguard ETF's that follow the respective CRSP index of their category.

The 20MA gameThis indicator shows us if the price is moving up or down based on the 20MA of the 20MA.
If the line is green then this indicates that the price is moving up, and if red the price is moving down.
How to use:
Not applicable here because its all about the 20MA.
Markets:
It can be used to all markets.

BTC 1D Safety tradeImportant: use only the BTC/USD pair on the 1D timeframe
The indicator is designed to determine the zones for entry to buy or sell, as well as for closing deals.
The indicator is based on a moving average with a period of 12.
The parameters are not changeable, since the optimal settings (Safety trade) were used for the BTC/USD pair on the 1D timeframe.
The code is open, please change it according to your parameters.
Upper zones for closing long or opening short.
Lower zones for opening long or closing short.

ObjectStackLibrary "ObjectStack"
init()
push()
push()
push()
push()
push()
nextIndex()
nextIndex()
nextIndex()
nextIndex()
nextIndex()
delete()
delete()
delete()
delete()
delete()
cleanOldest()
cleanOldest()
cleanOldest()
cleanOldest()
cleanOldest()
Ichimoku (Cloud + Box + Prediction)In addition to Ichimoku, this indicator includes Ichimoku boxes and Ichimoku prediction indicators.
You can select the base candle with the mouse and drag it and drop.
Three boxes are drawn with periods 9, 26 and 52 and it is possible to change periods.
Prediction boxes can be drawn on the right side of the candle for the three mentioned periods .
Target prices can be shown in the borders and centers of boxes.
It is possible to change the thickness and color of the boxes.
Three boxes can also be seen in the last candle of the chart.
Ichimoku lines including Tenkansen, Kijunsen, Senko, Chikou, Quality and Kumo Cloud can be displayed on the chart.
The points corresponding to each Ichimoku line represent the value of different lines in the base candle
The crossing points of the Tenkansen and Kijunsen lines can be displayed in the chart
Predictions of the amount of Tenkansen and Kijunsen in future candles can be seen on the chart.

AG FX - Pivot PointsPivot Points High Low
Definition
The Pivot Points High Low indicator is used to determine and anticipate potential changes in market price and reversals. The Highs referred to in the title are created based on the number of bars that exhibit lower highs on either side of a Pivot Point High, whereas the Lows are created based on the number of bars that exhibit higher lows on either side of a Pivot Point Low.
Calculations
As mentioned above, Pivot Point Highs are calculated by the number of bars with lower highs on either side of a Pivot Point High calculation. Similarly, Pivot Point Lows are calculated by the number of bars with higher lows on either side of a Pivot Point Low calculation.
Takeaways and what to look for
A Pivot Point is more significant or noteworthy if the trend is extended or longer than average. This can mean if a trader selects a higher period for before and after the Pivot Point, the trend could be longer and therefore prove the Pivot Point itself more notable.
Additionally, Pivot Points can help a trader assess where would be best to draw. By analyzing price changes and reversals, a trader has more of an ability to determine and predict price patterns and general price trends.
Summary
The Pivot Points High Low indicator can predict and determine price changes and potential reversals in the market. Pivot Points can also help traders identify price patterns and trends, depending on the period and significance of the Pivot Point value.

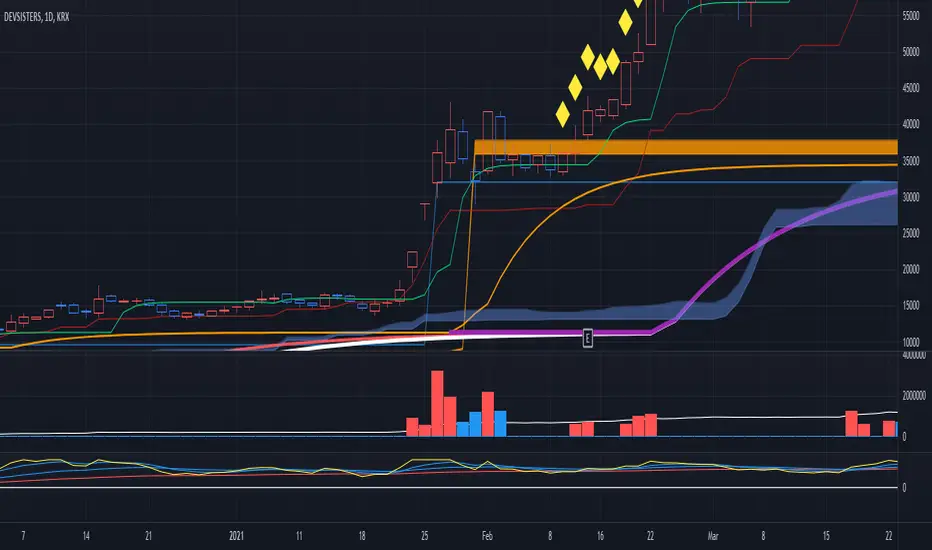
Beakdoo swing trading boxHi forks,
I'm trader Baekdoosan who trading Equity from South Korea. This Baekdoo swing trading box indicate good buying position when it crossover the box.
Here's the ideas
1. It needs to crossover 1 month highest value and higher than 5 ema and 20 ema line
2. It also needs to crossover 1 month volume as well
3. Once 1,2 soaring candle emerge, it needs to correction time
4. 5 ema or 20 ema or center candle's 2/3 point x 0.95 (5% lower) would be the resistant line
5. center candle's 2/3 point line would be the buying point (you may can trade when it cross over
you can check above example chart and take a look what you have interested in.
hope this will help your trading on equity as well as crypto. I didn't try it on futures . Best of luck all of you. Gazua~!
Box-Cox Log BandsExperimental:
Uses the Box-Cox Transformer with a deflection on the inversion to create log bands.
to be used in log scaled charts.

FunctionBoxCoxTransformLibrary "FunctionBoxCoxTransform"
Methods to compute the Box-Cox Transformer.
regular(sample, lambda) Regular transform.
Parameters:
sample : float array, sample data values.
lambda : float, scaling factor.
Returns: float array.
inverse(sample, lambda) Regular transform.
Parameters:
sample : float array, sample data values.
lambda : float, scaling factor.
Returns: float array.

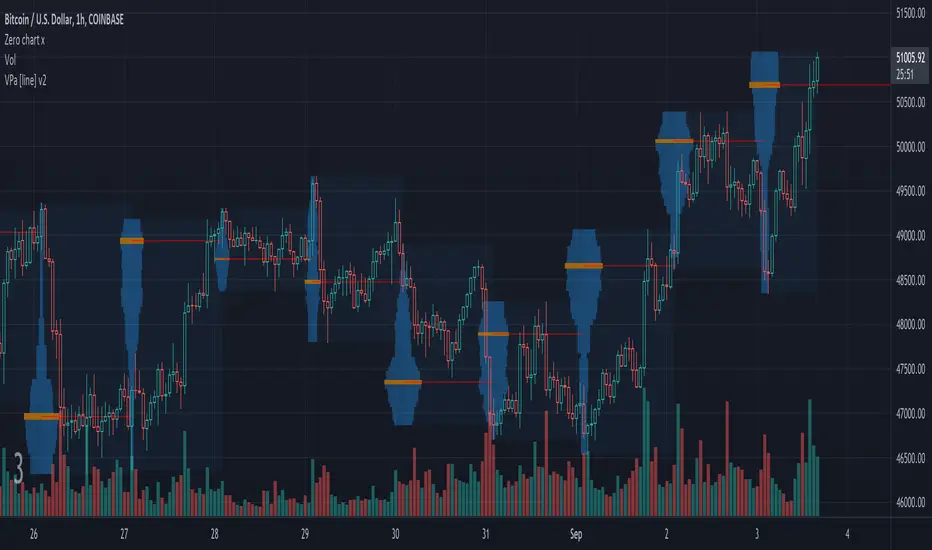
Volume Profile Auto [line]This project is about:
- VPSV
- array.new_line()
- array.new_box()
VPSV (pine) is one of the rare features that draws lines/figures BETWEEN bars
It doesn't run on Pine script, which makes it possible to do such things.
I wanted to have something similar while a restriction of Pine script is the impossibility to draw between bars, the only way I could think of is by using line width
In this script the higher timeframe is started with several lines (left) and a box, this box goes further until the higher timeframe ends.
During the creation of the box, each candle (lower timeframe) in this box (higher timeframe - period) is checked for position and volume, the volume is added to the left line, so when you see a thicker line, this means at that level there is more volume traded.
One of the big differences with other volume profiles is that many look back to a previous period, here when a period starts, the lines collect data - volume until the period ends, it is especially very visible in very low TF's (seconds)
This is my first script with array.new_line() - array.new_box(), which is a very nice Pine feature!
I hope this script can be helpful to see the possibilities
Settings:
'Parts' -> amount of lines (left of box)
5 Parts:
15 Parts:
25 Parts:
50 Parts:
'Max Width' -> Sets the max width of the lines
'Automatic Settings' -> Sets the higher time frame automatically, see the tooltip ⓘ for more info
The yellow line is the max volume line of that period, last period has a red line (POC), also referring the max.
Cheers!
KV Box v1.0 - Buy / Sell signalKV BOX is a trading indicator. It combines Darvas box theory (developed by Nicolas Darvas), breakout strategy, multi-timeframe trading and ALMA (Arnaud Legoux Moving Averages). This indicator helps identify BUY signals when the price is in the entry zone and SELL when the price breaks out of the uptrend.
---
How to use?
KV BOX can be used in both SPOT and FUTURE (Long/Short) trading
BUY (LONG):
• Entry: When the BUY signal appears.
• Stop loss: LOWER than LOW of first and second candlestick IN THE BOX WHERE BUY SIGNAL APPEARS of 1H, 4H, 1D timeframe.
• Take profit: When the SELL signal appears.
SELL (SHORT):
• Entry: When the SELL signal appears.
• Stop loss: HIGHER than the HIGH of first and second candlestick IN THE BOX WHERE SELL SIGNAL APPEARS of 1H, 4H, 1D timeframe.
• Take profit: When a BUY signal appears.
---
Attention:
KV BOX is only displayed on 1H, 4H and 1D timeframe. 1H for short-term trades (a few days), 4H for mid-term trades (a few weeks), 1D for long-term trades (weeks to months).
---
Options setting:
- Kelvin box on: KV BOX activates
- ALMA mode on: KV BOX activation according to Arnaud Legoux Moving Average (ALMA) method
- Pinbar indicator: activate the indicator when the pinbar candlestick appears
- Supertrend: trend continuation or reversal indicator
============================
KV BOX là 1 chỉ báo mua / bán kết hợp giữa nguyên lý hộp Darvas, phương pháp phá vỡ (break out), giao dịch đa khung thời gian và đường trung bình ALMA (Arnaud Legoux Moving Averages). Chỉ báo này giúp xác định tín hiệu mua khi giá ở vùng entry và bán khi giá phá vỡ khỏi trend tăng (up trend).
---
Cách sử dụng:
KV box có thể dùng trong giao dịch SPOT và FUTURE (Long/Short).
Mua khi có tín hiệu BUY, bán khi có tín hiệu SELL.
MUA:
• Entry: Khi có tín hiệu BUY.
• Cắt lỗ: thấp hơn giá thấp nhất cùa 2 nến đầu tiên trong hộp xuất hiện tín hiệu BUY của khung 1H, 4H, 1D.
• Chốt lời: Khi có tín hiệu SELL xuất hiện.
BÁN:
• Entry: Khi có tín hiệu SELL.
• Cắt lỗ: cao hơn giá cao nhất của 2 nến đầu tiên trong hộp xuất hiện tín hiệu SELL cùa khung 1H, 4H, 1D.
• Chốt lời: Khi có tín hiệu BUY xuất hiện.
---
Chú ý:
KV BOX chỉ hiển thị trên khung 1H, 4H và 1D. 1H cho giao dịch ngắn hạn (vài ngày), 4H cho giao dịch trung hạn (vài tuần), 1D cho giao dịch dài hạn (vài tuần đến vài tháng).
---
Tùy chọn setting:
- Kelvin box on: kích hoạt KV BOX
- ALMA method on: kích hoạt KV box theo phương pháp Arnaud Legoux Moving Averages (ALMA)
- Pinbar indicator: kích hoạt chỉ báo khi xuất hiện nến pinbar đảo chiều
- Supertrend: chỉ báo xu hướng tiếp diễn hoặc đảo chiều

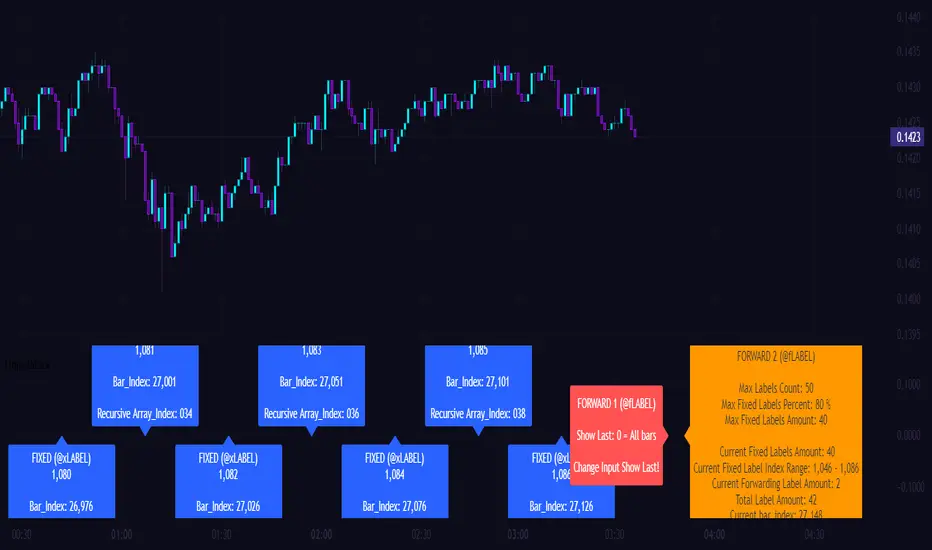
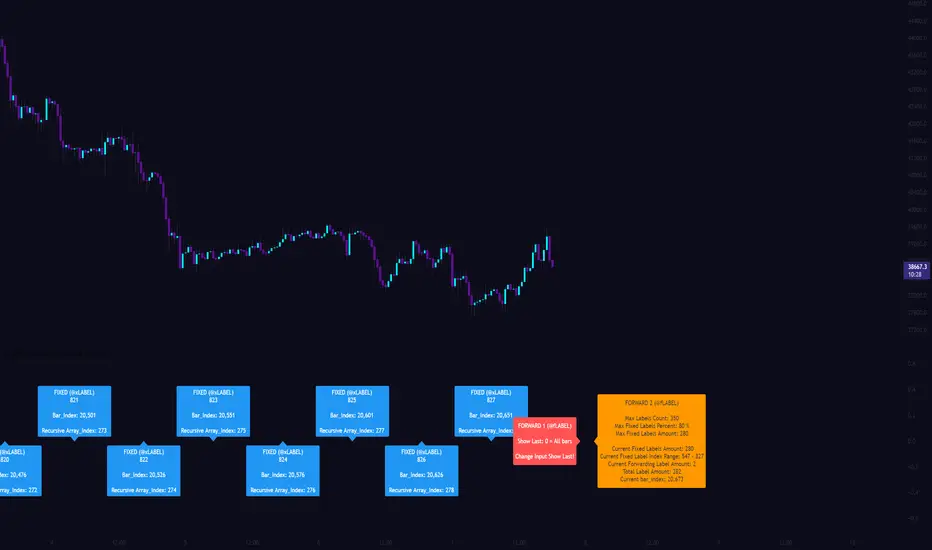
[CLX][#03] Object-Stack (Labels/Lines/Boxes)This script shows an example of how to manage objects (lines/labels/boxes) and prevent the need of garbage collecting and missing objects.
You only have to push your object into the right array.
*_FIXED (left-lock) or *_FORWARD (right-lock)
We hope you enjoy it! 🎉
CRYPTOLINX - jango_blockchained 😊👍
Disclaimer:
Trading success is all about following your trading strategy and the indicators should fit within your trading strategy, and not to be traded upon solely.
The script is for informational and educational purposes only. Use of the script does not constitute professional and/or financial advice. You alone have the sole responsibility of evaluating the script output and risks associated with the use of the script. In exchange for using the script, you agree not to hold cryptolinx TradingView user liable for any possible claim for damages arising from any decision you make based on use of the script.
Darvas box (with alerts)Darvas box by Nicholas Darvas, extended original script by KıvanÇ @fr3762 to use new PineScript v4 function box.new()
You can create alerts with this script when price break to the upside or downside from Darvas box


Darvas Box MTF Trend Tracker [LevelUp]The Darvas box theory is based on the work of Nicolas Darvas, author of the book "How I Made $2 Million in the Stock Market". This indicator uses his box theory to help visualize upward trends and find potential opportunities to buy or add to a position.
Darvas was a growth stock trader. After extensive study of historical stock movements, Darvas noted stocks "have a defined upward or downward trend which, once established, tended to continue. Within this trend stocks moved in a series of frames, or what I began to call boxes."
Darvas Box Theory
■ A box defines a high and low range that contains a stock's movement over a period of time.
■ Darvas preferred "lively" stocks that moved up and down within a box. In his research, Darvas noted stocks with these characteristics often had significant moves up.
■ Boxes stacked one after another often indicate a strong upward trend.
■ A potential buy signal is a stock moving past the high of the topmost box with a significant increase in volume.
■ Within the range of a box, Darvas considered movement to the bottom of the range a healthy sign. These moves down shakeout weak holders who sell thinking the downward trend may continue.
Defining a Box:
■ After price makes a new high, there must be three consecutive bars that don't exceed the high.
■ Once the top of the box is set, the same process is used, in reverse, to determine the bottom.
■ Once the high and low are established, a box is drawn over the range of bars.
■ With this indicator, there are two options to determine when a box is complete, that is, when a box is fully enclosed and a new box can be started. The default is when there is a close above or below the high or low of the box. Using the close may provide a better perspective of the overall trend by limiting noise of price movements within a bar. The second option to complete a box is when a bar's high or low goes above or below the boundaries of the box. The preferred option is configurable within the indicator Settings.
Lookback Range
■ The lookback range is used to determine if the current bar has reached a new high, which could indicate the start of a new box.
■ The value specified for the lookback determines how many bars back to compare against the current bar high.
■ You can set the lookback value for intraday, daily and weekly charts.
■ It's recommended to experiment with lookback values across various timeframes to find settings that fit with your trading style.
Suggestions from Darvas:
■ The box theory works best during a strong uptrend, where boxes stack one after another.
■ When breaking through the top of the box, ideally there will be a significant increase in volume. This may be an opportunity to buy or add to a position.
■ Try and hold stocks that are consistently moving up by raising a stop-loss along with the rise.
■ Take losses quickly.
Indicator Features:
■ Box completion can be based on a close above/below the box boundaries or a move above/below the box boundaries.
■ Configure the lookback range for intraday, daily and weekly charts.
■ Configure box borders and background colors.
■ When the last bar is within a box, show an optional breakout price indicating a move above the top of box.

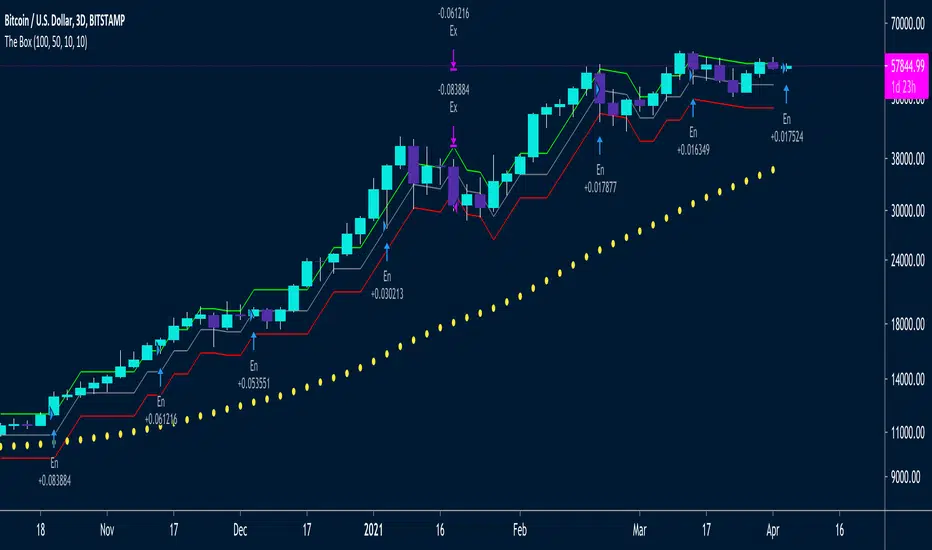
The Box Percent StratHi guys,
Version Zero (more work needed) of an idea I've been meaning to out into a strategy for a while. 🤯
This uses percent boxes🤔 instead of traditional indicators like RSI, MACD etc. 🤫
Takes the first close price of the series and creates a Top Band 10% up, buys if price reaches that level, and puts a stop on a Bot Band, 10% down
When the first trade is in profit by another 10%, it enters another trade and moves the stop of the first trade to breakeven ~ this way it only has one unit of risk at a time
/// Designed for LONG only on Daily, 2D or 3D Charts👌🏻
/// Uses fixed investment risk amount, meaning you're willing to lose that amount per trade
/// Limit buy to not overpay on entries
/// Idea Based on the Darvas system:
/// System only enters trades on strength, when prices equals of exceeds the green line
/// It ads onto the trades, but only *IF* the previous trade is in profit by the UpBoxSize percent size
/// The trailing stop loss is moved up, with the red line
/// A key idea is to only take one unit of risk at a time, meaning for a new add on trade to be taken, the previous trade should be in profit by the same box size as the new new trade's stop loss
/// This will keep adding trades again and again, and they will stop out at the same stop loss
/// Yellow Circles is an MA that filters out choppy areas -- this system only does really well on trending linear markets like: TQQQ, SSO, SPX, SPY
/// Base setting is 10% UpBox Size and 10% DnBox Size: 15% & 15% will be more accurate but fewer signals. 13% profit and 10% stop loss will give a higher risk to reward ratio
Box Range AlertSimple Script for getting alerts on the crossing of Upper & Lower levels either way.
Good for Free users as they can only use 1 alert at a time. So this indicator will be useful to get alerts on both Breakout Or Breakdowns.
Just add input Price manually and set alerts.

Range Box (Nephew_Sam_)Version 1
Creates a box around a specified time range with the ability to extend the lines to a later time.
Next update:
- Background in box
- Remove historical boxes
- Extend lines in future instead of only till current price
There's similar but complex indicators out there, I'll leave this code as open source and you have permission to reuse and not credit me.

Gann Toolbox V2// ========================================================================//
This script is meant to help you save a lot of time plotting your Gann Boxes and Cycles correctly and accurately.
This is a recoded version of "Gann ToolBox V1.5/1.7"
This script allows you to scale your boxes and square them with a simple input in the script's settings "$ per degree".
It includes a few default cycles already built into it ( March and September ) and an advance mode that lets you place the box anywhere you want and create your own custom cycle. through any time period you want.
You get the 1:1, 1:2, 2:1 Gann fan angles at each corner of the box and some additional angles at the midpoint to give you a complete star formation.
Using the Advance mode you can also adjust the length of your custom cycle and the global height increments. Default is 360degrees.
You can also play with the offset values for your cycles.
That's not all, you also get to plot your horizontal lines between each cycle at an increment of your choosing.
Using this script you will be able to plot any cycle that you want with a few clicks & and a few seconds.
in the advance more you could extend the advance custom cycle to engulf future price action.
This script work with all the assets correctly and beautifully from Stocks to Crypto-Currencies.
// ========================================================================//
This script comes with "Gann Seasonal Dates, Gann Planets vs Sun, Moon at Zero" as addons if you decide to purchase it.
// ========================================================================//
My contact information are available and listed below.
Enjoy!
