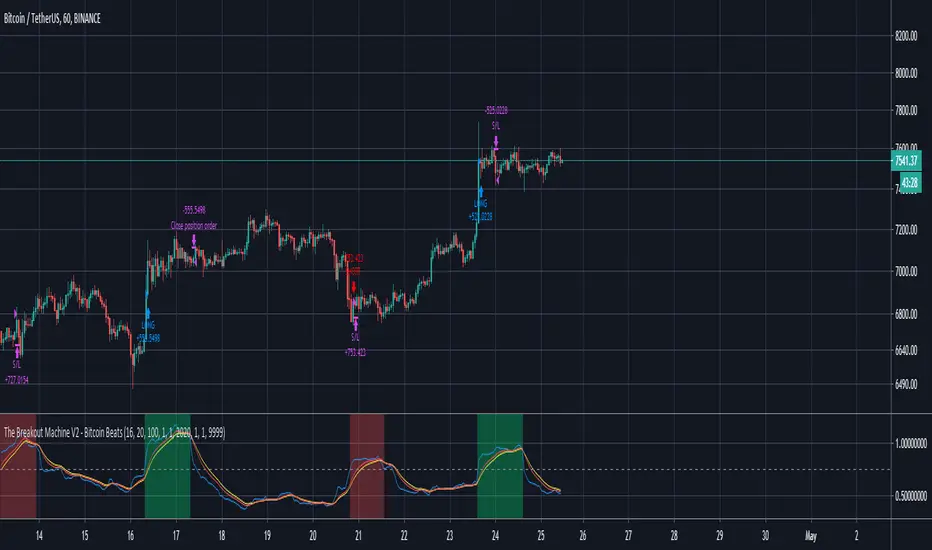
TradewithPuneet: Pro-PatternsThe Pro-Patterns strategy is designed to trade classic chart patterns. At present, it identifies the Ascending Triangle patterns and Weekly Inside Bars patterns and takes Long or Short entries, as the case may be.
Ascending Triangle patterns:
- The strategy identifies ascending triangle patterns ranging from 40 to 120 days.
- BUY signals are generated on the breakout of the horizontal resistance line. No SHORT signal is generated on the breakdown of the rising trend line.
- The importance is given to higher lows, instead of attempting to make a perfectly straight rising trend line. Hence, the drawing of the rising trend line is skipped.
- The strategy gives BUY signals on continuation as well as reversal patterns.
- Users can choose exit rules either on the breakdown of a certain number of days or based on ATR.
- The Ascending triangle patterns can be seen on Daily timeframes only.
Weekly Inside Bars
- The strategy identifies inside bars on weekly charts with three candles. This means, that Weekly Inside Bars pattern is said to be formed when the current week's candle is inside the previous week and the previous week's candle is inside the week prior to it.
- A BUY or SHORT signal is generated next week on breakout or breakdown of high or low of third week’s candle.
- The importance is given to a decrease in volume on second & third weeks’ candles.
- The strategy gives BUY or SHORT signals on continuation as well as reversal patterns. However, users can choose to see trading signals on continuation patterns only.
- Users can choose exit rule on breakdown or breakout of a certain number of weeks in case of BUY & SHORT signals respectively.
- The Weekly Inside Bars patterns can be seen on Weekly timeframes only.
The strategy guides you the price level at which to BUY / SHORT and EXIT. It is intended for short to medium-term traders. It is important for the security to close beyond the trigger point for the signal to remain in force.
Breakdown
Improved CCI with Momentum OscillatorThis indicator is free to all Oasis Trading Group members.
The Improved CCI is a basic CCI with a momentum gauge applied to the zero line. This indicator is used to find breakouts/breakdowns and when they have lost momentum.
A bullish entry would be found when the CCI has broken the 100 line when the Momentum gauge is above zero or when the CCI has crossed above the -100 line when the Momentum gauge is above zero.
A bearish entry would be found when the CCI has broken the -100 line when the Momentum gauge is below zero or when the CCI has crossed below the 100 line when the Momentum gauge is below zero.
For Access or Questions: Private message us. Thank you.
52 Week High/Low to YesterdayThis script adds the 52 weeks (one year) high/low to the chart but it wouldn't update the value on the current trading day, so that it would remain at the same level for the whole trading day. It can come really handy for day trading the day of the 52 weeks high/low breakout/breakdown.
Blockgain INTRA-SWING SignalsRules 1h to 4h for Crypto:
- This script should be used as confirmation of an entry that the trader is preparing, since the signal can move 2 or 3 candles because it is calculating the chances of a rally in that area.
- The S and B are Stoch crosses in overbought and oversold
- The green and red triangles indicate new maximums and new minima of 4 candles back
- EMAS 10, 26, 50 refer to Ichimoku
Tenkan-sen (9) (10), Kijun-sen (26), Senkou Span B (52) (50)
- Supports and resistances calculated at 20 candles
Study INTRA-SWINGContent
- ema of 50 changes color if the price is above or below it
-ema of 10 yellow
-ema of 200 white
- Green triangles under the candles indicate new maxima compared to the previous 4 candles
-Red triangles indicate new minima with respect to the previous 4 candles
-the green and orange arrows of high altitude indicate Longs and Shorts for Intradia or Swing (recommended in temporalities from 1h to 4h), for more temporality should change the period for a greater one
-Alarms for:
- Green and red triangles like Break Out, Break Down
-Long ARROW green arrow
-Orange arrow SHORT ARROW
// NOTE: this Script is in Beta mode and next updates will be made
Volume w/ Threshold and Editable MA PeriodJust a simple script that tweaks the original Volume one.
The purpose is creating a threshold which we'll use to put an alert on. This way, we can be notified whether Volume pumps.
Useful for spotting breakouts, breakdowns and pumps.
Threshold is simply a coeff * ma(volume,period). Coeff is editable as well.
Hope this helps!
Kozlod - Channel Break Out AlertsStudy version with alerts of standard "Channel Break Out Strategy".